Three Pillars With Zero Answers: A New Scorecard for Observability
The 'Three Pillars of Observability' work great for Google-sized applications - but most apps don't come near this size, and thus need a different approach.
Join the DZone community and get the full member experience.
Join For FreeThe Orthodoxy
Have you heard about the “three pillars of observability” yet? No? The story goes like this:
If you’re using microservices, you already know that they’re nearly impossible to understand using a conventional monitoring toolchain: since microservices were literally designed to prevent “two-pizza” DevOps teams from knowing about each other, it turns out that it’s incredibly difficult for any individual to understand the whole or even their nearest neighbor in the service graph.
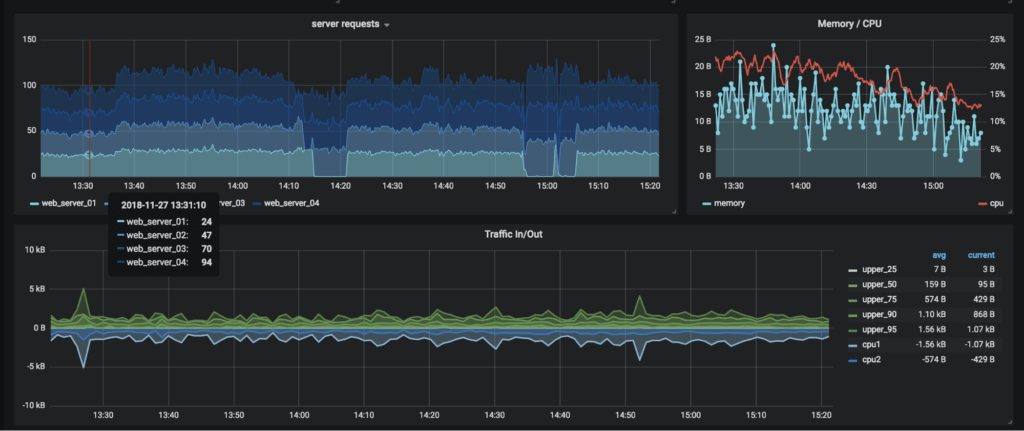
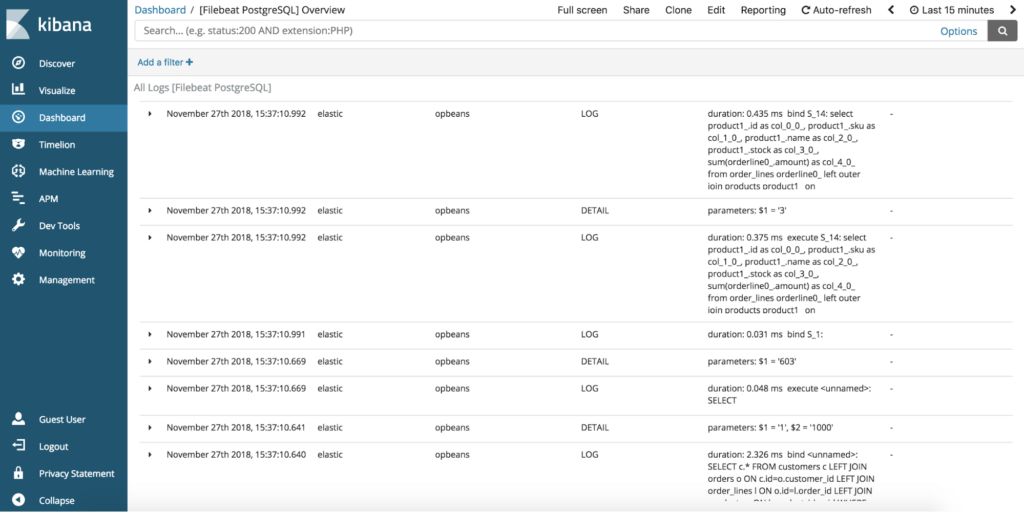
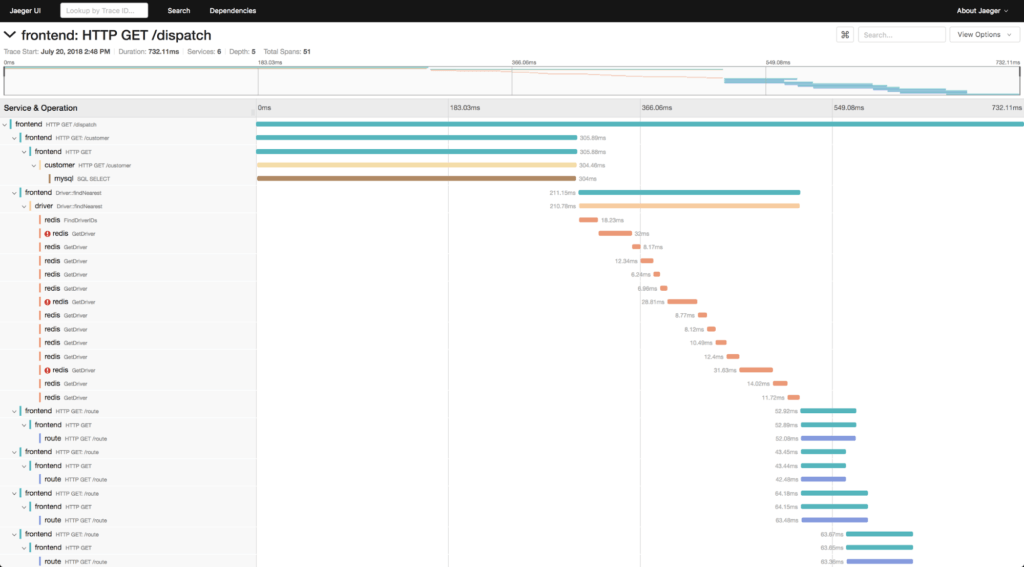
Well, Google and Facebook and Netflix were building microservices before they were called microservices, and I read on Twitter that they already solved all of these problems… phew! They did it using Metrics, Logging, and Distributed Tracing, so you should, too – those are called “The Three Pillars of Observability,” and you probably even know what they look like already:
So, if you want to solve observability problems like Google and Facebook and Twitter, it’s simple… find a metrics provider, a logging provider, a tracing provider, and voila: your DevOps teams will bask in the light of an observable distributed system.
Fatal Flaws
Perhaps the above is hyperbolic. Still, for those who deployed “the three pillars” as bare technologies, the initial excitement dissipated quickly as fatal flaws emerged.
Metrics and Cardinality
For Metrics, we all needed to learn a new vocab word: cardinality. The beauty of metrics is that they make it easy to see when something bad happened: the metric looks like a squiggly line, and you can see it jump up (or down) when something bad happens. But diagnosing those anomalous moments is deeply difficult using metrics alone… the best we can do is to “drill down,” which usually means grouping the metric by a tag, hoping that a specific tag value explains the anomaly, then filtering by that tag and iterating on the drill-down process.
“Cardinality” refers to the number of elements in a set. In the case of metrics, cardinality refers to the number of values for any particular metric tag. If there are 5 values, we’re probably fine; 50 might be ok; 500 is probably too expensive; and once we get into the thousands, you simply can’t justify the ROI. Unfortunately, many real-world tags have thousands or millions of values (e.g., user-id, container-id, and so forth), so metrics often prove to be a dead end from an investigative standpoint.
Logging Volumes With Microservices
For Logs, the problem is simpler to describe: they just become too expensive, period. I was at a speaker dinner before a monitoring conference last year, and one of the other presenters – a really smart, reputable individual who ran the logging efforts for one of today’s most iconic tech companies – was giving a talk the following day about how to approach logging in a microservices environment. I was excited about the topic and asked him what his basic thesis was. He said, “Oh, it’s very simple: don’t log things anymore.”
It’s easy to understand why: if we want to use logs to account for individual transactions (like we used to in the days of a monolithic web server’s request logs), we would need to pay for the following:
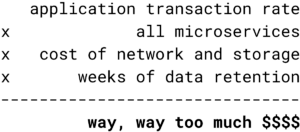
Logging systems can’t afford to store data about every transaction anymore because the cost of those transactional logs is proportional to the number of microservices touched by an average transaction. Not to mention that the logs themselves are less useful (independent of cost) due to the analytical need to understand concurrency and causality in microservice transactions. So conventional logging isn’t sufficient in our brave new architectural world.
Tracing and Foreknowledge
Which brings us to “Distributed Tracing,” a technology specifically developed to address the above problem with logging systems. I built out the Dapper project at Google myself. It certainly had its uses, especially for steady-state latency analysis, but we dealt with the data volume problem by applying braindead, entirely random, and very aggressive sampling. This has long been the elephant in the room for distributed tracing, and it’s the reason why Dapper was awkward to apply in on-call scenarios.
The obvious answer would be to avoid sampling altogether. For scaled-out microservices, though, the cost is a non-starter. It’s more realistic to defer the sampling decision until the transaction has completed: this is an improvement, though that approach masks a crucial question: which traces should we sample, anyway? If we’re restricting our analysis to individual traces, we typically focus on “the slow ones” or those that result in an error; however, performance and reliability problems in production software are typically a byproduct of interference between transactions, and understanding that interference involves much more sophisticated sampling strategies that aggregate across related traces that contend for the same resources.
In any case, a single distributed trace is occasionally useful, but a bit of a hail mary. Sampling the right distributed traces and extracting meaningful, accessible insights is a broader challenge, yet much more valuable.
And About Emulating Google (et al.) in the First Place…
Another issue with “The Three Pillars” is the very notion that we should always aspire to build software that’s appropriate for the “planet-scale” infrastructure at Google (or Facebook, or Twitter, and so on). Long story short: don’t emulate Google. This is not a dig on Google – there are some brilliant people there, and they’ve done some terrific work given their requirements.
But! Google’s technologies are built to scale like crazy, and that isn’t necessarily “good”: Jeff Dean (one of those brilliant Googlers who deserves all of the accolades – he even has his own meme) would sometimes talk about how it’s nearly impossible to design a software system that’s appropriate for more than 3-4 orders of magnitude of scale. Further, there is a natural tension between a system’s scalability and its feature set.
Google’s microservices generate about 5 billion RPCs per second; building observability tools that scale to 5B RPCs/sec, therefore, boils down to building observability tools that are profoundly feature poor. If your organization is doing more like 5 million RPCs/sec, that’s still quite impressive, but you should almost certainly not use what Google uses: at 1/1000th the scale, you can afford much more powerful features.
Bits vs. Benefits
So each “pillar” has a fatal flaw (or three), and that’s a problem. The other problem is even more fundamental: Metrics, Logs, and Distributed Traces are just bits. Each describes a particular type of data structure, and when we think of them, we tend to think of the most trivial visualization of those data structures: metrics look like squiggly lines; logs look like a chronological listing of formatted strings; traces look like those nested waterfall timing diagrams.
None of the above directly addresses a particular pain point, use case, or business need. That is, with the “three pillars” orthodoxy, we implicitly delegate the extraordinarily complex task of actually analyzing the metric, log, and trace data as “an exercise to the reader.” And, given the fatal flaws above and the subtle interactions and co-dependencies between these three types of data, our observability suffers greatly as a result.
In Our Next Installment…
We need to put “metrics, logs, and tracing” back in their place: as implementation details of a larger strategy – they are the fuel, not the car. We need a new scorecard: stay tuned for our next post, where we will introduce and rationalize a novel way to independently measure and grade an observability strategy.
Published at DZone with permission of Ben Sigelman. See the original article here.
Opinions expressed by DZone contributors are their own.
Comments