How to Troubleshoot Sudden CPU Spikes
Your Java application has been running fine, but all of a sudden CPU consumption starts to go higher and higher... sound familiar?
Join the DZone community and get the full member experience.
Join For FreeYour Java application has been running fine, but all of a sudden CPU consumption starts to go higher and higher, until it stays at 80 - 100%. Even if you remove the server from load balancer (so that traffic isn’t sent anymore), still the CPU consumption is maxed out. The only way to recover from this problem is to recycle the application. After recycling, the application might be running fine for a few hours (or a few minutes depending on your karma :-)) before the CPU consumption starts to spike up.
Does this pattern sound familiar? :-). This article talks about how to troubleshoot these kinds of sudden CPU spikes.
This type of sudden CPU spike usually happens because of two reasons:
- Repeated Full GCs
- Infinitely looping threads
Let’s discuss them in detail.
1. Repeated Full GCs
When Garbage Collection runs repeatedly in the JVM, CPU consumption will start to spike. Garbage Collection is a computation-intensive operation, as it requires marking, sweeping, compacting, and relocating objects in the memory. But what causes Garbage Collection to run repeatedly?
When an application is suffering from a memory leak, it will continuously create objects without releasing them. Once the application’s memory usage hits the threshold point, Garbage Collection is triggered. Garbage Collection will complete its run, but the Garbage Collection process won’t be able to free up the memory, as the objects are actively referenced. Now JVM will once again check whether memory usage is high, because Garbage collection didn’t free up any memory space. So JVM will trigger Garbage collection once again. This cycle will continue, causing the Garbage collection to run again and again, which will cause the CPU to spike up. This is one of the primary reasons for the CPU to spike up all of sudden.
How to Troubleshoot Repeated Full GCs?
Capture the Garbage Collection log from the application suffering from high CPU consumption.
Analyze the Garbage Collection log file to see whether Full GCs are running repeatedly. As analyzing Garbage collection log files aren’t trivial, consider using an online Garbage collection log analysis tool such as http://gceasy.io/.
http://gceasy.io/ will report whether the application is suffering from repeated Full GCs or not.
If http://gceasy.io/ confirms that the application is suffering from repeated Full GCs, then capture the heap dump from the JVM and analyze it using memory analysis tools such as Eclipse MAT to see what is triggering the memory leak.
Real-World Example
An SOA application in a major financial organization started to exhibit this kind of sudden CPU spike. We captured the Garbage Collection logs from the JVMs that exhibited the problem. We uploaded the Garbage Collection log file to the http://gceasy.io/ tool.

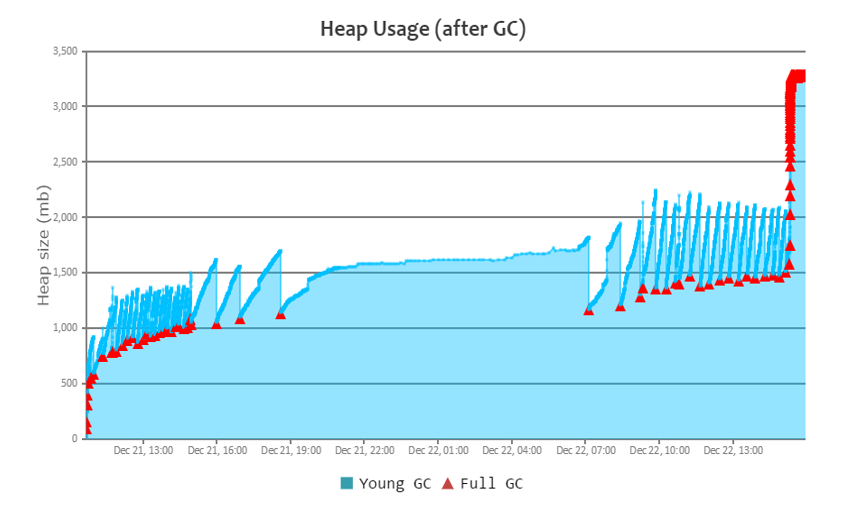 Fig 1: Report generated by http://gceasy.io/ - towards the right end, you can see Full GCs running repeatedly without memory getting reclaimed.
Above is the excerpt from the report generated by http://gceasy.io/. The tool correctly pointed out that the application is suffering from a memory leak (see the fire icon at the top). You can also notice towards the right end of the graph, Full GCs running repeatedly without memory being reclaimed. So the tool helped us to conclude that the application’s CPU spike was happening because Full GCs are running repeatedly.
As a next step we captured the heap dump from the JVM and analyzed it using Eclipse MAT. Analysis revealed that in a recent code deployment a static HashMap was introduced to the code. Objects were added to this HashMap for certain types of transactions. This HashMap kept growing and growing causing the memory leak. Once the HashMap was made a local variable (as supposed to a static variable) in the method, the problem got fixed.
2. Infinitely Looping Threads
When a thread loops infinitely in code the CPU will also start to spike up. (In a way, repeated Full GCs pattern is also a kind of infinite looping.) Consider the following code:
while (aCondition) {
    aCondition = doSomething();
}
As per the above code, until “aCondition” has the value true, the doSomething() method will be executed. Assume a case where “aCondition” always ends up having the value “true,” then the doSomething() method will be executed infinitely. When a thread starts to loop infinitely, the CPU will start to spike up.
NOTE: If code within the while loop makes any external database calls or puts the thread to sleep or waits, then the CPU will not spike up because sleep or wait doesn’t consume CPU cycles. Only active executions will cause the CPU to spike up.
How to Troubleshoot Infinite Looping in the Code?
Once the application starts to exhibit the sudden CPU spike, capture 3 thread dumps from the application in an interval of 10 seconds.
If a thread is infinitely looping, it will remain in the same method or same line(s) of code. Now analyze whether any of the threads are in the RUNNABLE state in the same method or same line(s) of code across all the 3 dumps. As analyzing thread dumps is tedious, consider using an online thread dump analyzer tool such as http://fastthread.io/. This tool will report the threads that are looping infinitely and the line(s) of code in which they are looping.
Once you know which line(s) of code is causing the thread to loop infinitely, it should be easy to fix the problem. With these sort of problems, it’s hard to isolate the root cause, but fixing them is trivial.
Real-World Example
A major travel application started to experience this sudden CPU spike problem. All of a sudden a few of their JVMs started to consume high CPU. Even though traffic volume was low, it was still suffering from this problem. Even after removing the high-CPU-consuming JVMs from the load balancer (so that traffic wasn’t sent anymore), the CPU spike still continued. Only when JVM instances were recycled did the problem go away. But once JVMs were started, a few hours later CPU consumption started to spike up again.
We captured the thread dumps from the JVMs suffering from this CPU spike. We uploaded the captured thread dumps to the http://fastthread.io/ tool. In the tool there is a section called “Runnable Threads,” which reports all the threads that are in the RUNNABLE state in the same method or line(s) of code across all the 3 thread dumps, along with the line(s) of code in which it was looping. In this section, the tool accurately reported the infinitely looping threads. In fact, the tool even put the fire icon near the threads causing the CPU spike. See the Fig 2.
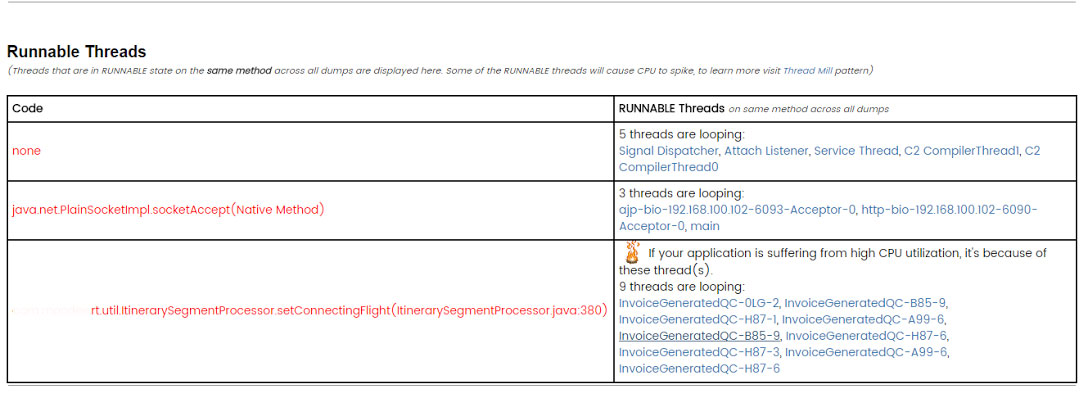
Fig 2: http://fastthread.io/ tool reporting infinitely looping threads. Note the fire icon.
From the screenshot, you can see there are 9 threads: InvoiceGenratedQC-0LG-1, InvoiceGenratedQC-B85-9, InvoiceGenratedQC-H87-1 …. looping on the setConnectingFlight() method of ItinerarySegmentProcessor.java file in line #380. If you want to know the complete stack trace of those threads, you can click on the threads reported in this section (refer to Fig 3).
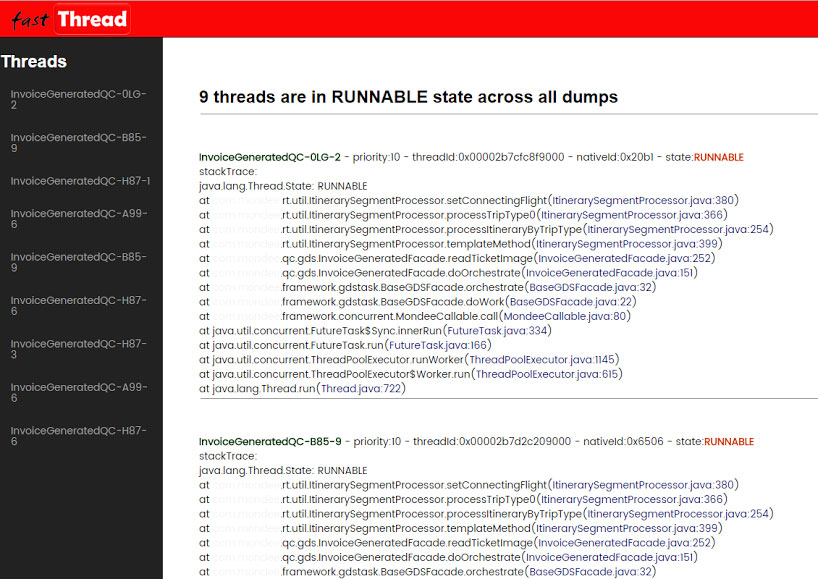
Fig 3: Stack traces of infinitely looping threads reported by http://fastthread.io tool
Below is the source code of the setConnectingFlight() method:
private void setConnectingFlight(Itinerary baseItinerary, Itinerary connectingItinerary)
{
       Itinerary tempcurrentItinerary = baseItinerary;
       while(tempcurrentItinerary.getConnectingItinerary() != null)
       {
              tempcurrentItinerary = tempcurrentItinerary.getConnectingItinerary();
       }
       tempcurrentItinerary.setConnectingItinerary(connectingItinerary);
}
Basically the thread is looping infinitely on this while loop (which is the line #380):
while(tempcurrentItinerary.getConnectingItinerary() != null).If you notice the implementation, this code is trying to get the last connecting itinerary. Unfortunately because of the bug in the code tempcurrentItinerary, that object was built with a circular reference between the connecting itineraries in few scenarios. So the thread started to loop infinitely on the while clause. Once that circular reference between the itineraries was fixed, the problem was resolved.
Last note: Most of us know that HashMap is not a thread-safe data structure. But not everyone knows that when multiple threads access the HashMap’s get() and put() methods concurrently, it will result in infinite looping. This is another example of infinite looping thread, which will also cause CPU to spike.
Happy debugging!!
Opinions expressed by DZone contributors are their own.
Comments