Working With Centralized Logging With the Elastic Stack
See how Filebeat works with the Elastic, or ELK, stack to locate problems in distributed logs for an application with microservices architecture.
Join the DZone community and get the full member experience.
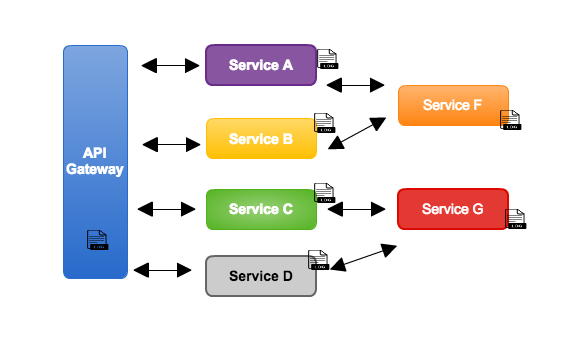
Join For FreeWhen we opt for a microservice-based architecture, one of the main problems we are about to start is how to see the application logs and try to find problems. Because the application logs can be distributed on many machines, as we can see in the figure below:
From the outset of the project, the logs should be a concern, and as the project grows, the trail of errors and success should be easily found. Depending on the organization, a mistake can cost a lot of money or even stop a business's operation for a few hours, causing a lot of damage.
A good stack that I have been using in my projects is the ELK stack, or Elastic Stack. It is based on three main components, but I consider four because there is one in this very useful scenario:
- Elasticsearch.
- Logstash.
- Kibana.
- FileBeat.
Elasticsearch is a highly scalable full-text search and analysis engine. It allows storing, searching, and analyzing of large volumes of data quickly and in near real time. It is a RESTful distributed search and analysis tool capable of solving a growing number of use cases. Like the heart of the Elastic pile, it centrally stores your data so you can discover what's expected and discover the unexpected.
Logstash is a processing pipeline that ingests data from a multitude of sources at once, transforms it, and then sends it to Elasticsearch (because it can send to other databases as well).
Data is usually scattered or spread across many systems in various formats. Logstash supports a variety of entries that draw events from multiple common sources all at the same time. Easily ingest your logs, metrics, web applications, data storage, and various services. As the data arrives, the Logstash filters analyze each event, identify the named fields to build the structure, and transform them to converge in a common format for analysis.
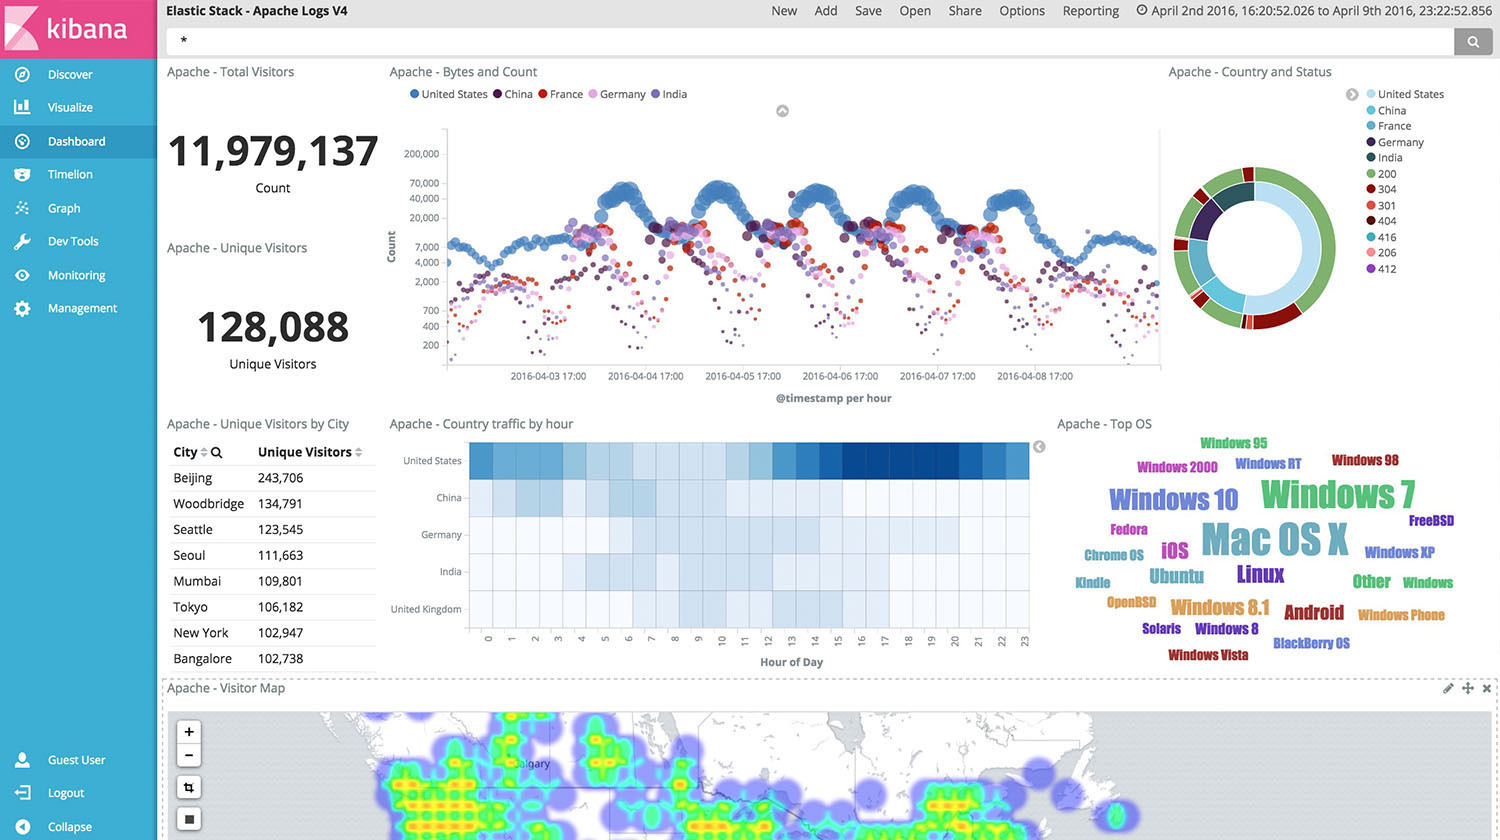
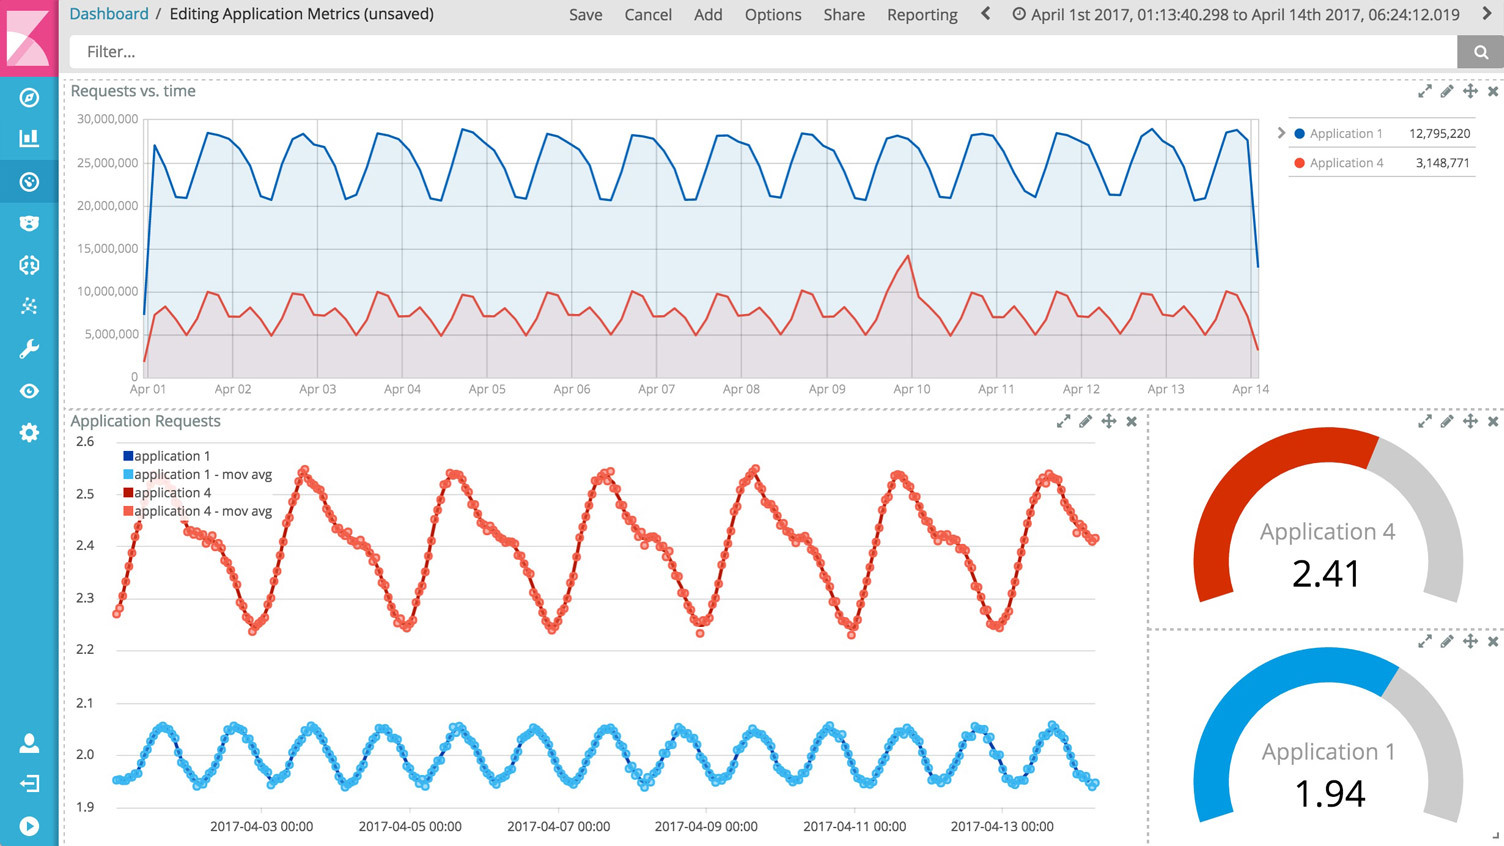
Kibana allows you to view your Elasticsearch data and navigate the data, creating filters, aggregations, counts, and combinations; that is, a visual way of navigating the data that is stored in Elasticsearch.
With Kibana, you can create graphs of various types:
Filebeat helps keep things simple by offering a lightweight way to forward and center logs and files. Instead of making a tail in the file machine, the fileBeat agent does it for us.
In each machine where there is service is installed a fileBeat agent that will be in charge of observing the logs and forwards to its configured Logstash.
Installation
To configure this stack in the initial mode, we can choose to have only one machine where we will put Elasticsearch, Logstash, and Kibana.
NOTE: In the example below I am using a CentOS operating system.
ElasticSearch installation:
sudo rpm --import https://artifacts.elastic.co/GPG-KEY-elasticsearchCreate the folder /etc/yum.repos.d/, create the file elasticsearch.repo, and add in this content to the file elasticsearch.repo:
[elasticsearch-5.x]
name=Elasticsearch repository for 5.x packages
baseurl=https://artifacts.elastic.co/packages/5.x/yum
gpgcheck=1
gpgkey=https://artifacts.elastic.co/GPG-KEY-elasticsearch
enabled=1
autorefresh=1
type=rpm-md
sudo yum install elasticsearchIf everything is okay, the command curl -XGET 'localhost:9200/?pretty' should return JSON with default content.
Logstash installation:
First Java 8 or Java 9 should be installed.
sudo rpm --import https://artifacts.elastic.co/GPG-KEY-elasticsearchCreate the folder /etc/yum.repos.d/, create the file logstash.repo, and add in this content to the file logstash.repo:
[logstash-5.x]
name=Elastic repository for 5.x packages
baseurl=https://artifacts.elastic.co/packages/5.x/yum
gpgcheck=1
gpgkey=https://artifacts.elastic.co/GPG-KEY-elasticsearch
enabled=1
autorefresh=1
type=rpm-md
sudo yum install logstashWith these tools working, we can already configure the stack to start ingesting data in Elasticsearch.
The first tool to be configured is Logstash.
Configuration
Logstash
In the Logstash config folder, the INPUT, FILTER, and OUTPUT must be configured for the files that will be consumed in my example:
input {
    beats {
        port => "5043"
    }
}
 filter {
    grok {
        match => { "message" => "\A%{TIMESTAMP_ISO8601}%{SPACE}%{LOGLEVEL}%{SPACE}%{INT}%{SPACE}%{SYSLOGPROG}%{SPACE}%{SYSLOG5424SD}%{SPACE}%{JAVACLASS:service}%{SPACE}%{NOTSPACE}%{SPACE}%{JAVALOGMESSAGE:java_message}"}
    }
    grok {
        match => { "message" => "\A%{TIMESTAMP_ISO8601}%{SPACE}%{SYSLOG5424SD}%{CRON_ACTION}%{JAVACLASS:servico}%{CRON_ACTION}%{SYSLOG5424SD}%{SPACE}%{JAVALOGMESSAGE:java_message}"}
    }
}
output {
    elasticsearch {
        hosts => [ "localhost:9200" ]
        index => [“my-example"]
    }
}
To build this pattern of GROK, you can use this site , which gives the stesp by step to analyze the log.
After this configuration is applied, Logstash must be restarted.
FileBeat
The agent must be configured machine by machine, a task that can be made easier using Ansible, which is triggered from only one machine, adding the agent in the others. For example, I created the file playbook-filebeat.yml; inside it are installation and configuration commands.
- hosts: "{{ lookup('env’,'HOST') }}"
  vars:
    http_port: 80
    max_clients: 200
  remote_user: my-user
  environment:
    AWS_ACCESS_KEY_ID: MYKEY
    AWS_SECRET_ACCESS_KEY: MYSECRET
  tasks:
    - name: Stop FileBeat if running
      become: yes
      become_method: sudo
      shell: '/etc/init.d/filebeat stop'
      ignore_errors: yes

    - name: FileBeat download
      shell: "curl -L -O https://artifacts.elastic.co/downloads/beats/filebeat/filebeat-5.2.2-x86_64.rpm"
      ignore_errors: yes

    - name: FileBeat Install
      become: yes
      become_method: sudo
      shell: "sudo rpm -vi filebeat-5.2.2-x86_64.rpm"
      ignore_errors: yes

    - name: Install Pip with Curl and Python
      get_url: url=https://bootstrap.pypa.io/get-pip.py  dest='/home/ec2-user/'
      ignore_errors: yes

    - name: execute install script
      become: yes
      become_method: sudo
      shell: 'python /home/ec2-user/get-pip.py'
      ignore_errors: True

    - name: install aws cli
      become: yes
      become_method: sudo
      shell: 'pip install --upgrade --user awscli'

    - name: get script from s3
      become: yes
      become_method: sudo
      shell: '~/.local/bin/aws s3 cp s3://scripts/filebeat.conf-{{ENV}}.yml /etc/filebeat/filebeat.yml --region sa-east-1'

    - name: Stop FileBeat if running
      become: yes
      become_method: sudo
      shell: '/etc/init.d/filebeat start'
      ignore_errors: yes
You can run this playbook with this command:
#ansible-playbook playbook-conf/playbook-filebeat.yml --private-key my_pem_file.pem -e "HOST"=my.service.hostDetails on the use of Ansible in this post can be found here.
To avoid entering the machine and adding the configuration of FileBeat, I put my configuration file in S3 and, from inside the machines, I look for this file.
FileBeat configuration file to be added in /etc/filebeat/filebeat.yml:
filebeat.prospectors:
- input_type: log
  paths:
    - /logs/service1/service.log
output.logstash:
  hosts: ["logstash-host:5043”]
NOTE: If you do not want to use Ansible, you can perform tasks manually.
With this structure running, we can start consuming the application logs. An example of Logs to be filtered by GROK pattern:
2017-07-04 11:11:37.921  INFO 60820 --- [pool-3-thread-1] br.com.service.ContaService      : GET DATA
2017-07-04 11:11:37.952  INFO 60820 --- [pool-3-thread-1] br.com.ContaServiceLog           :  CALL SOMEthing
2017-07-04 11:11:37.954  INFO 60820 --- [pool-3-thread-1] br.com.ContaServiceLog           : http://some-service
Now we have this structure working the structure according to the figure below: 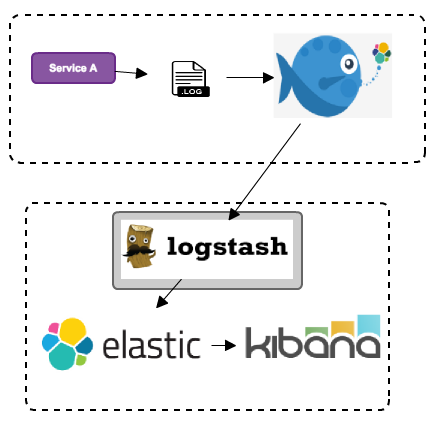 The ELK stack is very powerful; from here, we can create countless metrics, search, filters, and more with the data that is inserted in ElasticSearch.
References:
Opinions expressed by DZone contributors are their own.
Comments