Visualizing Your Data With MongoDB Compass
If you're using MongoDB, take a look at the Compass, a GUI designed to help you get a better look at your data without getting lost.
Join the DZone community and get the full member experience.
Join For FreeIntroduction
Since the inception of MongoDB, the primary interface to the database has been the mongo shell. While the shell is powerful, it can be intimidating for new users, and let's face it — there are lots of things about managing data and a database that are easier to do with a GUI.
In MongoDB 3.2 we introduced MongoDB Compass — our GUI for MongoDB. Our goal with Compass is to provide all the power of the mongo shell through an intuitive, easy to use GUI.
In this post, we'll take a closer look at MongoDB Compass and our latest release, which adds CRUD capabilities and a long list of other exciting features.
MongoDB 3.2 Introduces Compass v1.0
At MongoDB our user community is extremely important to us. Through meetups, community events, surveys, conferences — just to name a few — we collect user feedback to ensure we continue to build products that address and solve the needs of our users. Over the past couple of years, we have received an overwhelming number of requests for a schema visualizer and query builder.
With MongoDB 3.2, we answered our users with MongoDB Compass v1.0 — a GUI schema visualization tool and query builder. MongoDB Compass provides a native GUI to analyze collections and beautifully visualize your schema.
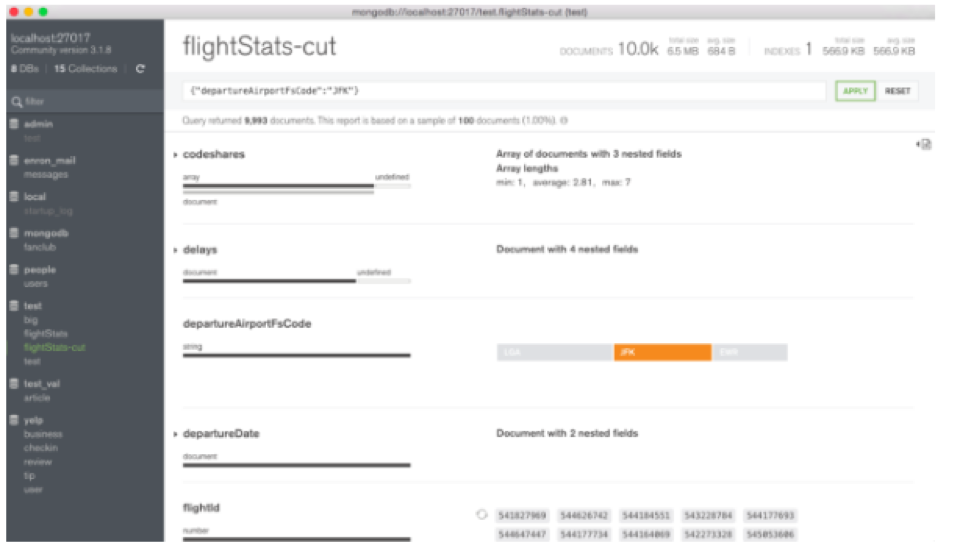
Evolution of Compass
During our beta program for Compass, we received a lot of great feedback. The three most requested features were: edit/insert/delete operations, visualization of indexes, and visualization of query performance.
In Compass v1.2, which is now in GA, we added the ability to visualize indexes and query performance.
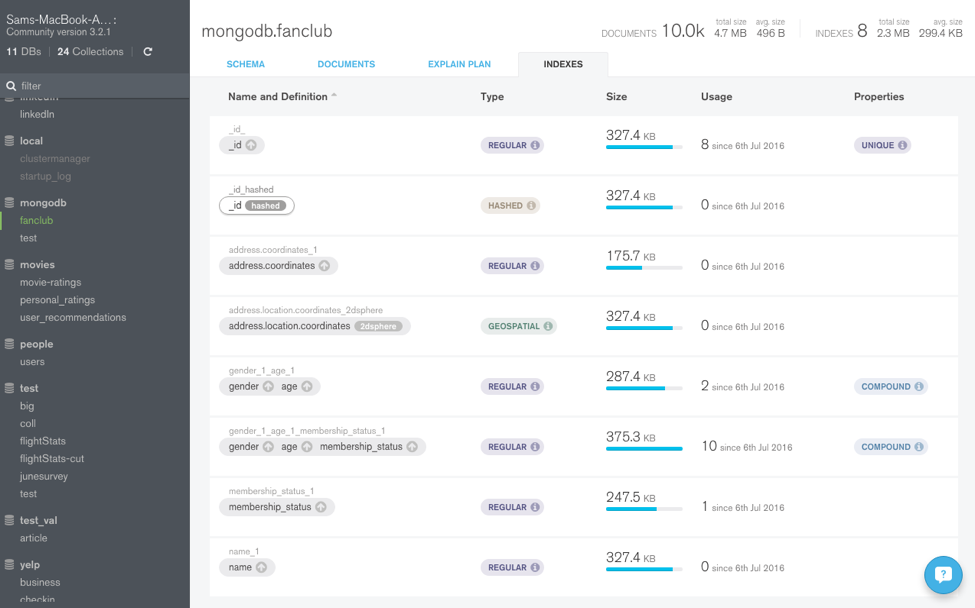
The figure below highlights the details of indexes in a collection. Users are not only able to determine which fields are indexed, but also their type, size, usage, and properties of their indexes.
Introducing Compass v1.3
Today, we are very excited to introduce Compass v1.3, currently available in beta. Compass v1.3 contains many new features, including:- Insert/edit/delete/clone documents through the GUI
- Build and visually interact with geo/coordinate data to construct queries in a few clicks of a button
- Visual explain plans to understand the performance of a query
- SSH tunnels to allow users to connect securely from outside of a datacenter firewall
Edit/Insert/Delete/Clone Documents
The most requested feature in our beta program was the ability to edit/insert/delete documents. With Compass v1.3, users will be able to:- Modify existing documents
- Insert new documents
- Delete existing documents
- Clone the schema and values of an existing document
 it puts the document in edit mode.

 button at the top of the document list.

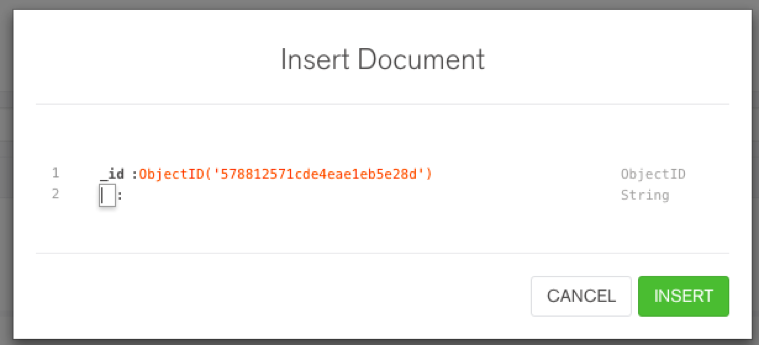
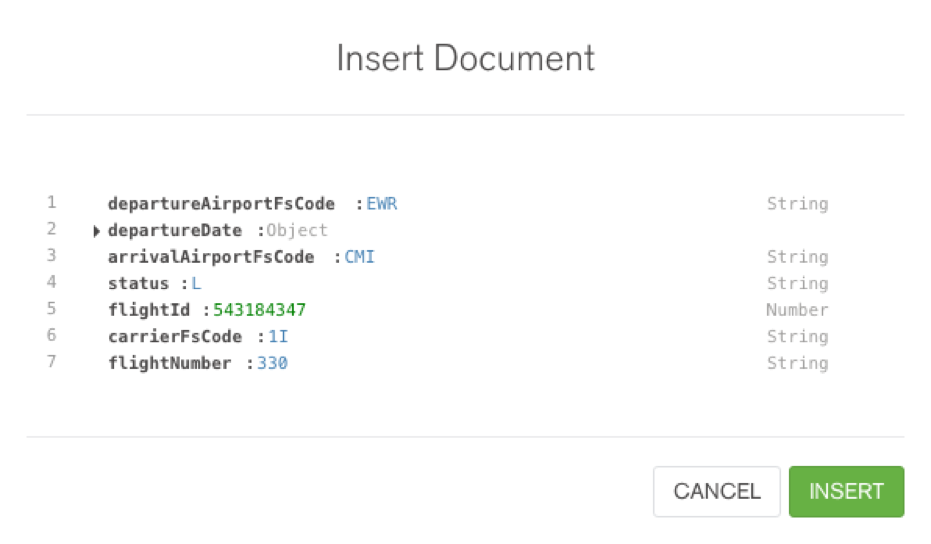
 will open up a new window where a user can modify the contents of the document to be inserted.
 the top right corner of the document in the document list to delete a document.

 within the document. Compass will clone all the elements of the document, except for _id where a new _id will be generated.

Introducing Map and Geo Query Features
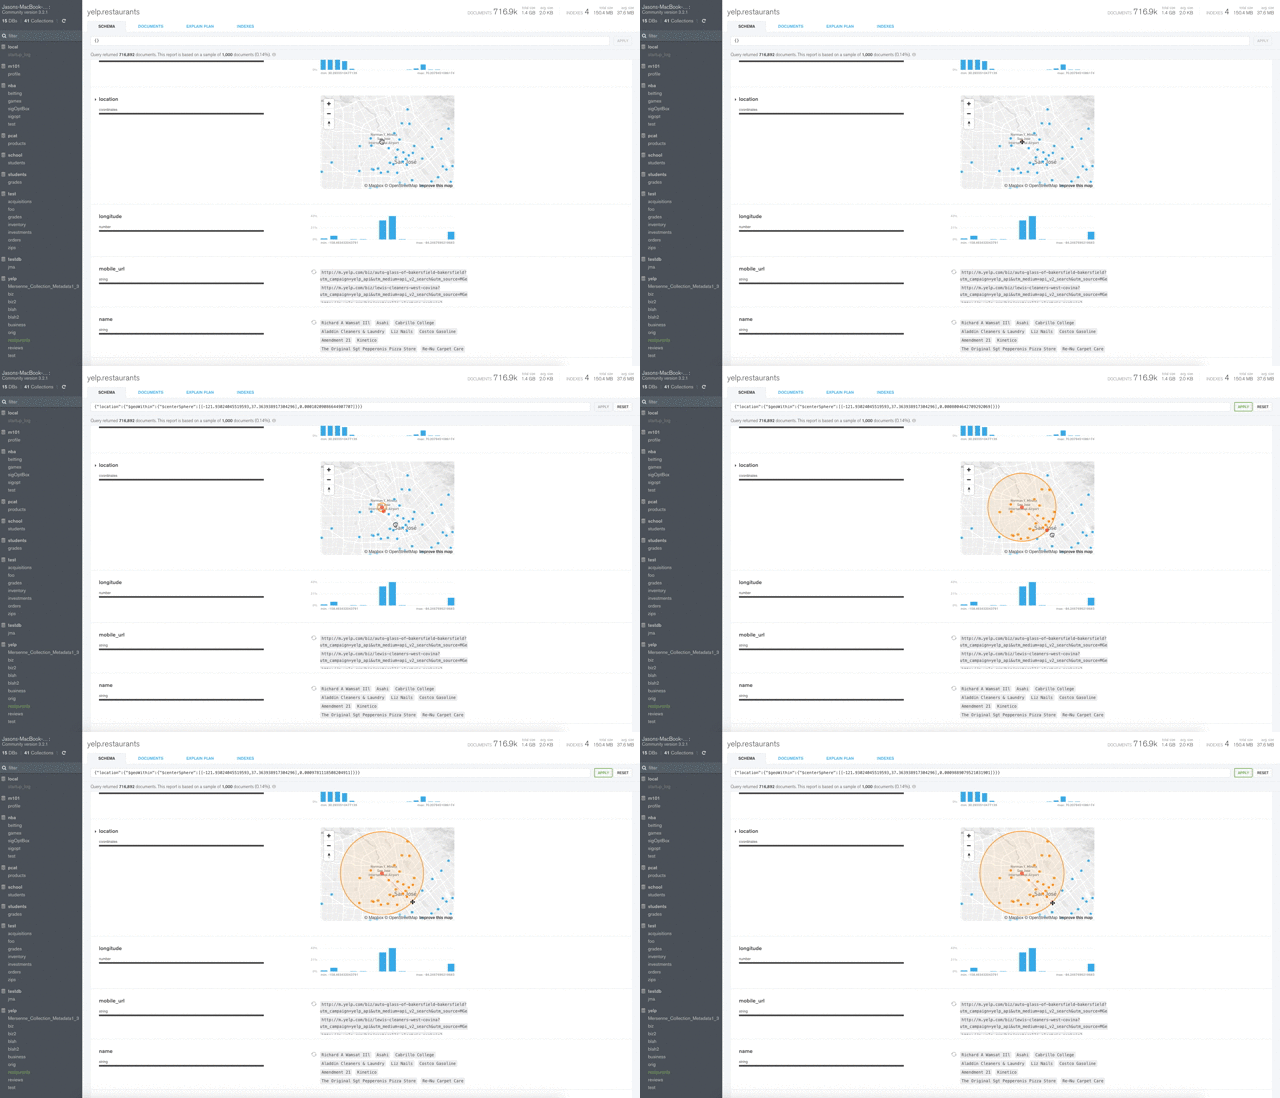
Another powerful feature for Compass v1.3 is the ability to see and understand geographical data. Geo data can be displayed on an interactive map, and drawing on the map creates a geo-query with resulting coordinate pairs displayed on the map. The map can be zoomed and panned with a click and hold of the mouse. Holding the shift key enables a circle to appear and the circle can be moved, expanded, or retracted.
The example below represents a database of Yelp restaurant reviews in Silicon Valley. Here, restaurants with 4 stars (or greater) and within a 5 mile radius of San Jose Airport are selected. Expanding or retracting the radius of the circle automatically builds a new query in the Compass command bar. In this example, applying the query returns all restaurants with 4 stars (or greater) and within a 5 mile radius of San Jose Airport.
Visualize Query Execution Performance (Explain Plans)
Compass also provides the ability to visualize explain plans. To access this feature, users navigate to the “EXPLAIN PLAN” tab.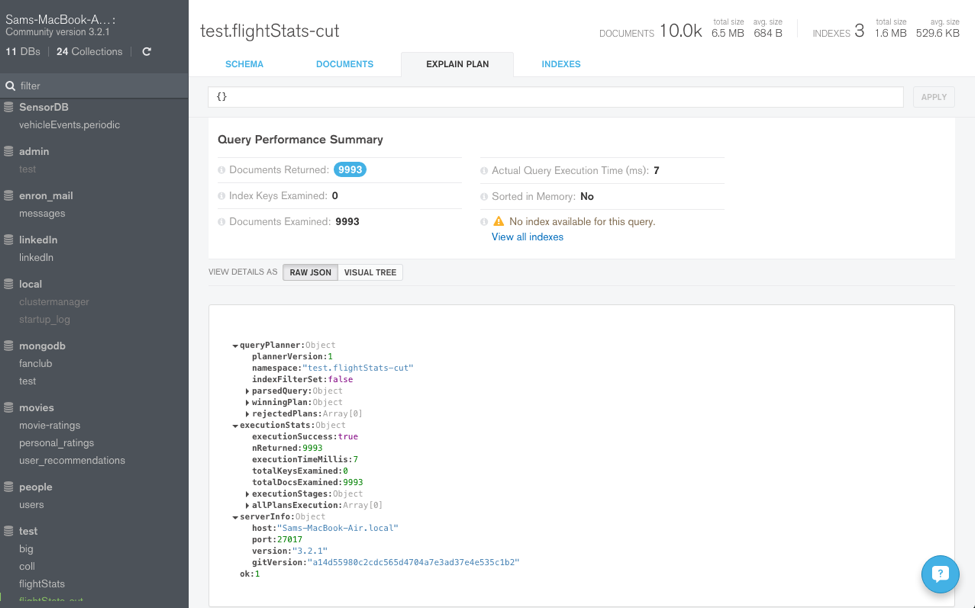
Key information about the query execution plan is highlighted.

Explain plans are easier to understand in a new query plan visualization. Here a tree structure presents information on how the query performed — # documents returned, query execution time, index usage, etc. Each stage of the pipeline is shown as a node in the tree. This makes viewing explain plans in sharded clusters extremely simple.
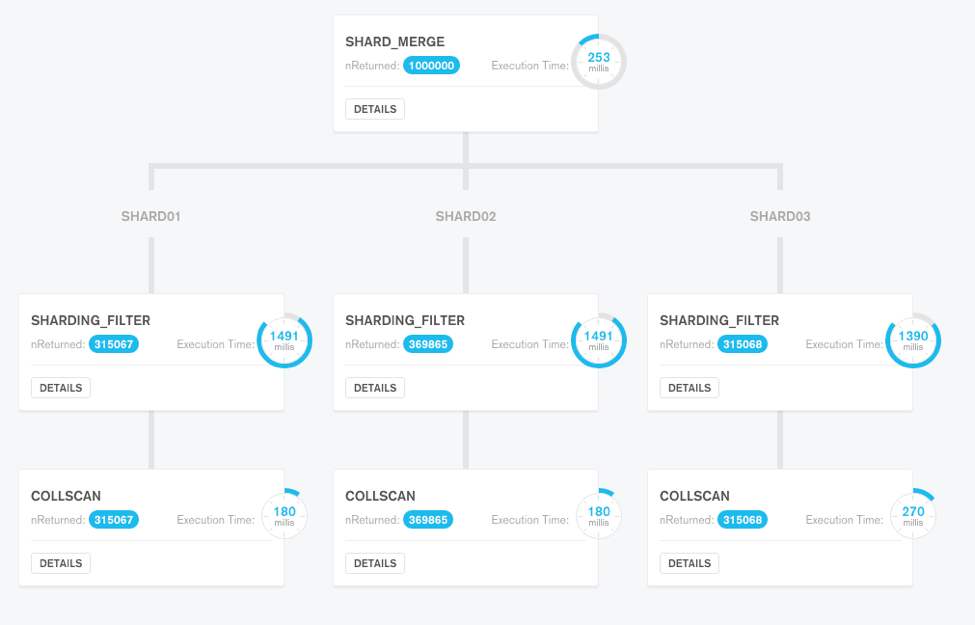
Details of each stage of the query plan can be investigated in further detail by clicking on the button, which provides more information about that particular stage.
Comprehensive Security
MongoDB Compass provides comprehensive enterprise-grade security. Compass supports Kerberos, MongoDB-CR, SCRAM-SHA-1, LDAP-based authentication, as well as x.509 certificates. SSL/TLS encrypts data transferred “over the wire” between MongoDB and the clients. Users are also now able to connect to deployments via ssh tunnel — this is useful for connecting to production clusters when outside of the data center firewall.
Benefits of Compass
MongoDB Compass addresses an important aspect in application development today as new software development trends and practices emerge. Microservices and continuous delivery continue to become more pervasive, resulting in shifts in operational culture and organizational thinking. Developer and operation teams can no longer operate in silos but must be more tightly coupled to successfully deploy new features.
MongoDB Compass addresses these evolving organizational requirements and provides many benefits ideal for modern app development:
Faster time to market: Modern software practices, such as DevOps, use a wide variety of different components that require teams to be well versed in many technologies. Shared insight between teams is critical to ensure multiple technologies integrate seamlessly and function as expected. Compass provides valuable insight into your data so that teams can efficiently integrate MongoDB into their IT stack, resulting in quicker prototyping and faster time to market.
Easier project handoffs: MongoDB’s flexible schema and rich document structure make it easy to build applications with any data model. Though this is empowering for developers, it may be unfamiliar for new teams picking up the project. This problem can be compounded when teams are distributed. With Compass, teams can quickly visualize and understand the organization of their data and share that with other teams to minimize uncertainty during project handoffs.
Increased productivity: GUIs provide a natural visualization tool that resonate with many users. With Compass, new users can quickly visualize the data model so they spend more time deriving value from their data, instead of working with their data.
Availability
MongoDB Compass is included with both MongoDB Professional and MongoDB Enterprise Advanced subscriptions. MongoDB Compass is free to use for evaluation and in development environments.
If you enjoyed this article and want to learn more about MongoDB, check out this collection of tutorials and articles on all things MongoDB.
Published at DZone with permission of Jason Ma, DZone MVB. See the original article here.
Opinions expressed by DZone contributors are their own.


Comments