

When Perfect Data Breaks: The Journey from Data Quality to Data Observability
Data quality checks often miss silent failures. Use data observability to monitor data in motion and catch issues traditional tools miss.
Join the DZone community and get the full member experience.
Join For FreeThe Day Everything Looked Fine — Until It Wasn’t
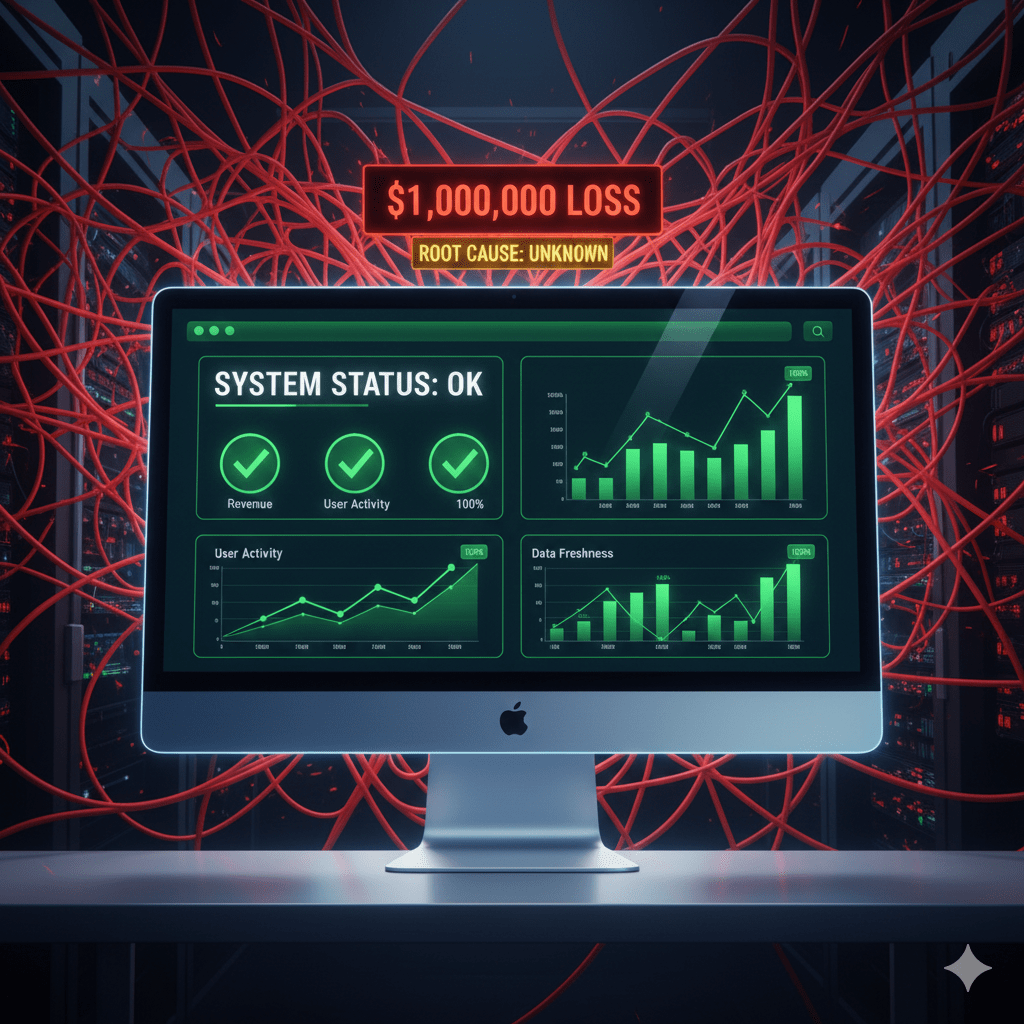
The dashboards were green.
Every test passed.
And yet, by morning, the company’s revenue had mysteriously dropped by roughly $1 million.
The data team huddled together, blinking at their screens.
- Schema checks? It looked good.
- Nulls? Checks passed, and everything appeared to be in order.
- Completeness? It looked good.
Nothing looked wrong, except that something was causing the business to bleed.
What they didn’t know yet was that an innocent iOS app update had quietly scrambled the order of user events.
To the system, customers were suddenly purchasing before browsing.
The models didn’t break in code; they broke in meaning.
The team discovered a crucial lesson: even flawless data systems can mislead without true observability.
Why “Good Data” Isn’t Good Enough Anymore
There was a time when data quality was the gold standard and a measure of success. DQ checks meant your dataset is protected. If your dataset were clean, complete, and validated, your insights would be gold.
But that was back when pipelines were simple, ETL jobs ran once a night, and life was predictable.
Back then, most data was read by people, not systems. Analysts looked at dashboards after the fact, asked questions when numbers felt off, and applied judgment before anyone made a real decision. If a table landed late or a metric looked strange, someone usually noticed; often before it caused real damage. Data quality checks were designed for this world: static, batch-oriented, and tolerant of human interpretation.
But as technology changed, so did expectations. Today’s world is different. This shift matters most for data engineers, analytics engineers, and platform teams responsible for the reliability of downstream dashboards, APIs, and machine learning systems.
Modern cloud-native companies run thousands of interdependent batch and streaming pipelines, constantly feeding dashboards, APIs, and machine learning systems.
A single column rename, a delayed partition, or an unnoticed schema tweak can quietly throw everything off course.
Traditional data quality is like checking your car’s oil once a month.
Data observability involves installing a dashboard that provides real-time alerts when the engine is overheating.
The Shift: From Data Quality to Data Observability
Data quality answers the question:
“Is this dataset correct right now?”
Data observability asks something deeper:
“Is my data behaving as it should?”
|
Aspect |
Data Quality |
Data Observability |
|---|---|---|
|
Focus |
Data-at-rest |
Data-in-motion |
|
Checks |
Accuracy, completeness, validity |
Freshness, volume, distribution, schema, lineage |
|
When |
Point-in-time |
Continuous |
|
Goal |
Ensure correctness |
Ensure reliability |
|
View |
Local |
End-to-end |
The Five Pillars of Data Observability
- Freshness: Is data arriving on time relative to SLAs?
- Volume: Are record counts within expected ranges?
- Distribution: Have key statistics (e.g., averages, percentiles) drifted unexpectedly?
- Schema: Did upstream fields change without notice?
- Lineage: What depends on what, and who owns it?
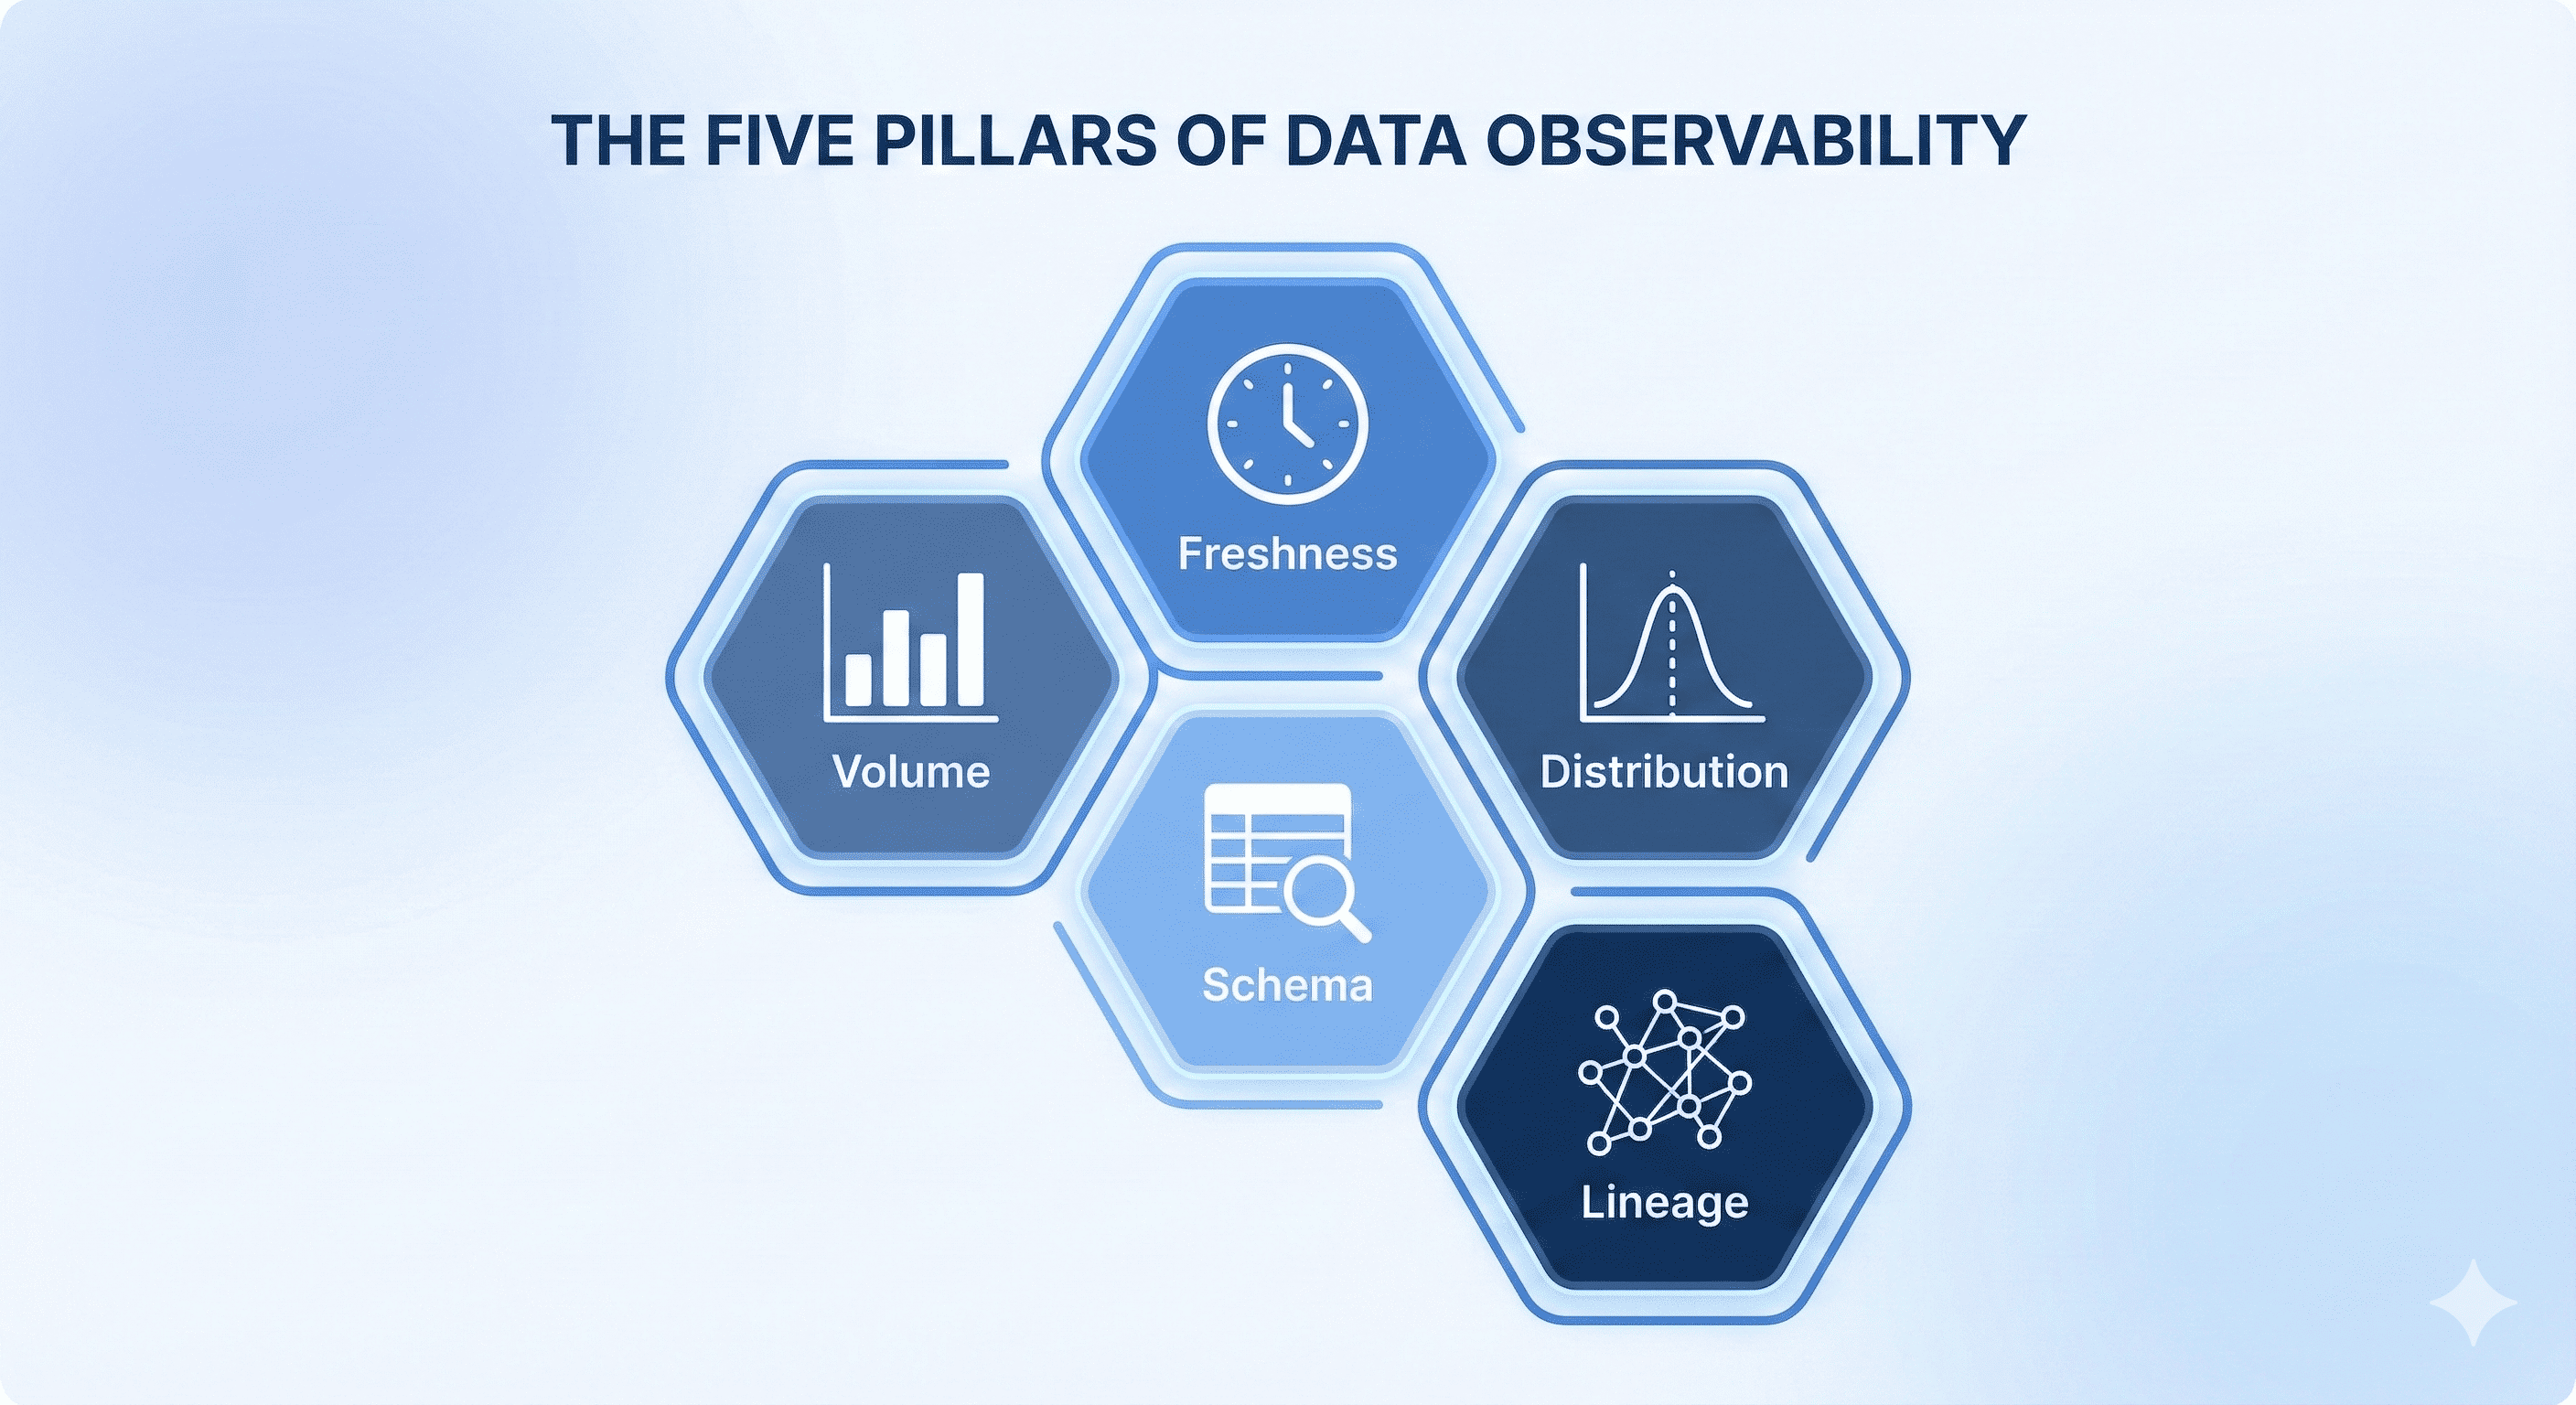
Together, these pillars act as an early-warning system for your data ecosystem, sensing changes before they cause downstream impact.
The Story Behind the $1M Drop
Our e-commerce company’s recommendation engine accounted for 40% of revenue. After a routine app update, click-throughs fell by 15%, conversions by 22%, and revenue tumbled.
And yet, all quality checks still passed.
|
Check |
Status |
Missed Insight |
|---|---|---|
|
Schema |
✅ |
Timestamps changed meaning |
|
Nulls |
✅ |
Events arrived out of sequence |
|
Ranges |
✅ |
Valid values, wrong order |
Data quality confirmed the structure.
It missed the story.
Event order sounds like a minor detail, but for recommendation models, it’s foundational. Browsing before purchasing means something very different than purchasing before browsing. When that sequence flipped, nothing crashed; the model simply learned the wrong story about customers. Since the data remained complete, valid, and schema-compliant, every traditional check passed, even as the model’s understanding of user behavior quietly unraveled.
The Hidden Issue
The iOS app began batching events. They arrived six hours late and out of order.
|
Before (Healthy) |
After (Broken) |
|---|---|
|
View → Add to Cart → Purchase |
Purchase → View → Add to Cart |
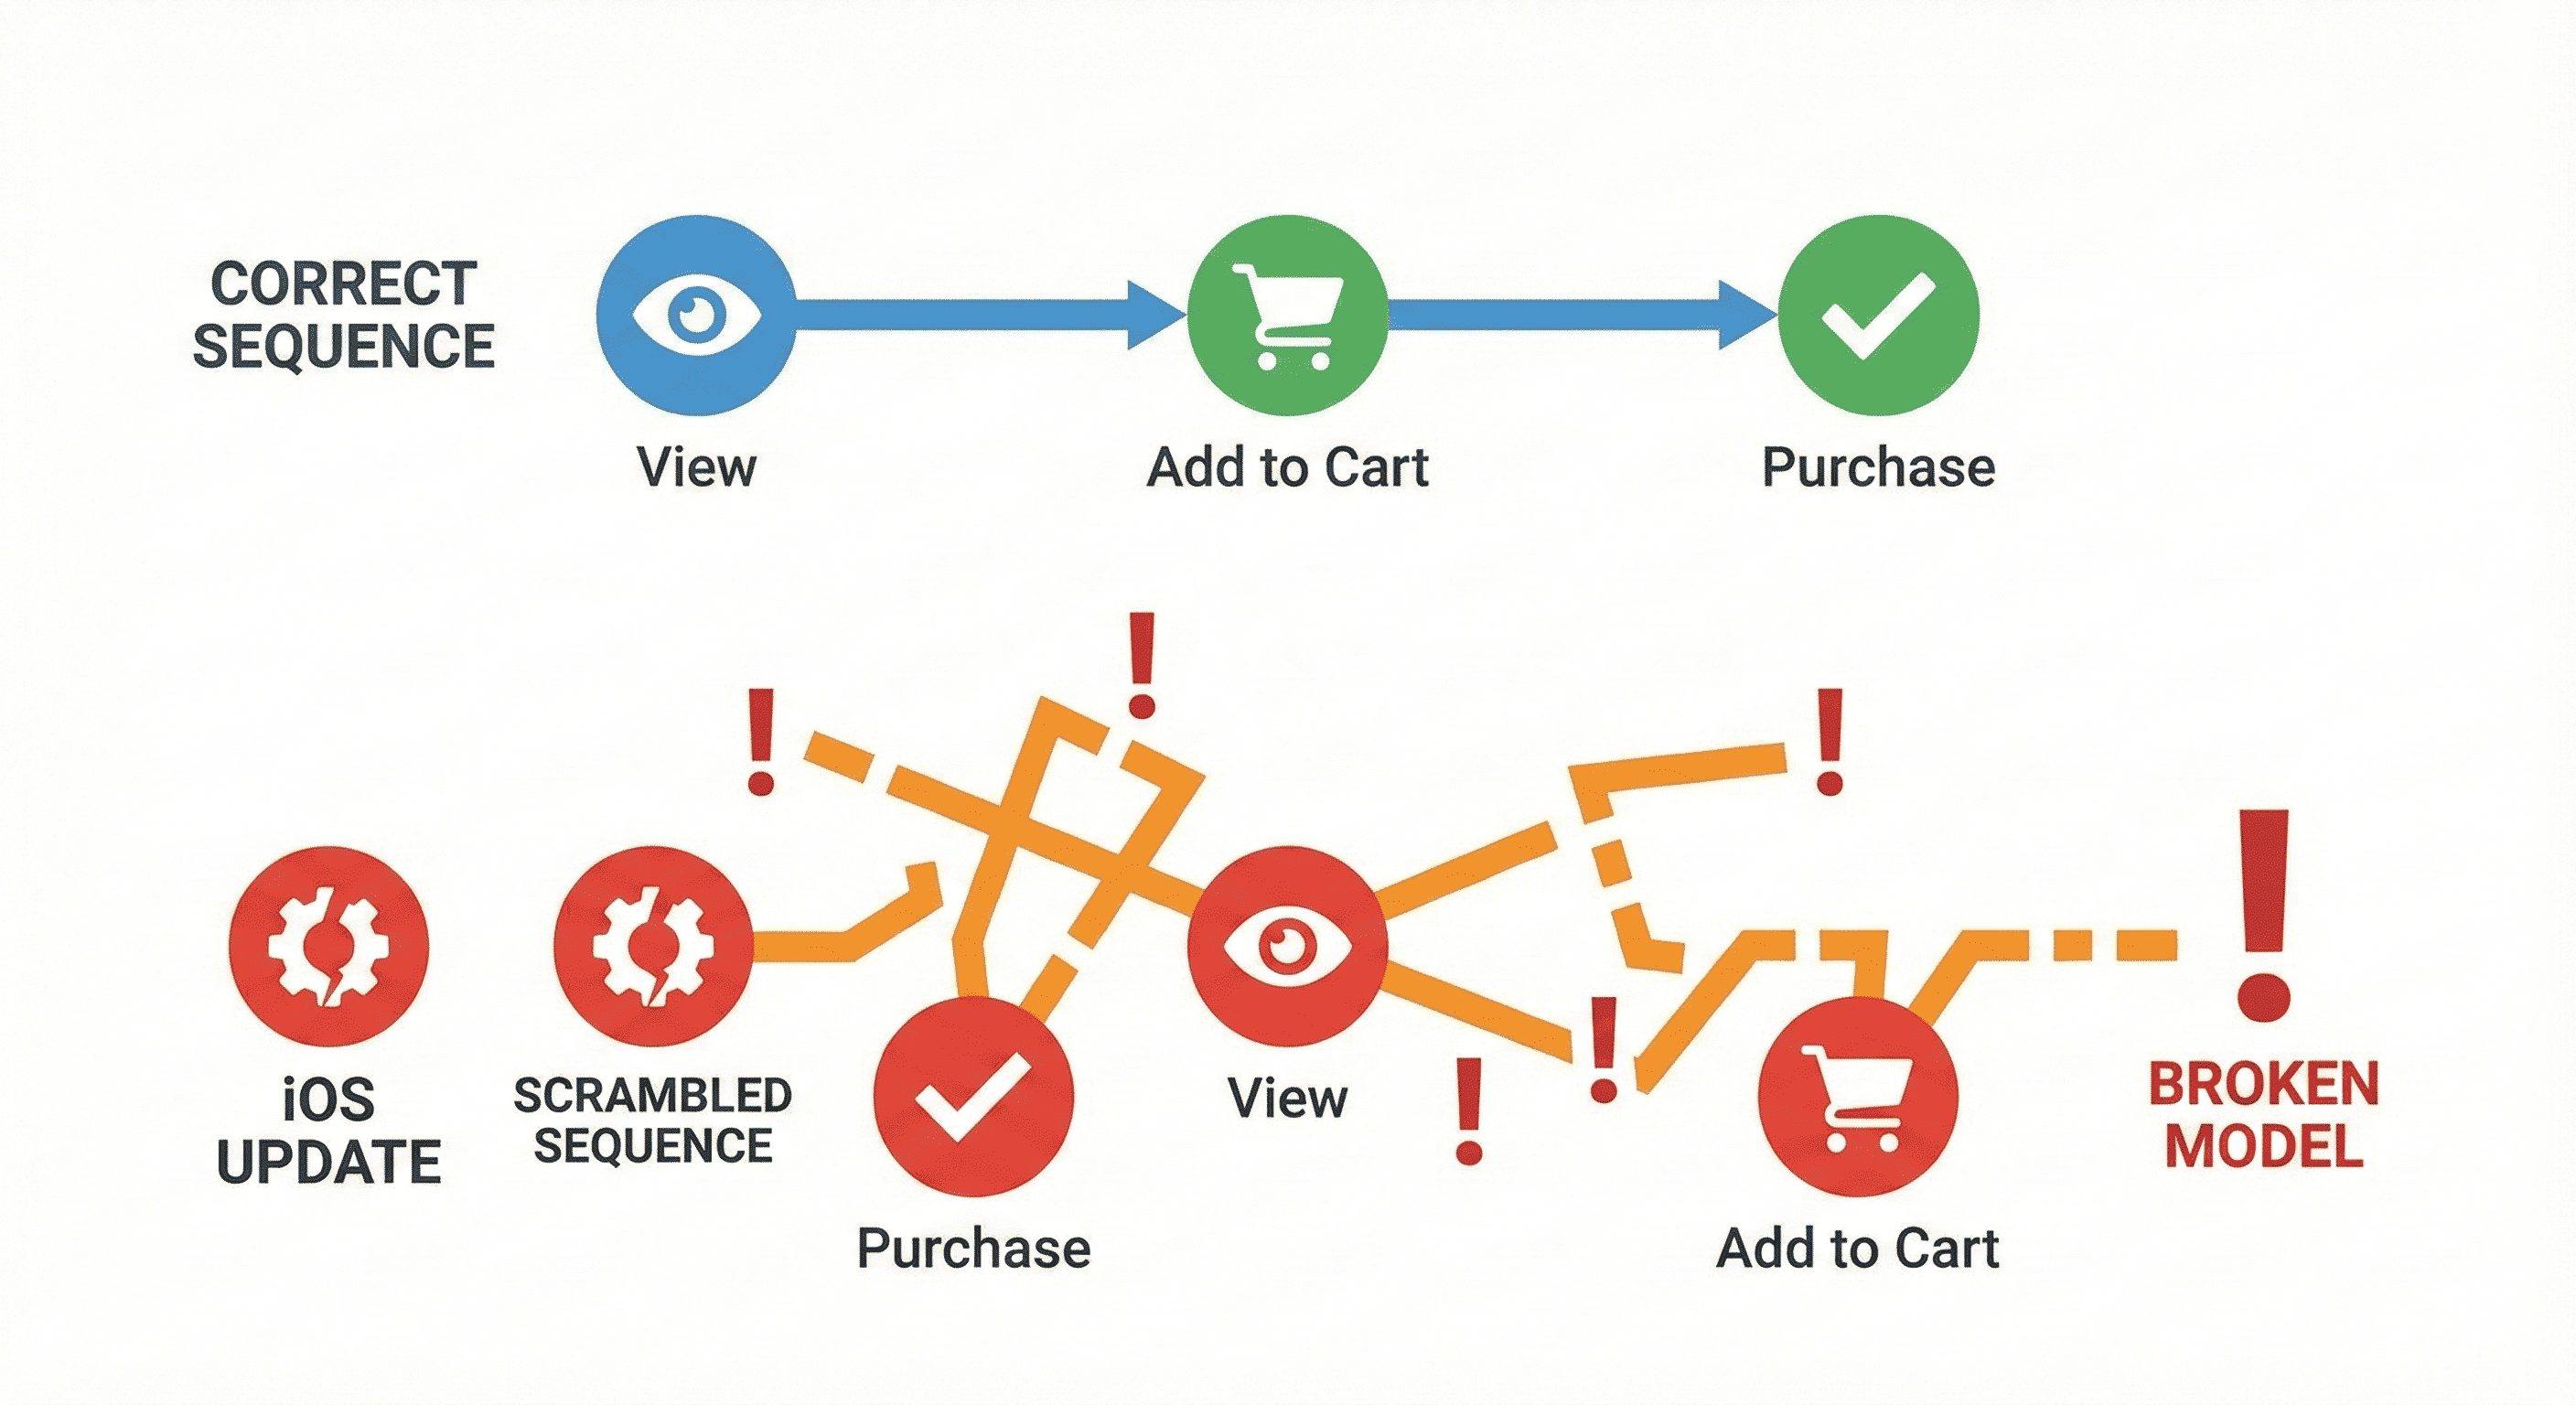
The model interpreted chaos as logic, and that’s when recommendations became noise.
How Observability Would Have Saved the Day
Within two hours, an observability system would have screamed:
- Freshness Alert: Event lag jumped from 5 mins to 360 mins
- Distribution Alert: 78% of events out of sequence
- Lineage Alert: iOS v1.3.0 deployed, impacting 47 tables and degrading 12 ML models
|
Approach |
Detection |
Root Cause |
Resolution Time |
|---|---|---|---|
|
Data Quality |
Missed |
Undetected |
3 days |
|
Data Observability |
Caught early |
iOS v1.3.0 deployment |
6 hours |
Observability didn’t just find the broken data; it connected the dots to the moment things went wrong.
The real win wasn’t just catching the issue faster. It was knowing exactly what changed, when it changed, and how far the damage spread. That made it possible to roll back quickly and explain what happened without guesswork. Without observability, teams debate symptoms. With it, they start acting on causes.
Building Observability Step by Step
So how does a modern data team move from reactive firefighting to proactive confidence?
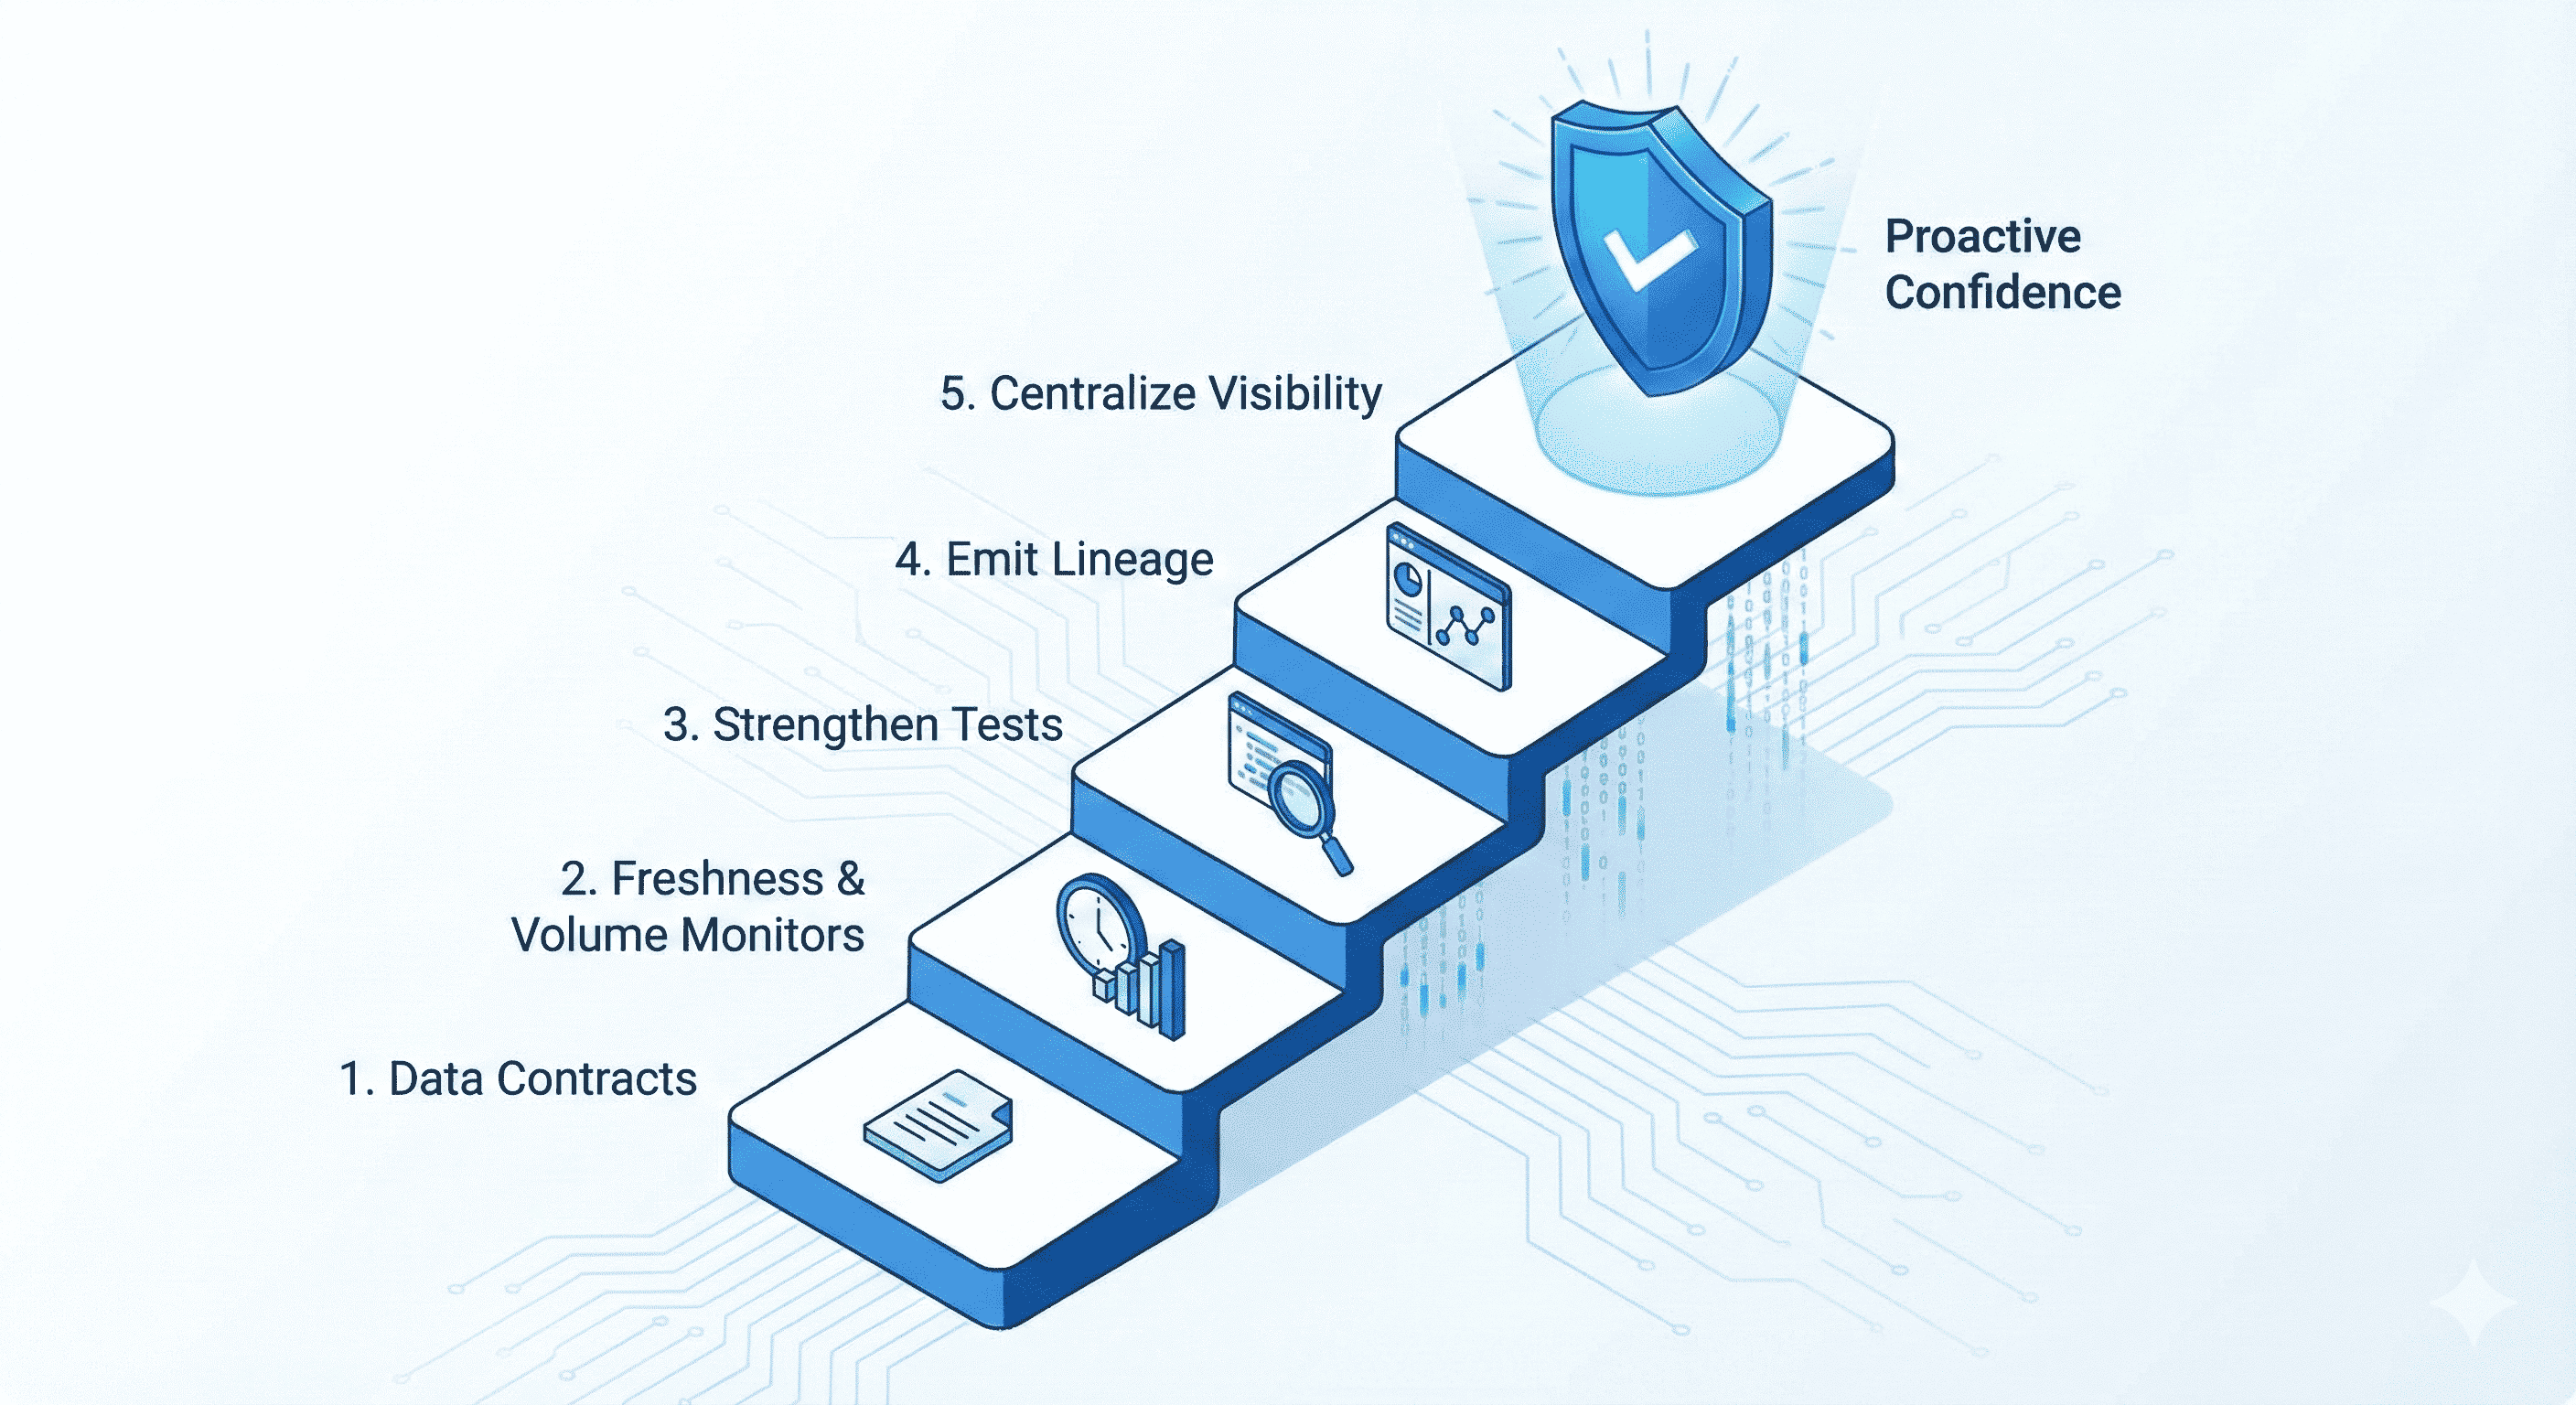
1. Define Data Contracts
Every dataset has a clear, versioned schema (YAML, Avro, Protobuf). Contracts live in code and are automatically validated before pipeline runs and new data is added to the dataset.
Data contracts are often the first thing teams skip. They feel slow, bureaucratic, and unnecessary, right up until a breaking change slips through and every downstream table starts lying.
2. Add Freshness & Volume Monitors
Track how long data takes to arrive and whether counts fall outside norms. Row updated at timestamp should be within the defined SLO. Define SLOs such as “99% of partitions land within 10 minutes.”
Without explicit SLAs, delays are only discovered after dashboards update or don’t. By then, decisions have already been made on stale data.
3. Strengthen Tests
Layer dbt checks for `not_null` and `uniqueness` with drift tests — e.g., “average session_length stays within 10% of baseline,” or “count of new orders placed stays within 10% of the baseline.”
Basic checks are good at catching broken tables, but they don’t tell you when data starts behaving differently. Drift tests exist for the uncomfortable cases where everything looks valid but isn’t.
4. Emit Lineage
Integrate OpenLineage with Airflow or dbt to visualize dependencies and trace impact instantly.
Without lineage, every alert triggers a manual investigation. With it, teams can immediately see blast radius and ownership.
5. Centralize Visibility
Bring all signals into one pane of glass. When freshness lives in one tool, lineage in another, and alerts in Slack, every incident turns into a scavenger hunt. Pulling those signals together is what turns alerts into answers.
Now, when an alert fires, you know what broke, where, and who’s responsible.
A Familiar Pattern
If this story sounds familiar, it’s because it’s happening everywhere.
- Teams at Netflix have described recommendation quality degrading after upstream data schemas changed without downstream safeguards.
- Uber has publicly discussed timezone-related bugs that impacted time-based systems, including pricing and incentives.
- Airbnb has shared incidents where aggressive deduplication and data-cleaning logic removed valid records.
- Stripe has written extensively about how tiny currency-rounding errors can quietly compound into material financial discrepancies at scale.
Let’s Distill the Lesson: Quality Validates. Observability Protects.
Data quality ensures your data is correct.
Data observability ensures your system stays trustworthy.
In today’s interconnected world, where every pipeline is a domino, observability isn’t a luxury; it’s a seatbelt.
So the next time your dashboard shows that comforting little green badge labeled “Fresh & Verified,” remember: behind that glow lies a safety net of observability quietly keeping your business upright.
Opinions expressed by DZone contributors are their own.
Comments