Zipkin vs. Jaeger: Getting Started With Tracing
Learn about Zipkin and Jaeger, how they work to add request tracing to your logging routine, and how to choose which one is the right fit for you.
Join the DZone community and get the full member experience.
Join For FreeRequest tracing is the ultimate insight tool. Request tracing tracks operations inside and across different systems. Practically speaking, this allows engineers to see the how long an operation took in a web server, database, application code, or entirely different systems, all presented along a timeline. Request tracing is especially valuable in distributed systems where a single transaction (such as "create an account") spans multiple systems.
Request tracing complements logs and metrics. A trace tells you when one of your flows is broken or slow along with the latency of each step. However, traces don't explain latency or errors. Logs can explain why. Metrics allow deeper analysis into system faults. Traces are also specific to a single operation, they are not aggregated like logs or metrics. Tracing, logs, and metrics form the ultimate telemetry solution. Teams armed with all three are well equipped to debug and resolve production problems.
Teams start with logging and monitoring, then add tracing when the need arises. This is because there's no drop-in solution. Engineering teams must instrument code, add tracing to infrastructure components such as load balancers, and deploy the tracing system itself. The solution must factor in language and library support, production operations, and community support. This post prepares you for that decision by evaluating Zipkin and Jaeger.
Meet Zipkin and Jaeger
Zipkin and Jaeger are two popular choices for request tracing. Zipkin was originally inspired by Dapper and developed by Twitter. It's now maintained by a dedicated community. Jaeger was originally built and open sourced by Uber. Jaeger is a Cloud Native Computing Foundation project. The overall architecture is similar. Instrumented systems send events/traces to the trace collector. The collector records the data and relation between traces. The tracing system also provides a UI to inspect traces.
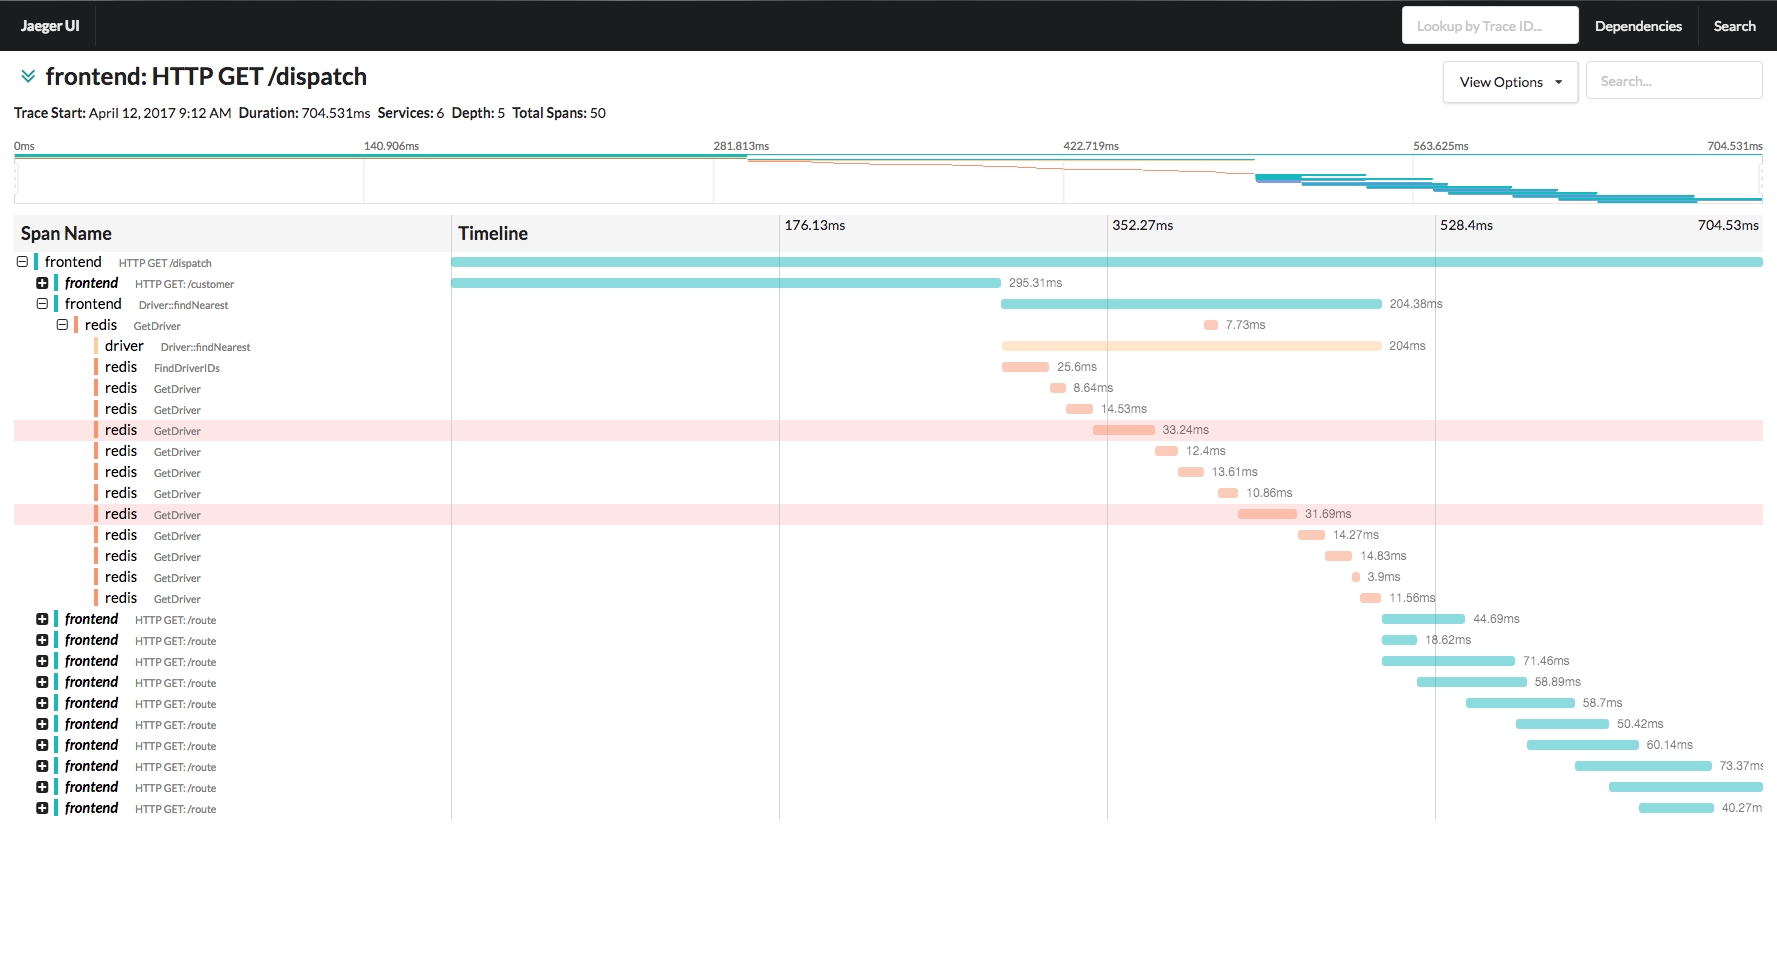
Jaeger
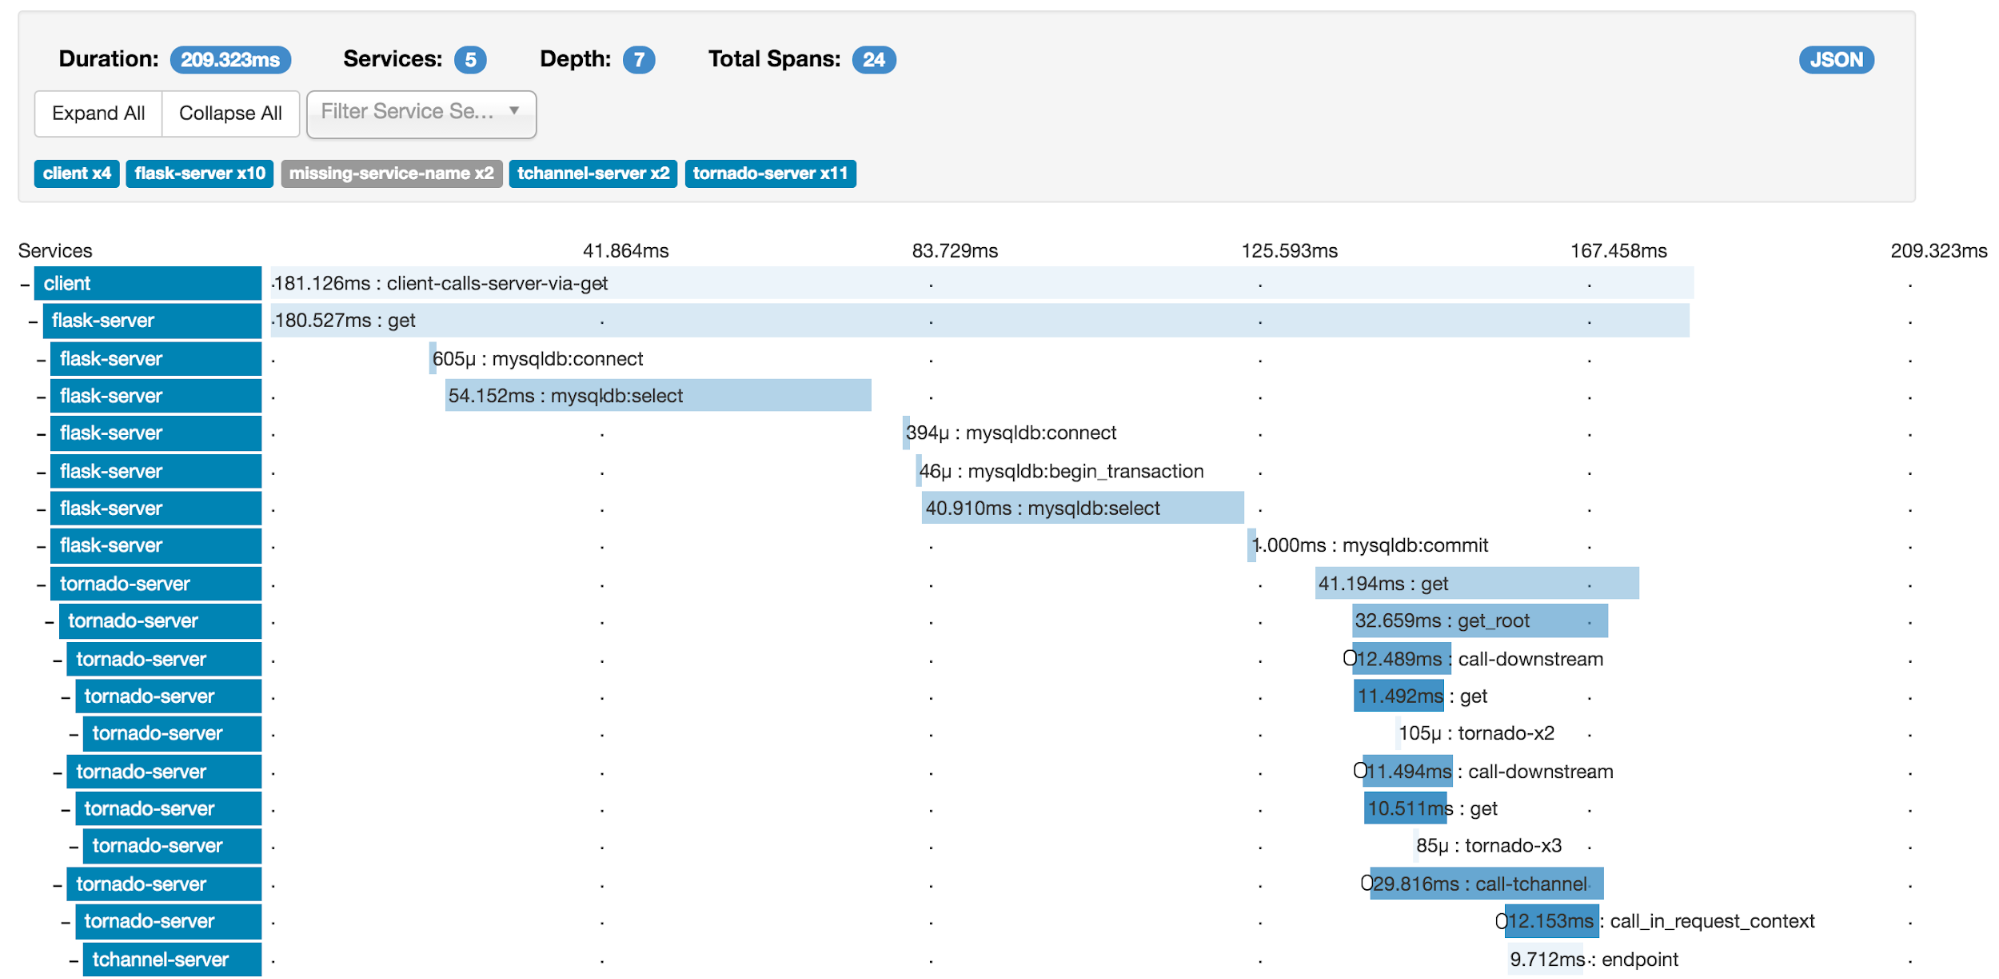
Zipkin
Let's begin with the immediate question: which one supports the languages I use?
Language Support
We'll stick to officially supported clients in this evaluation. Both support common languages, with notable exceptions.
Python, Ruby, and PHP are notable omissions. However, it's not that Zipkin or Jaeger completely lack support. There are unofficial clients but proceed with caution. Pay careful attention to quality and supported features. Jaeger documents their supported features across official clients. Not even the official libraries support 100% of features across the board. The situation is likely worse for unofficial clients. Different clients support different transports and protocols for sending data to the tracing backend. Be sure to factor this into your analysis. The situation is similar for Zipkin. The documentation lists support for the various features. The official clients are better across the board, but the unofficial libraries are worse off.
Client libraries are the gateway. They transmit instrumentation to the collector. However, you don't want to have to instrument everything. Ideally, common frameworks and libraries should be instrumented by the ecosystem.
Framework and Library Integration
Support and approach vary between Zipkin and Jaeger. Zipkin opts to support popular frameworks in the official clients while leaving the community to instrument smaller libraries like database drivers. Jaeger leverages Open Tracing instrumentation libraries so the various opentracing-contrib projects can be used. Both Zipkin and Jaeger support drop implementation for big frameworks like Python's Django, Java's Spring, or Express.js in Node.js. Jaeger gains a slight edge in library instrumentation. The opentracing-contrib project contains instrumentation for some database libraries, gRPC, Thrift, and the AWS SDK in some languages.
Deployment and Operations
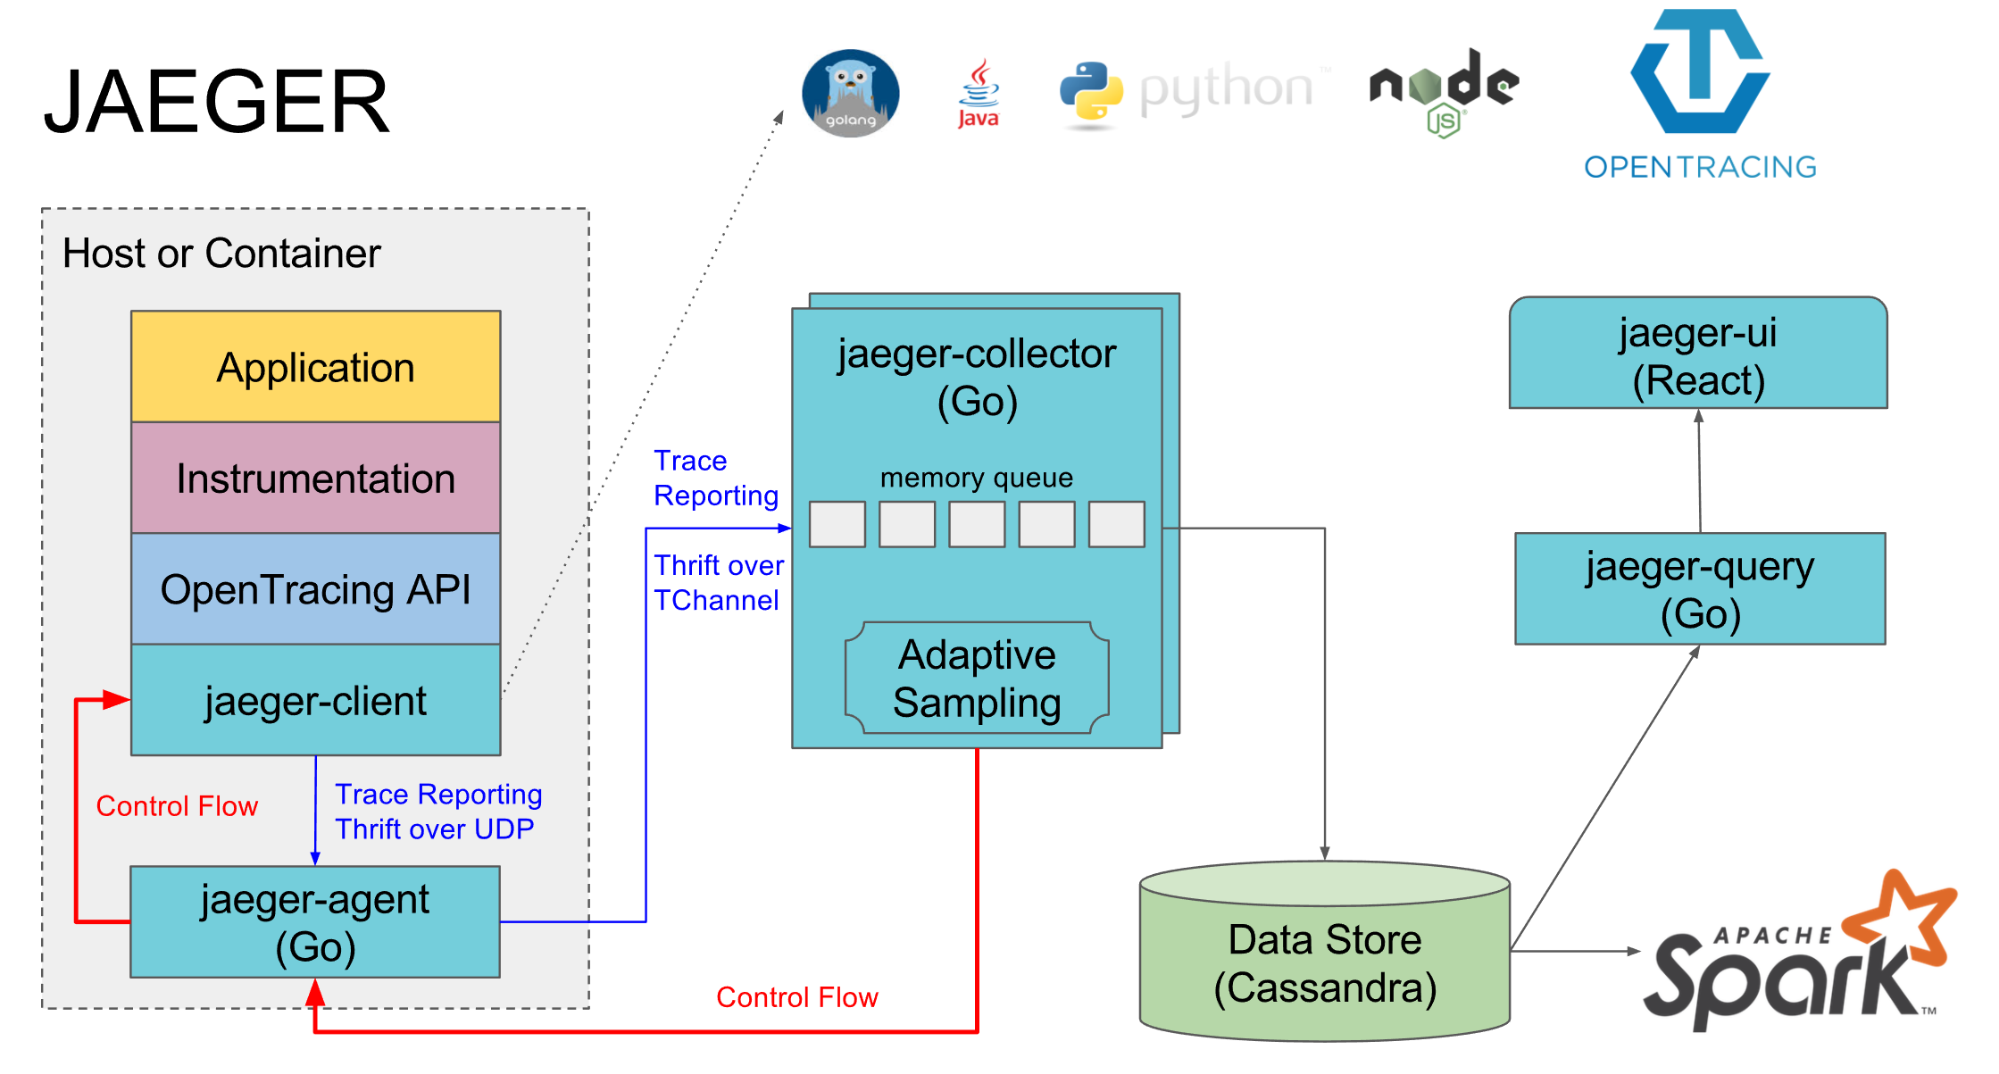 Jaeger architectural diagram.
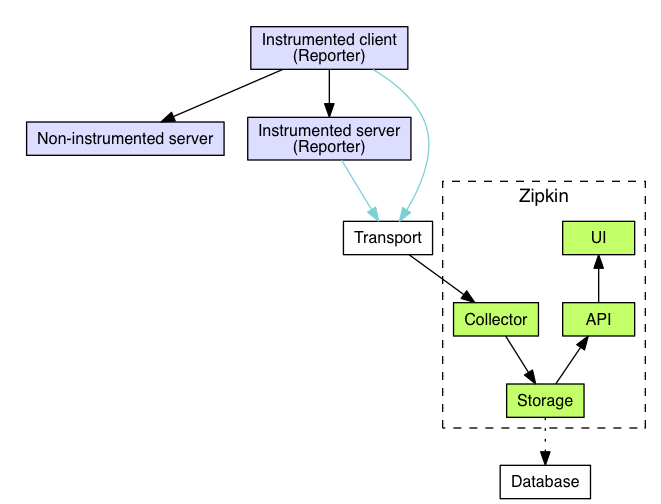
Zipkin architectural diagram.
Both Zipkin and Jaeger have multiple moving pieces. Both instruments trace data to a collector. The collector writes data to a data store. A query system provides an API for the UI component. Both Zipkin and Jaeger support multiple storage backends such as Cassandra or Elasticsearch. They differ in how the components are packaged and deployed.
Jaeger is part of the CNCF, so Kubernetes is the preferred deployment platform. There's an official Kubernetes template and in the incubator that deploy the agent, collector, query API and UI. Leveraging a service proxy like or with Jaeger support makes it even easier to trace calls across containers. It's possible to deploy the agent, collector, query, and UI outside Kubernetes, but that's swimming upstream.
Zipkin provides Docker images and Java programs. Unlike Jaeger, Zipkin is a single process that includes the collector, storage, API, and UI. This makes deployment easier, but the story is less clear. Jaeger has a dedicated deployment documentation section. Zipkin does not. Figuring out how to deploy Zipkin comes down to reading Docker image's readme . But once you're done, you should know how to deploy using any container orchestration system.
Also bear in mind that both are running systems, in fact, Jaeger is a distributed system. That requires monitoring the components and maintaining the data store. Both systems export Prometheus metrics. Maintaining the data store can be offloaded by using a hosted Elasticsearch , which is more accessible than Cassandra. Teams can opt to run the data store themselves but must accept responsibility for maintaining a critical infrastructure component.
Both projects have an active community. Jaeger's first public release was in 2017. Twitter launched Zipkin in 2012. Zipkin's community is larger as seen in the Gitter chat room and Github stars likely due to its age. Assessing the community comes down to asking what kind of community do you want to participate in? Again, Jaeger is part of the CNCF which frames the project as a piece in cloud-native architecture. That means containers, Kubernetes, and other technical preferences - best of all support for Open Tracing and the ecosystem around it. Zipkin is not part of a wider ecosystem, it's an isolated project part of a pre-container world. That's not a bad thing though, it's just different. Ultimately, both sport active communities that foster growth.
Conclusion
Both projects are strong request-tracing solutions. So which one makes the most sense for you? The decision-making begins by considering the official supported languages. Jaeger officially supports most you'll find in production. Next come supported libraries and frameworks. Initially, it seems that Zipkin comes out on top, but Jaeger has far more potential since it works with any open tracing instrumentation library. This aspect of the decision comes down to what your tech stack is, how much is already instrumented by the community, and how much - if at all - you want to instrument yourself. However, there is a point we've not covered yet. Jaeger is also compatible with Zipkin's API, so it's possible to use Zipkin instrumentation libraries with Jaeger's collector.
Deployment is the other facet. This comes down to the pre-existing infrastructure. If Kubernetes is running in production, then adopt Jaeger. If there's no existing container infrastructure than Zipkin, it makes for a better fit because there are fewer moving pieces. Also, consider a self-hosted solution for the data layer. Unfortunately, there's no complete hosted Jaeger or Zipkin solutions, so accept the responsibility that comes with understanding and operating new production systems.
Here's a simple recommendation. Evaluate Jaeger first and see how it fits into your existing solution. If Jaeger doesn't fit, then go with Zipkin.
Published at DZone with permission of Daniel Berman. See the original article here.
Opinions expressed by DZone contributors are their own.
Comments