DZone
Thanks for visiting DZone today,
Edit Profile
  • Manage Email Subscriptions
  • How to Post to DZone
  • Article Submission Guidelines
Sign Out View Profile
  • Post an Article
  • Manage My Drafts
Newsletter
Log In / Join
Refcards Trend Reports
Events Video Library
Refcards
Trend Reports

Events

View Events Video Library
  1. DZone
  2. Refcards
  3. AI-Native Observability Patterns and Anti-Patterns
refcard cover
Refcard #406

AI-Native Observability Patterns and Anti-Patterns

AI-native observability requires teams to make both production systems and AI-driven workflows explainable through connected, verifiable telemetry. This Refcard explores patterns for preserving trace context, standardizing telemetry with OpenTelemetry, grounding AI-assisted investigations in evidence, and instrumenting agentic workflows end to end. You’ll also learn how common anti-patterns — including aggressive sampling, semantic noise, unsupported AI summaries, and unobservable agent execution — can weaken incident analysis and make automated findings harder to trust.

Free PDF for Easy Reference

Brought to You By

groundcover
refcard cover

Written By

author avatar Naga Santhosh Reddy Vootukuri
Principal Software Engineer, Microsoft
Table of Contents
► Introduction ► AI-Native Observability as a Two-Way System ► Core Patterns for AI-Native Observability ► Common Anti-Patterns in AI-Native Observability ► Putting the Patterns Together ► Conclusion
Section 1

Introduction

AI-native observability goes beyond alert summaries or chatbot-driven dashboards. It changes what telemetry should explain, how systems generate operational data, and how engineering teams determine whether an automated finding is reliable and trustworthy. The two operational concerns intersect in modern architectures:

  • Using AI to investigate production systems
  • Observing applications built with foundation models, tools, and agents

Both depend on connected telemetry signals, preserved execution context across network boundaries, clear system ownership, and evidence that engineers can independently inspect and verify. This Refcard presents the patterns that establish that foundation and the anti-patterns that weaken it.

Section 2

AI-Native Observability as a Two-Way System

AI changes enterprise observability in two interdependent directions. On one side, an AI assistant can investigate production systems by retrieving telemetry, correlating signals across services, comparing recent code or infrastructure changes, and proposing explanations for incidents. On the other side, the AI application itself acts as the system under test, where it exposes model calls, retrieval steps, tool executions, retry loops, safety policy evaluations, and downstream effects.

Both sides require context propagation, structured telemetry, cross-signal correlation, and traceable evidence. Inconsistent service names, environment tags, deployment metadata, or sampling policies can make AI-assisted findings unreliable, even when the generated explanation sounds polished. OpenTelemetry provides a vendor-neutral foundation for this design, while AI-specific conventions still require careful versioning and local governance.

Section 3

Core Patterns for AI-Native Observability

The following patterns establish the telemetry structure, evidence model, and workflow visibility needed for AI-native observability.

Core AI-Native Observability Patterns, Use Cases, and Failure Modes

Pattern When to Use Failure Modes
Context-rich, trace-continuous telemetry A request crosses services, queues, infrastructure, models, tools, or workflow boundaries Broken timelines, orphaned agent steps, and causal gaps after sampling or asynchronous work
OpenTelemetry-aligned semantic context Multiple teams and runtimes produce signals queried by humans and AI systems Inconsistent service identities, brittle joins, high-cardinality noise, and unreliable comparisons
Evidence-backed investigation AI explains an alert, regression, or unusual workflow outcome Unsupported causal claims, hidden access gaps, and unreproducible summaries
Observable agent workflow An application uses models, retrieval, tools, agents, policies, evaluations, or feedback Hidden loops, unclear latency, silent fallbacks, poor retrieval, and uncertain ownership


Context-Rich, Trace-Continuous Telemetry

Engineering teams need to preserve the execution path of a request or workflow from its entry point to its downstream effect. That path may cross HTTP/gRPC requests, service-to-service hops, queues, database queries, infrastructure transitions, background jobs, model calls, retrieval operations, tool executions, delegated agents, and downstream APIs. Trace continuity depends on standardized trace and span identifiers, parent-child relationships, span links for asynchronous or fan-out operations, and durable workflow identifiers for long-running, multi-step processes that cannot fit cleanly into a single trace.

Detailed Attribute Tracking

Telemetry records should capture the operational details needed to explain why system state changed:

  • Identity and topology: service boundary, operation name, resource identity, deployment version, cloud region, and runtime environment
  • Execution state: HTTP/gRPC status codes, error classifications, retry counters, and execution durations
  • Cross-signal links: trace IDs and span IDs in logs, and metric exemplars where available
  • Change correlation: code deployments, feature flags, and configuration changes by service, version, environment, and timestamp

Data Sensitivity and High Cardinality

Rich context does not mean storing every raw payload in operational telemetry. Prompts, retrieved vector chunks, user content, API secrets, and raw identifiers can be both security-sensitive and high-cardinality. Routine span attributes should omit raw payloads. When approved payload content is required for debugging or compliance, store it in a separate encrypted system governed by RBAC and embed only a stable, non-sensitive reference key in the telemetry span.

Outcome-Aware Sampling Strategy

Sampling is part of telemetry architecture. Head sampling is efficient but decides before the request outcome is known, while tail sampling can retain errors, slow traces, rare routes, and agent loops using the completed trace. Whichever approach is used, measure drop rates and verify trace continuity across services. A missing span is missing operational evidence.

Measuring Telemetry Completeness

Telemetry completeness should be treated as an operational quality signal. Monitor orphaned spans, broken links, unknown deployment versions, and logs without trace context. Run synthetic workflows across APIs, queues, collectors, and storage backends to verify that enough context is preserved to reconstruct a failure before a real incident occurs.

Reduced trace context:

Shell
 
POST /checkout [2.1 s, ERROR]
└── inventory call [ERROR]


Context-rich telemetry:

Shell
 
Workflow ID (application-defined): wf-783

Path:
gateway v42 → checkout v118 → queue handoff ⇢ linked inventory consumer v73

Deployment:
inventory-v73 deployed four minutes before the failure

Failure details:
inventory span: 940 ms
retry attempt: 2 of 3
exception: InventoryTimeoutException

Runtime context:
region: us-west-2
runtime: .NET 9
correlated logs: linked through trace and span IDs
metric exemplar: linked to the trace

Retention:
Tail-sampling policy retained the trace because it contained an error and occurred within the deployment observation window.


Why it matters: The reduced trace confirms the request failed. The context-rich trace preserves the version, dependency, timing, retry, and infrastructure details needed to investigate the failure without storing sensitive payloads.

OpenTelemetry-Aligned Semantic Context

Semantic context makes telemetry joinable across systems without requiring responders or AI tools to learn producer-specific field names. Teams should propagate trace context across service boundaries using standardized header formats (e.g., W3C Trace Context) and restrict baggage propagation to trusted network boundaries with explicit allowlists.

Layering Resource vs. Span Attributes

OpenTelemetry resource attributes and span-level attributes serve different purposes:

  • Resource metadata: stable facts such as service name, service version, deployment environment, cloud region, container ID, and runtime version
  • Span and record context: operation-specific facts such as query parameters, status codes, execution durations, and error types

Navigating Evolving Semantic Standards

OpenTelemetry APIs, SDKs, instrumentation libraries, and Collector pipelines provide interoperable building blocks, but they do not guarantee that telemetry contains actionable meaning. Semantic conventions establish shared field names for common domains like HTTP, databases, and RPCs. Core tracing APIs, context propagation standards, log correlation models, and common service resource attributes provide stable contracts. AI-specific telemetry conventions may require versioned mappings, documented local extensions, and migration paths as field names mature.

Collectors as Telemetry Control Points

OpenTelemetry Collectors serve as control points within the telemetry lifecycle:

  • Metadata enrichment: add infrastructure metadata such as Kubernetes pod tags or cloud instance details
  • Security and compliance: redact restricted fields, scrub sensitive attributes, and sanitize raw payloads
  • Normalization and routing: normalize approved field aliases, route signals to storage backends, and apply tail-sampling policies

Collectors should not invent domain business meaning. The service or library creating a span owns span boundaries, status codes, and domain attributes.

Schema Registries and Governance

Generic names like “request,” “call,” or “step” hide ownership and intent, while missing version attributes make deployment comparisons difficult. Define a shared telemetry schema with consistent names, required attributes, cardinality limits, and privacy classifications. The schema registry should map operational questions to the fields needed to answer them and identify each field’s owner, source, allowed values, and stability. This allows teams to add domain context without creating incompatible aliases.

Evidence-Backed Investigation

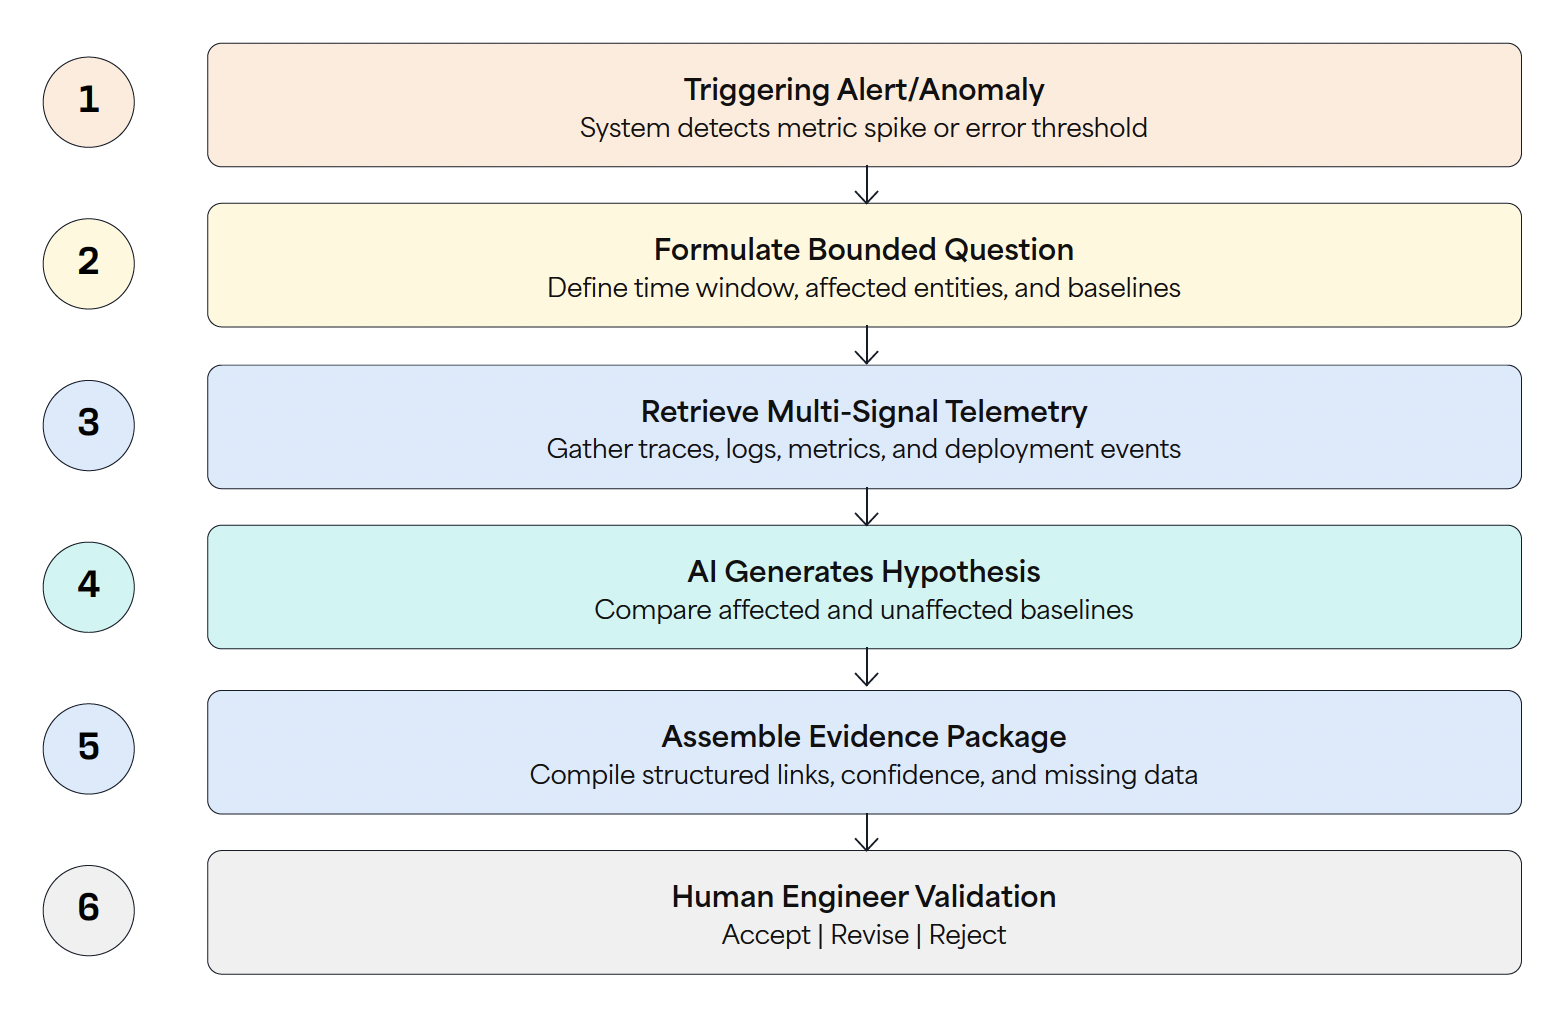
An automated incident investigation begins with a bounded operational question, such as: “Which specific change explains the checkout latency increase observed after 14:05 UTC?” An alert is the starting point, not a root-cause diagnosis. The investigation should define the time window, affected system entities, expected baseline, and candidate comparisons. From there, it retrieves the triggering metric window, representative traces, correlated log streams, deployment and configuration change events, dependency health status, and recent error distribution patterns.
AI-Assisted Incident Investigation

Isolating Causal Factors

Signal correlation narrows potential causes, but confirming causality requires several checks:

  • Compare affected and unaffected regions, service versions, API routes, tenants, tool definitions, or model configurations
  • Trace span relationships and links to find where latency or errors begin
  • Group traces by deployment, dependency anomaly, error signature, or agent step
  • Compare current signals against historical baselines to separate regressions from recurring load patterns

Formulating Hypotheses and Quantifying Uncertainty

When an AI assistant proposes a finding — such as “Version 2026.08.28.3 likely increased inventory call latency” — the claim remains a hypothesis until verified. The finding must explicitly point to trace records showing the inventory span expanding from 80 ms to 940 ms, the deployment event recorded four minutes prior to the shift, and the metric window covering 14:05 to 14:20 UTC. The metric window must show that p99 latency increased for v73 while v72 remained at its previous baseline. The finding also needs a confidence score and uncertainty notes, such as a small post-deployment sample size or incomplete trace collection from a specific region.

Surface Missing Evidence and Falsification Queries

An automated investigation needs to document missing evidence, such as uncollected database query execution plans, sampled-out successful requests, or unconfirmed traffic routing changes. It also requires falsification queries that test the hypothesis, such as comparing old and new service versions in the same region and request class or evaluating upstream dependency saturation prior to the deployment timestamp.

Human-in-the-Loop Validation

Human engineers close the investigation by reviewing the cited records and accepting, revising, or rejecting the AI finding. The system records reviewer identity, rationale, and resulting operational action. When automated remediation platforms can roll back a deployment or isolate a failing dependency, they need strict policy checks, remediation scope previews, explicit authorization, and links back to the evidence package. Investigation systems also surface factors that can alter the incident timeline, such as clock drift, telemetry ingestion delays, query truncation, and permission failures.

Compact evidence package returned with an AI-assisted finding:

JSON
 
{
  "hypothesis": "The inventory deployment (v73) increased checkout latency via connection pool exhaustion.",
  "confidence": 0.74,
  "evidence": [
    "trace:4bf92f10a7b... (inventory span expanded from 80ms to 940ms)",
    "deploy:inventory-v73 (applied 4 minutes prior to latency shift)",
    "metric-window:14:05-14:20 UTC (p99 latency shifted exclusively on v73)"
  ],
  "uncertainty": [
    "Small post-deployment request sample size (<150 requests)",
    "Region us-east-1 exhibits incomplete trace collection continuity"
  ],
  "missing_evidence": [
    "Database query execution plans",
    "Sampled-out successful request baseline"
  ],
  "next_queries": [
    "Compare db.wait_time between v72 and v73 in us-west-2 across identical request classes",
    "Verify whether dependency saturation occurred prior to the 14:01 UTC deployment"
  ],
  "validation": {
    "state": "pending",
    "reviewer": null,
    "rationale": null
  }
}


Observable Agent Workflow

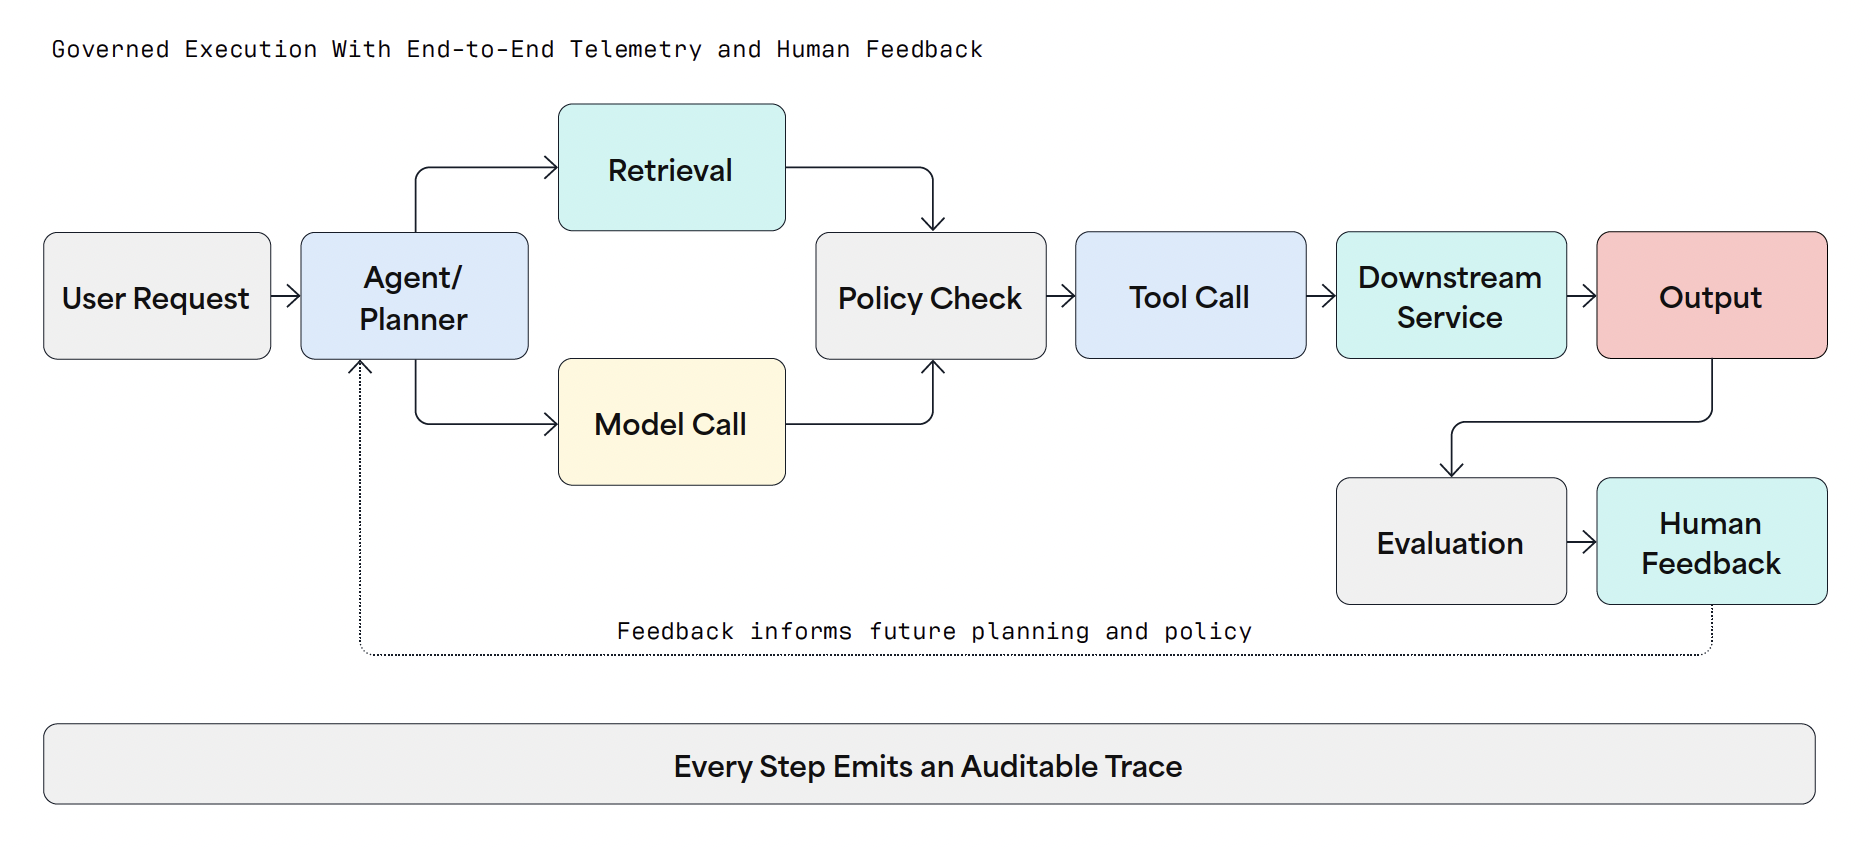
An agent trace represents a dynamic decision-making process, not merely a static HTTP request-response transaction. Instrumentation captures the workflow entry point, agent and policy versions, model calls, vector retrieval operations, tool invocations, sub-agent delegations, downstream service spans, retry attempts, and terminal outcome. Parent-child span relationships work for direct execution steps, and span links connect work that is scheduled, shared across queues, or resumed asynchronously. A durable workflow identifier preserves long-running context across trace boundaries.

Detailed Span Instrumentation for Agent Operations

Different operational boundaries within an agent workflow require specialized telemetry attributes:

  • Model-call spans: model role, endpoint class, response status, execution latency, and bounded usage measurements (e.g., prompt tokens, completion tokens, cost)
  • Retrieval spans: corpus or index version, query transformation stage, result count, applied filters, retrieval latency, and relevance scores where available
  • Tool spans: tool identity, sanitized argument schemas, authorization decisions, execution status, retry reasons, and explicit span links to downstream service traces

Never place raw secrets, unrestricted prompts, retrieved documents, or sensitive model outputs into routine span attributes.

Isolating Specific Failure Classes

Granular internal boundaries help engineers distinguish specific failure modes:

  • Inference latency vs. system stalls: Long model spans indicate inference bottlenecks, whereas long gaps between spans point to application overhead.
  • Grounding and retrieval issues: A successful model call followed by an empty vector retrieval result indicates grounding failures or index misconfiguration.
  • Policy and tool mismatches: Repeated tool execution denials reveal authorization, schema, or permission mismatches.
  • Infinite loops: Duplicate tool invocations with identical parameters indicate agent reasoning loops.
  • Dependency failures: Downstream service spans pinpoint the external service responsible for a workflow failure.

Failed tool attempts and model retries remain separate spans; a successful fallback does not overwrite or erase the primary failure trace.

Execution Limits and Evaluation Telemetry

Telemetry must track execution guardrails as first-class operational metrics:

  • Execution budgets: remaining tool calls, elapsed time, token allocation, cost budgets, recursion depth, cancellation signals, and the rule that terminated the run
  • Evaluation frameworks: automated evaluation results and human feedback linked to the exact workflow trace and output content, with evaluator version, rubric, score, pass/fail threshold, and evaluation source (e.g., deterministic code check, model-based grader, human review)

Queryable System Ownership and Independent Versioning

Agent telemetry needs queryable ownership. Resource metadata can identify the responsible engineering team and the safety policy controlling consequential agent actions. Operational dashboards and alerts should lead responders to trace records and evaluation evidence for latency, tool failures, retrieval quality, retry counts, loop termination events, evaluation drift, and execution outcomes by agent version.

Prompt templates, retrieval strategies, tool definitions, routing policies, model versions, and agent execution graphs must be versioned independently. Updating a model version alone cannot explain an operational change when the surrounding application workflow or prompt text has also changed. Recording these as low-cardinality span attributes supports operational comparison, rollback analysis, and clear ownership without storing sensitive content.
Observable Agent Workflow

Section 4

Common Anti-Patterns in AI-Native Observability

The following anti-patterns weaken the telemetry context, semantic consistency, evidence model, and workflow visibility that AI-native observability depends on.

Sampling Away the Root Cause

Uniform head sampling at ingress gateways can discard the traces needed to diagnose production outages. A 1% sampling decision made at the edge cannot predict whether a request will later time out in a database, enter an agent retry loop, or fail exclusively on a newly deployed service version. Keeping 100% of error logs does not reconstruct the missing causal path. Log streams alone lack predecessor spans, asynchronous queue links, and version transition context that make the error actionable.

Outcome-Aware Sampling and Retention

Systems must combine context-rich telemetry with outcome-aware sampling and retention rules:

  • Predictable baselines: Deterministic head sampling maintains a lightweight, statistically predictable baseline of healthy traffic.
  • Tail-sampling policies: Collector-level tail sampling retains errors, latency outliers, rare operations, failing agent workflows, and traffic near deployment windows.
  • Coordinated retention: Trace, log, and metric exemplar retention rules align across storage tiers, with accepted, dropped, late, and evicted traces measured by sampling policy, service, and collector tier.

Sampling Impact on AI Investigation Validity

Sampling policies alter the statistical validity of AI findings. If an AI assistant reports that a specific database appeared in 82% of failed traces, it needs to display the matching spans, numerator, denominator, evaluation window, and active sampling policy. The system must also surface potential selection bias, especially when failed traces are retained at a higher rate than successful baselines. Dropped traces and uninstrumented service boundaries belong in the missing evidence list.

Engineers can validate AI findings against unsampled metric counters and collector loss reports before scaling infrastructure or reassigning ownership. Teams can temporarily increase trace retention around deployments, configuration updates, model version changes, and policy rollouts. These rules should be time-boxed and logged so pre- and post-change telemetry remains available when an alert fires.

Semantic Noise at Scale

Telemetry environments can grow massive while offering little actionable operational context. Generic attributes like operation, action, or type often carry conflicting definitions across services. High-cardinality telemetry makes the problem worse. Placing rapidly changing request data on OpenTelemetry Resources or creating spans for every internal library call can make aggregation queries unstable. Customer IDs, raw prompt fragments, full URLs, and unparsed exception messages also drive up telemetry storage volume without improving investigation quality. Missing service versions, environment tags, status codes, or dependency identifiers prevent basic operational comparisons.

Implement Governed Semantic Context

OpenTelemetry-aligned semantic context works best when supplemented by governed local extensions:

  • Canonical definitions: attribute names, data types, units, allowed values, cardinality limits, privacy classifications, and team ownership
  • Resource vs. record separation: stable entity metadata on Resources and event-specific context on span records
  • Schema governance in CI/CD: golden trace tests, mandatory fields, payload redaction, and attribute limits during build and collector processing
  • Operational monitoring: schema violations, unknown attribute keys, conflicting aliases, dropped attributes, and cardinality growth as system metrics

Avoid Blind Field Normalization

Similar attribute names across different SDKs may represent different operational concepts, while a single business concept may also require deliberate translation across runtime languages or service boundaries. Automated enrichment pipelines must log their data source and preserve producer-emitted values. Weak span names usually point to unclear application boundaries and should be fixed at the source rather than hidden with decorative tags.

When an AI assistant suggests that two error clusters are equivalent, treat the claim as a hypothesis. Cite schemas, example records, value distributions, and correlation results. State uncertainty where field definitions are ambiguous and have the instrumentation owner validate schema mappings before dashboards, alerts, or retention policies change.

Unsupported AI Summaries Disguised as Investigation

A fluent incident narrative generated by an LLM can easily conceal an empty or flawed investigation. Common symptoms include uncited percentages, causal assertions based purely on timing, dashboard links that fail to reproduce the original incident view, and diagnoses generated from alert payload text alone. The summary may also ignore conflicting evidence from another region, sampled-out traffic, simultaneous configuration changes, or missing deployment logs.

Evidence-Backed Investigation Requirements

Every AI-generated finding must be labeled as a hypothesis and accompanied by an evidence package that includes:

  • Traceable sources: source links or immutable record identifiers for relevant spans, log records, and metric windows
  • Reproducible queries: query text, filter parameters, execution timestamps, and source system identities
  • Change context: correlated deployments, configuration changes, dependency observations, and historical incident comparisons
  • Uncertainty and contradictions: confidence, uncertainty, contradictory telemetry, missing evidence, and data freshness timestamps

Calculated data, retrieved facts, and qualitative interpretations need to remain distinct.

Evidence Preservation and Immutable References

Evidence packages are useful only when they can be inspected after the incident. Telemetry platforms can snapshot or reference immutable query results according to corporate data retention policies, recording source version, query execution timestamp, and access limitations. A dynamic dashboard link is insufficient when the time window or underlying data can change. Sensitive evidence can be preserved through secure reference keys and authorized access roles. Automated systems must never fabricate citations to satisfy a template structure.

Human Validation Workflows

AI findings need an explicit human validation state (e.g., pending, accepted, revised, rejected), along with reviewer identity and rationale. High-impact actions, such as automated rollback or traffic shedding, remain blocked while validation is pending unless a preapproved safety policy defines a narrow containment action. The AI system can recommend queries that test alternative hypotheses, not only evidence that supports the preferred explanation. Rejected hypotheses must be preserved so future investigations do not repeat the same incorrect diagnosis without evaluating contradictory evidence.

Unobservable Agentic Systems

An autonomous agent can return an apparently correct answer while masking inefficient, expensive, or unsafe execution paths. Wrapping an entire agent execution in a single outer span conceals repeated model calls, irrelevant retrieval, denied tool calls, silent fallbacks, recursive delegation, and downstream side effects. Aggregate token counts and total latency fail to show which internal step consumed the execution budget or which service owned a failed dependency. Logging only input prompts and final outputs introduces security risk without explaining control flow.

Granular Boundary Instrumentation

Agent observability depends on explicit boundaries for model invocations, retrieval operations, tool calls, agent state transitions, and downstream service calls. Each boundary needs relationships, version tags, status codes, retry counters, execution budgets, and safety policy decisions. Offline evaluation metrics and human feedback connect back to the exact run ID. Sensitive prompt content belongs in governed repositories behind reference keys and access controls. Durable workflow identifiers preserve context across messaging queues, delegated sub-agents, long pauses, and multi-trace executions.

Automated Assessments as Hypotheses

Automated assessments of agent runs remain hypotheses. An assertion such as “Poor vector retrieval quality caused the unsupported model answer” needs cited retrieval spans, vector corpus versions, sanitized result references, relevance scores, model and policy versions, and tool execution outcomes. The assessment also requires confidence, alternative explanations, evaluator quality uncertainty, and missing evidence like uncollected documents or redacted prompt text. A human reviewer validates the cited records before remediation actions or safety conclusions are finalized.

Real-Time Limits and Quality Signals

Agent telemetry captures remaining call quotas, execution time limits, token consumption, cost budget burn, loop detection alerts, cancellation signals, authorization checks, and the rule that ended the execution. Record attempted operations and final fallback outcomes separately so a successful fallback does not hide a primary service failure. Replay representative failure traces against synthetic tests to verify that retries, denials, fallbacks, and side effects remain fully attributable.

Traditional operational metrics may remain green when the outer HTTP gateway request succeeds. Agent observability also requires monitoring domain quality signals, such as:

  • Groundedness and hallucination scores
  • Tool completion vs. authorization denial rates
  • Safety policy enforcement
  • User output correction frequency
  • Abandoned or timed-out workflows
Section 5

Putting the Patterns Together

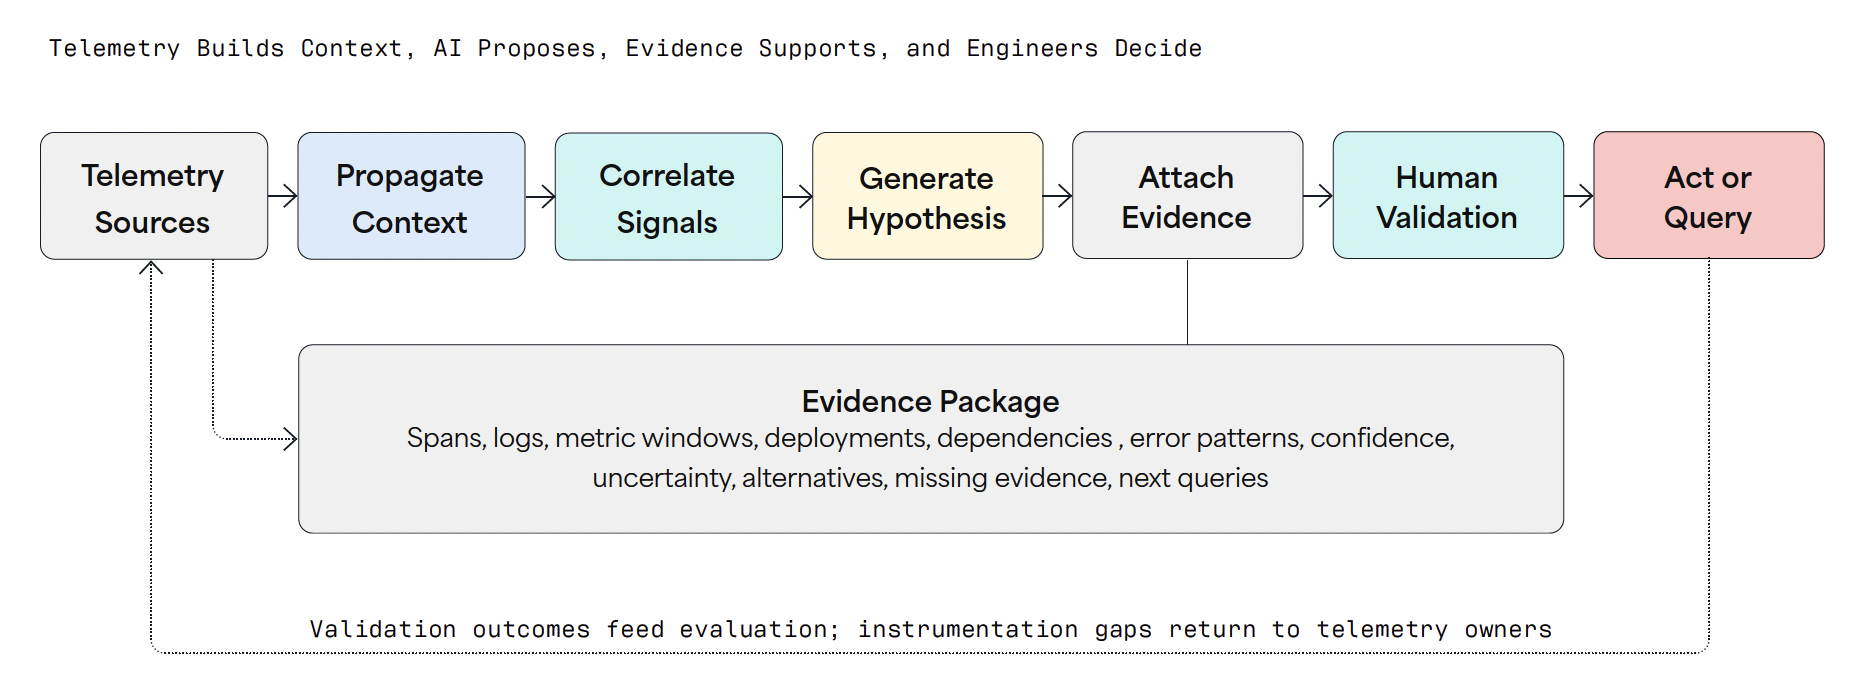
Effective AI-native observability requires establishing a single, reviewable loop: collect telemetry, propagate context, correlate signals, form hypotheses, preserve evidence, and obtain human validation.

AI-Assisted Investigation Flow

The same loop applies to standard microservices requests and complex agent workflows. A queue handoff, vector retrieval step, model call, tool invocation, database query, and code deployment event must remain navigable through trace identifiers, parent-child relationships, bounded semantic fields, and synchronized time. When an AI investigation yields a weak or inaccurate answer, teams can trace the failure back to the pattern it violates. Missing spans highlight instrumentation gaps, weak joins point to semantic inconsistencies, unsupported claims reveal investigation control failures, and repeated agent loops indicate workflow design defects.

Section 6

Conclusion

AI-native observability depends on the same discipline that governs reliable distributed systems — preserved causal context, consistent semantics, and operational evidence available for independent inspection. The fundamental difference is that model invocations, retrieval steps, tool executions, safety policy checks, and evaluation results now belong in that operational record. AI assistance provides genuine engineering value when responders can trace findings back to raw telemetry, understand what data is missing, test alternative hypotheses, and validate results before taking corrective action.

Like This Refcard? Read More From DZone

related article thumbnail

DZone Article

Using XML Policies to Log and Analyze API Calls from Azure API Management
related article thumbnail

DZone Article

Visualizing the Istio Service Mesh Using Kiali
related article thumbnail

DZone Article

RAG Architecture Patterns: Proxy, Caching, and Routing
related article thumbnail

DZone Article

Share Delta Lake Tables Between Databricks and Snowflake
related refcard thumbnail

Free DZone Refcard

Full-Stack Observability Essentials
related refcard thumbnail

Free DZone Refcard

Getting Started With Log Management
related refcard thumbnail

Free DZone Refcard

Observability Maturity Model
related refcard thumbnail

Free DZone Refcard

Getting Started With OpenTelemetry
  • RSS
  • X
  • Facebook

ABOUT US

  • About DZone
  • Support and feedback
  • Community research

ADVERTISE

  • Advertise with DZone

CONTRIBUTE ON DZONE

  • Article Submission Guidelines
  • Become a Contributor
  • Core Program
  • Visit the Writers' Zone

LEGAL

  • Terms of Service
  • Privacy Policy

CONTACT US

  • 3343 Perimeter Hill Drive
  • Suite 215
  • Nashville, TN 37211
  • [email protected]

Let's be friends:

  • RSS
  • X
  • Facebook