DZone
Thanks for visiting DZone today,
Edit Profile
  • Manage Email Subscriptions
  • How to Post to DZone
  • Article Submission Guidelines
Sign Out View Profile
  • Post an Article
  • Manage My Drafts
Over 2 million developers have joined DZone.
Log In / Join
Refcards Trend Reports
Events Video Library
Refcards
Trend Reports

Events

View Events Video Library

Zones

Culture and Methodologies Agile Career Development Methodologies Team Management
Data Engineering AI/ML Big Data Data Databases IoT
Software Design and Architecture Cloud Architecture Containers Integration Microservices Performance Security
Coding Frameworks Java JavaScript Languages Tools
Testing, Deployment, and Maintenance Deployment DevOps and CI/CD Maintenance Monitoring and Observability Testing, Tools, and Frameworks
Culture and Methodologies
Agile Career Development Methodologies Team Management
Data Engineering
AI/ML Big Data Data Databases IoT
Software Design and Architecture
Cloud Architecture Containers Integration Microservices Performance Security
Coding
Frameworks Java JavaScript Languages Tools
Testing, Deployment, and Maintenance
Deployment DevOps and CI/CD Maintenance Monitoring and Observability Testing, Tools, and Frameworks

Last call! Secure your stack and shape the future! Help dev teams across the globe navigate their software supply chain security challenges.

Modernize your data layer. Learn how to design cloud-native database architectures to meet the evolving demands of AI and GenAI workloads.

Releasing software shouldn't be stressful or risky. Learn how to leverage progressive delivery techniques to ensure safer deployments.

Avoid machine learning mistakes and boost model performance! Discover key ML patterns, anti-patterns, data strategies, and more.

  1. DZone
  2. Refcards
  3. Introduction to DevOps Analytics
refcard cover
Refcard #262

Introduction to DevOps Analytics

Discover the hidden value of using historical data to analyze and estimate a probabilistic measure of the success of a new release. This Refcard goes in-depth on the process to make the delivery lifecycle more efficient, the best analytics-as-a-service (AaaS) tools to use, and dashboards that will effectively help you display and understand your data.

Free PDF for Easy Reference
refcard cover

Written By

author avatar Luca Milanesio
Co-Founder, GerritForge
Table of Contents
► The Hidden Value of Your CI/CD Pipeline ► Continuous Improvement DevOps Lifecycle ► The Process Explained, Step-by-Step: ► Batch and Stream Processing Capabilities ► Data Dimensions ► Log and Events Extractions ► Feeding Events Into a Data Lake ► KPI Extractions ► Dashboards: Display and Understand Your Data ► Tools and AaaS Solutions
Section 1

The Hidden Value of Your CI/CD Pipeline

Today’s world is driven by rapid change. Failing to keep up with the pace of the evolution of technology and business models might lead even a large corporation to collapse in the blink of an eye. DevOps allows software, and thus businesses, to increase the speed of development and adapt to an ever-changing market, maintaining a level of quality and reliability that meet customers’ expectations.

There is a lot of pressure on dev teams to release on time, and decreasing the time-to-market is essential in today’s highly competitive environment.

When something goes wrong with a software release, the costs associated can be overwhelming, going from urgently producing patches to rolling back to the previous version when possible, if not having to re-engineer or even redesign significant portions of the software.

What we lack is proper visibility into the development process that would allow us to estimate the risks attached to a software release correctly. We want to have historical data to analyze and estimate a probabilistic measure of the success of a new release.

The Continuous Integration and Continuous Delivery (CI/CD, for short) pipeline is the engine that drives the DevOps methodology and allows teams to streamline the iterations of software changes from the initial idea to the rollout to the entire customer base. With a fast and efficient CI/CD pipeline, all the people involved in the design, implementation, testing, and rollout of software changes can work together and communicate seamlessly at any stage.

The CI/CD pipeline produces a lot of logs and events during every stage, including audits and comments on the issue, reviews on the code changes, build logs and tests result up to the deployment, and production logs. The sheer amount and size of that information lead many organizations to stash or even discard most of them. The collection, storage, and analysis of that data allow us to understand and improve the entire E2E DevOps pipeline.

The aim of DevOps analytics is to uncover the hidden value of CI/CD logs and events and demonstrate various benefits at different levels.

Each employee needs to see what is relevant to them in a form that is suitable to their skills and understanding:

Release Engineer Product Manager Delivery Manager Head of Engineering
Form Deeply technical with deep links Functional feature-based view Timeline view of deliveries Deliveries by dev teams
Value Improve pipeline stability Reduce time-to-market, maximize customer satisfaction Prevent delays and minimize post-release issues Maximize team cooperation, minimize risks related to a release
Section 2

Continuous Improvement DevOps Lifecycle

To implement DevOps analytics successfully, we should define an evolutionary process to focus on the final goal: speeding up the delivery cycle without compromising quality.

Let's walk through a real-life example. The project: development of the Gerrit Code Review Open-Source product; it has involved over 600 developers from all over the world with over 300 build jobs and millions of tests executed.

Section 3

The Process Explained, Step-by-Step:

1. Define goals and KPIs. Assess the current situation and define the parameters that you want to measure, typically based on time and quality. Start small, with a maximum of two KPIs per iteration. Example:

  • RT: Review Time: The interval between the first commit pushed and the merge into the main branch.

  • DQ: Deploy Quality: The percentage of features deployed divided by the number of bugs.

2. Extract logs and collect events. Understand what you have and collect it by keeping the metadata associated with the dimensions you are willing to measure. Example:

  • Commits and reviews: Extract all the version control code commits and the reviews activity associated.

  • Pipeline logs: Stream all the records of your CI/CD pipeline, e.g., Jenkins, to long-term storage, such as S3 or HDFS. Keep build logs, metadata, and test results.

3. Calculate KPIs and publish to dashboards. The amount of data accumulated needs to be transformed, processed, and re-aggregated on a constant basis. Example:

  • Get Gerrit Code Reviews metadata, and aggregate by Jira Issues associated with them.

  • Calculate the RT (average, p95, p99), DQ (average, p95, p99).

4. Make changes to the process. Identify which part of the process is more urgent to be addressed and improved. Focus on a single aspect to improve during each cycle. Example:

  • Improve RT by defining new policies

  • See if DQ increases or not

5. Assess the success of KPIs. Assess the change in trends for the next observation period after the change and see what has improved. Failures are part of learning.

6. Restart from Point 1.

Section 4

Batch and Stream Processing Capabilities

The CI/CD pipeline generates a colossal amount of data while requiring real-time collection and analysis of KPIs. Trying to analyze all the data at once would produce a lengthy and complicated job that would struggle to keep up with the pace of incoming data.

Think about the processing of the data as a funnel with a small opening. If too much liquid is poured into the funnel and the opening is not large enough, the liquid would overflow.

We need to get the data onto a distributed storage system to allow for parallel filtering and correlation tasks. We call this process the “batch processing layer” or BP. The incoming data is collected and stored in a time-series using a distributed storage implementation such as S3 or HDFS. BP is typically implemented using a parallel execution engine, such as YARN or Mesos, to run on a large-scale cluster to crunch all the historical data and distill the information that we need for analysis.

BP has a significant startup phase overhead because it needs to allocate the cluster, distribute the load, and run and collect the results. However, it does not need to run all the time because it works on a batch of data. Using a Cloud-based processing service such as Amazon Elastic MapReduce (aka EMR) would allow avoiding the setup and maintenance of the cluster and reducing costs by paying only for the amount of time needed for crunching the data and producing the results.

Secondly, we need to fill the gaps between batch executions. From when the BP starts and ends, new data is coming through, and we need to have a mechanism to adjust the results when new data comes in. A new “stream processing” layer — or SP — can manage this type of data flow. The amount of data is limited, and the way to transport and process the data is different.

SP needs to be activated on-demand as data is coming through and needs to be able to adjust the results obtained from BP with extra delta-results coming from the additional data received. Speed is more important than accuracy; the next BP phase can always adjust any small skew in the results. Data gets collected using a Pub/Sub mechanism such as Apache Kafka or Amazon Kinesis, and processing happens “on-the-fly” through stream-based elaboration.

BP and SP together are the data sources that collect the distilled data for further analysis.

Section 5

Data Dimensions

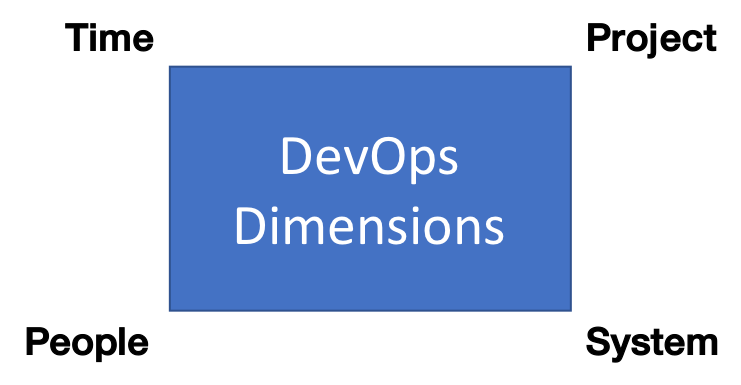
The CI/CD pipeline produces a lot of unstructured data that contains multiple facets. They all represent different views and aspects of what happens and how changes have evolved over time. When collecting the data, all these aspects need to be put into different axes that can be retrieved more efficiently during the analysis phase. We call each axis a dimension.

Image title

CI/CD pipeline data dimensions.

Time

All data is evidence of what has happened, and thus the timestamp is the first dimension we need when collecting and organizing the events.

The BP (Batch Processing Layer) can have a hierarchical data structure where data gets archived under the top-down folder structure of their associated timestamp.

Example: Year/month/day/hour.

Project

The project represents the set of repositories that are the source of the code or features produced, gives a vertical view of where the CI/CD pipeline is heading to, and groups all the events that relate to and influence its evolution.

Example of entities inside a single project: Jira projects, Confluence spaces, Jenkins pipelines, and a set of Git repositories.

System

The system identifies where the CI/CD pipeline is getting executed and gives a view of how the system performs and reacts based on the artifact produced.

Example of entities inside a single system dimension: Git Servers, Jenkins masters and slaves, Docker containers, and other deployment environments.

People

This represents the stakeholders and players that make sure that the CI/CD pipeline works, including the social links and organizational view of the people around the project.

Example of the people dimension: User identities, their organizational role, and group hierarchy.

Section 6

Log and Events Extractions

VCS Commit Info

The information of what code changes over time is extracted from the Version Control System (VCS). An advanced version control system, such as Git, contains the following information to be collected:

Field Information associated
Commit SHA1 Global unique global identifier of the code change
Author Who originally wrote the code
Committer Who participated in the editing and merge of the code
Subject The headline of what aspect of the functionality is involved
Issue ID References to the feature associated with the code change
Branch Line of development for all the features contained in a release

Dimensions involved: Time, repository, people.

Code Review Events

Extract and archive all interactions around the code, including feedback from other members of the team. When using Git, this translates to the extraction of the comments and associated score:

Field Information associated
Commit SHA1 List of code changes associated with the review
Change/Pull-Request Id Stream of commits associated to a feature under review
Reviewer Other people involved in the validation of the code
Comment Textual feedback provided on the overall change or individual lines of code
Label score Overall voting (positive, negative, neutral) on one aspect of the change

CI Build Metadata and Logs

Stream and store the logs and metadata associated with all the builds triggered on your Continuous Integration system. Each build log contains precious information such as the metadata that helps correlate upstream code changes:

Field Information associated
Commit SHA1 List of code changes associated with the build
Environment Label of where the build gets executed
Stages execution times How much time each stage of the build takes
Stage result Success or failure of one of the stage of the build
Test results Results of the execution of the code tests

Example: Jenkins CI has a logstash appender plugin that allows for streaming of the build logs and metadata to a topic stream. Test results are often published as JUnit XML results.

Issue Tracker Events

Sudit of the issue tracker transitions can tell where the time is spent in the early stages, even before the start of development.

The information captured is:

Field Information associated
Project name The high-level project that all the stories belong to
Issue ID Unique ID of the feature inside the project
Headline One-liner of what the story is about
Reporter / Assignee The person that created and then worked on the story
Old/New Status The transition of the story through the pipeline stages

The correlation of all the events with a single source story in the issue tracker allows the Product Manager to query the data from a business perspective while collapsing the project and source code view.

Section 7

Feeding Events Into a Data Lake

All the events happening on the CI/CD pipeline have different formats, availability, aggregation, and schemas. The first stage is the collection and storing of raw flat files in a time-based directory structure.

The traditional data warehouse model would approach the problem by developing some long and expensive ETL (Extract-Transform-Load) jobs that would feed a universal business intelligence multi-dimensional cube for analysis on a relational database. That approach would not scale well because of the following problems:

  • The DevOps Analytics lifecycle is based on continuous improvement: An ETL job would be forced to recalculate all the data from scratch every time it got new metrics.
  • The costs and time for maintaining the ETL job would impact the ROI of the analytics exercise.

A better approach is to split the Transformation phase (T) into two parts:

  1. Small-T: Preserve the data as much as possible with maximum detail. Transformation is limited to the reduction of time-based granularity, ID normalization across systems, and data-type conversions.
  2. Big-T: Join data from different sources and compute KPI values relevant to the business.

The E(small-t)L phase has the following characteristics:

  • Reduces disk space while keeping the same level of information.
  • Optimized for speed and selection.

The result is a massive reservoir of data called “Data Lake” that opens the door to further analysis in a very flexible and open way by all the other downstream analytics tools.

The Big-T phase, aka the KPI extraction, selects data from the Data Lake using a higher-order language and displays them into interactive dashboards.

Section 8

KPI Extractions

The goal of this phase is to distill information from the Data Lake and aggregate data across three dimensions: Projects, Systems, and People. Each of the target stakeholder roles need a different view of the same data on those dimensions.

Project Aggregation

Role Grouping Indicators
Release Engineer Development branches count(source code commits), count(tickets implemented), count(tests executed), average(test execution time), average(errors/tests)
Product Manager Epics and features average, variance and p95(cycle-time to production), average(errors/epics-features), max(errors/epics-features)
Delivery Manager Sprint sum(tickets), average, max, p99(lead time to be ready for dev), average, max, p99(ticket WIP time), average, max, p99(errors/tickets done)

People Aggregation

Role Grouping Indicators
Release Engineer Teams sum(commits), sum(code added/removed), sum(tests added/removed)
Delivery Manager Teams/people sum(contributors), average(reviews/commits), percentage(external reviews/tot reviews), average(tickets blocked time)

System Aggregation

Role Grouping Indicators
Release Engineer Subsystem/host average(queue time), average(cpu time), average(memory used), average(active threads)
Delivery Manager Subsystem average(tests execution time), average(active hosts), average(cpu time/hosts)
Section 9

Dashboards: Display and Understand Your Data

Data visualization is an easy way of radiating information and keep your KPIs visible, facilitating continuous monitoring, and focusing on the objectives set for you or your team.

It allows an easy way to compare data, spot patterns, and find correlations among different metrics.

Different information can be extracted depending on the number of data dimensions used:

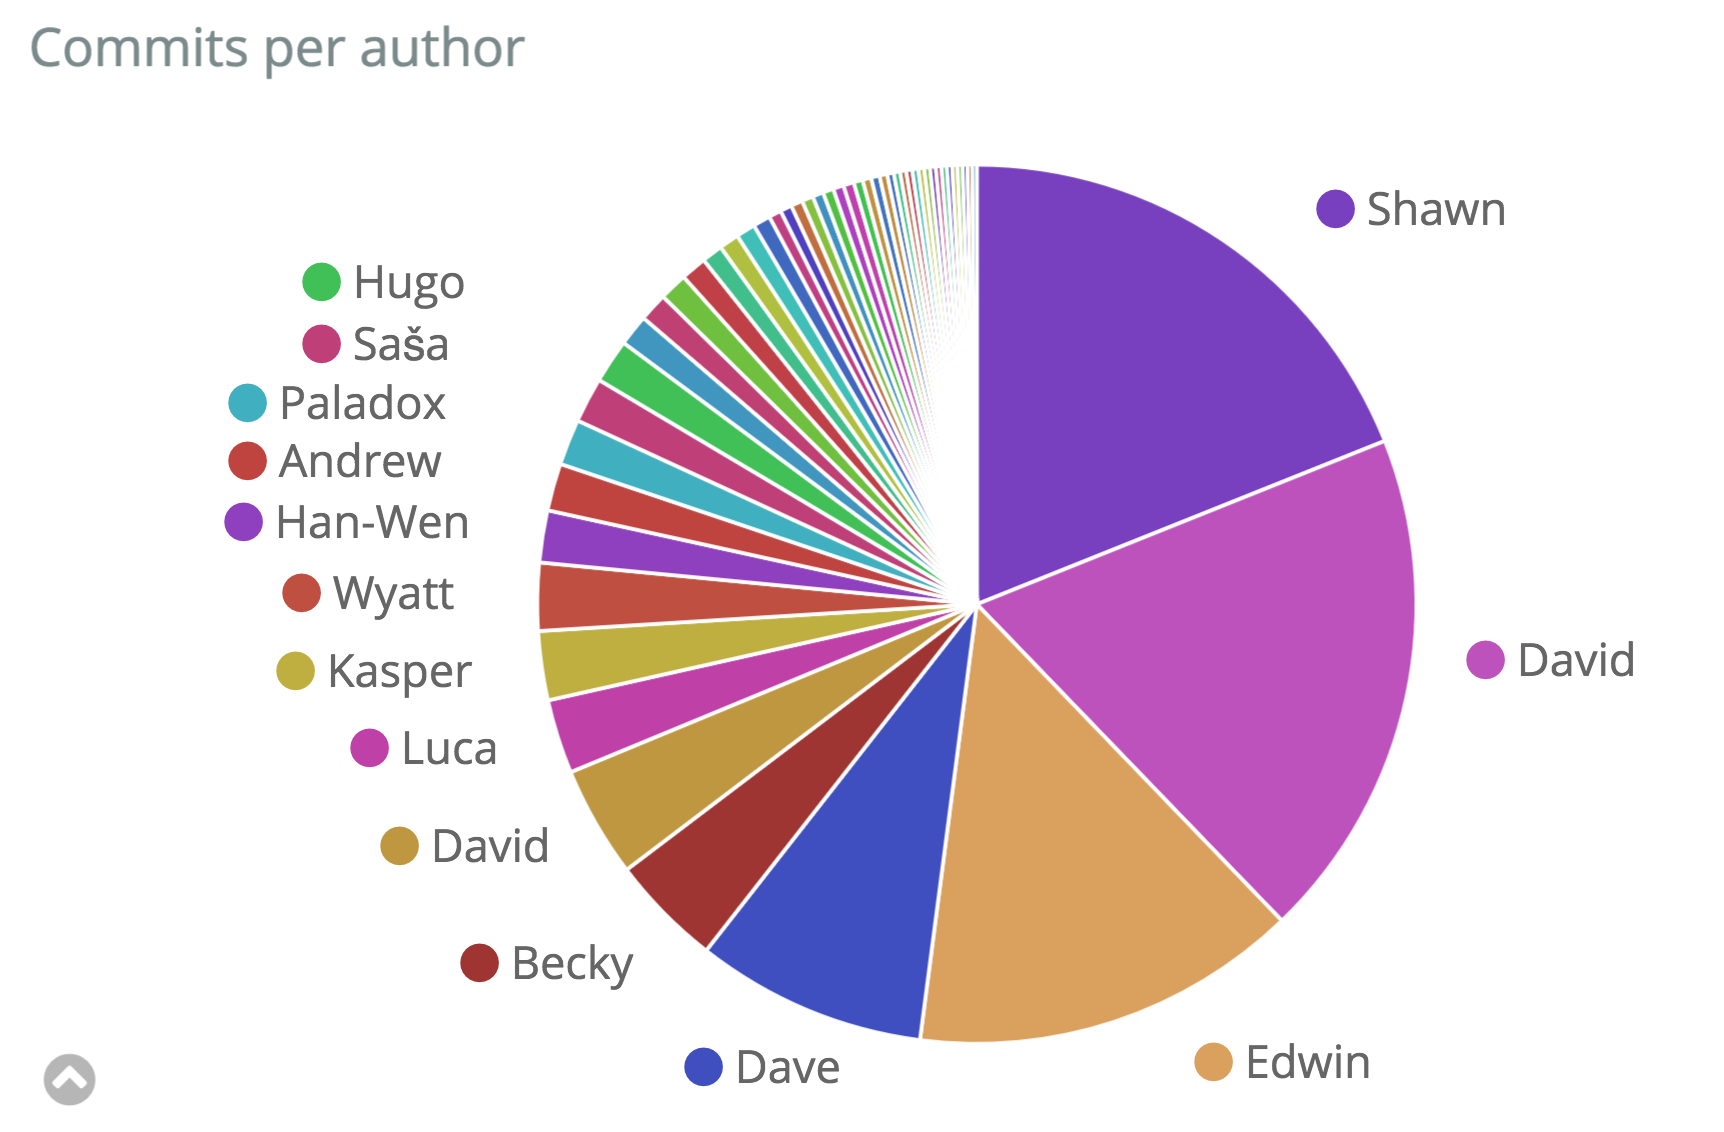
  • 1D (e.g.: pie charts, stacked bar charts): Gives an idea about the distribution of data point occurrence. It can be used, for example, to easily spot an uneven distribution of events. In the following graph it is easy to spot the predominance of commits from a single contributor in a project:

Image title

1D Graph Example: Gerrit open-source project Commits per user piechart.

This can give an idea of the level of collaboration among the person in a team. A predominance of commits by one member of the team might indicate a poor collaboration and cohesion among the members of the team.

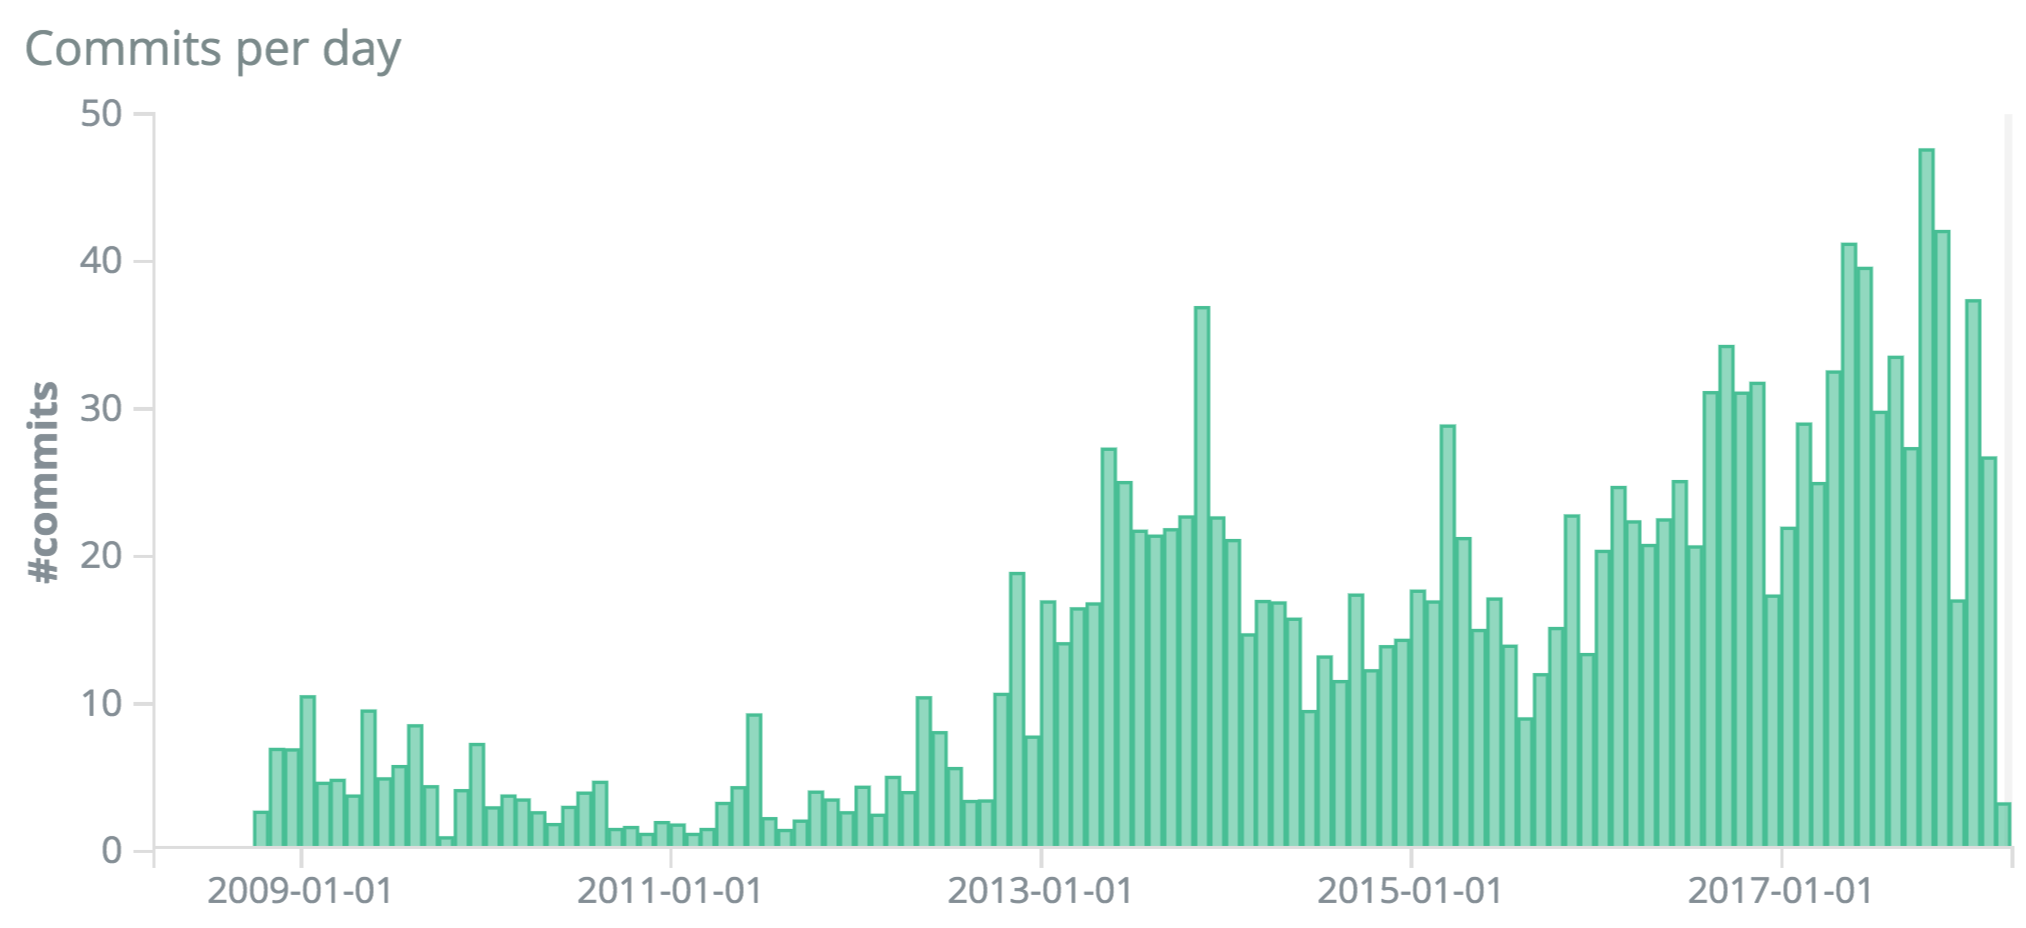
  • 2D (e.g.: histograms): Show trends of the relation between 2 metrics, such time and the number of events. Peaks (sudden changes in the trends) and flatness over time can be meaningful patterns to spot. Here is an example showing the number of commits over time for a project:

Image title

2D Graph Example: Gerrit open-source project Commits per day histogram.

Usually in a project, there are peaks of commits in the initial stage and around delivery times, the throughput is constant the rest of the time. A decrease in the throughput in the middle phase of a project might highlight a issue. Of course, this metric alone is not enough to reach a conclusion, it needs to be corroborated with other metrics, but it can ring an alarm bell.

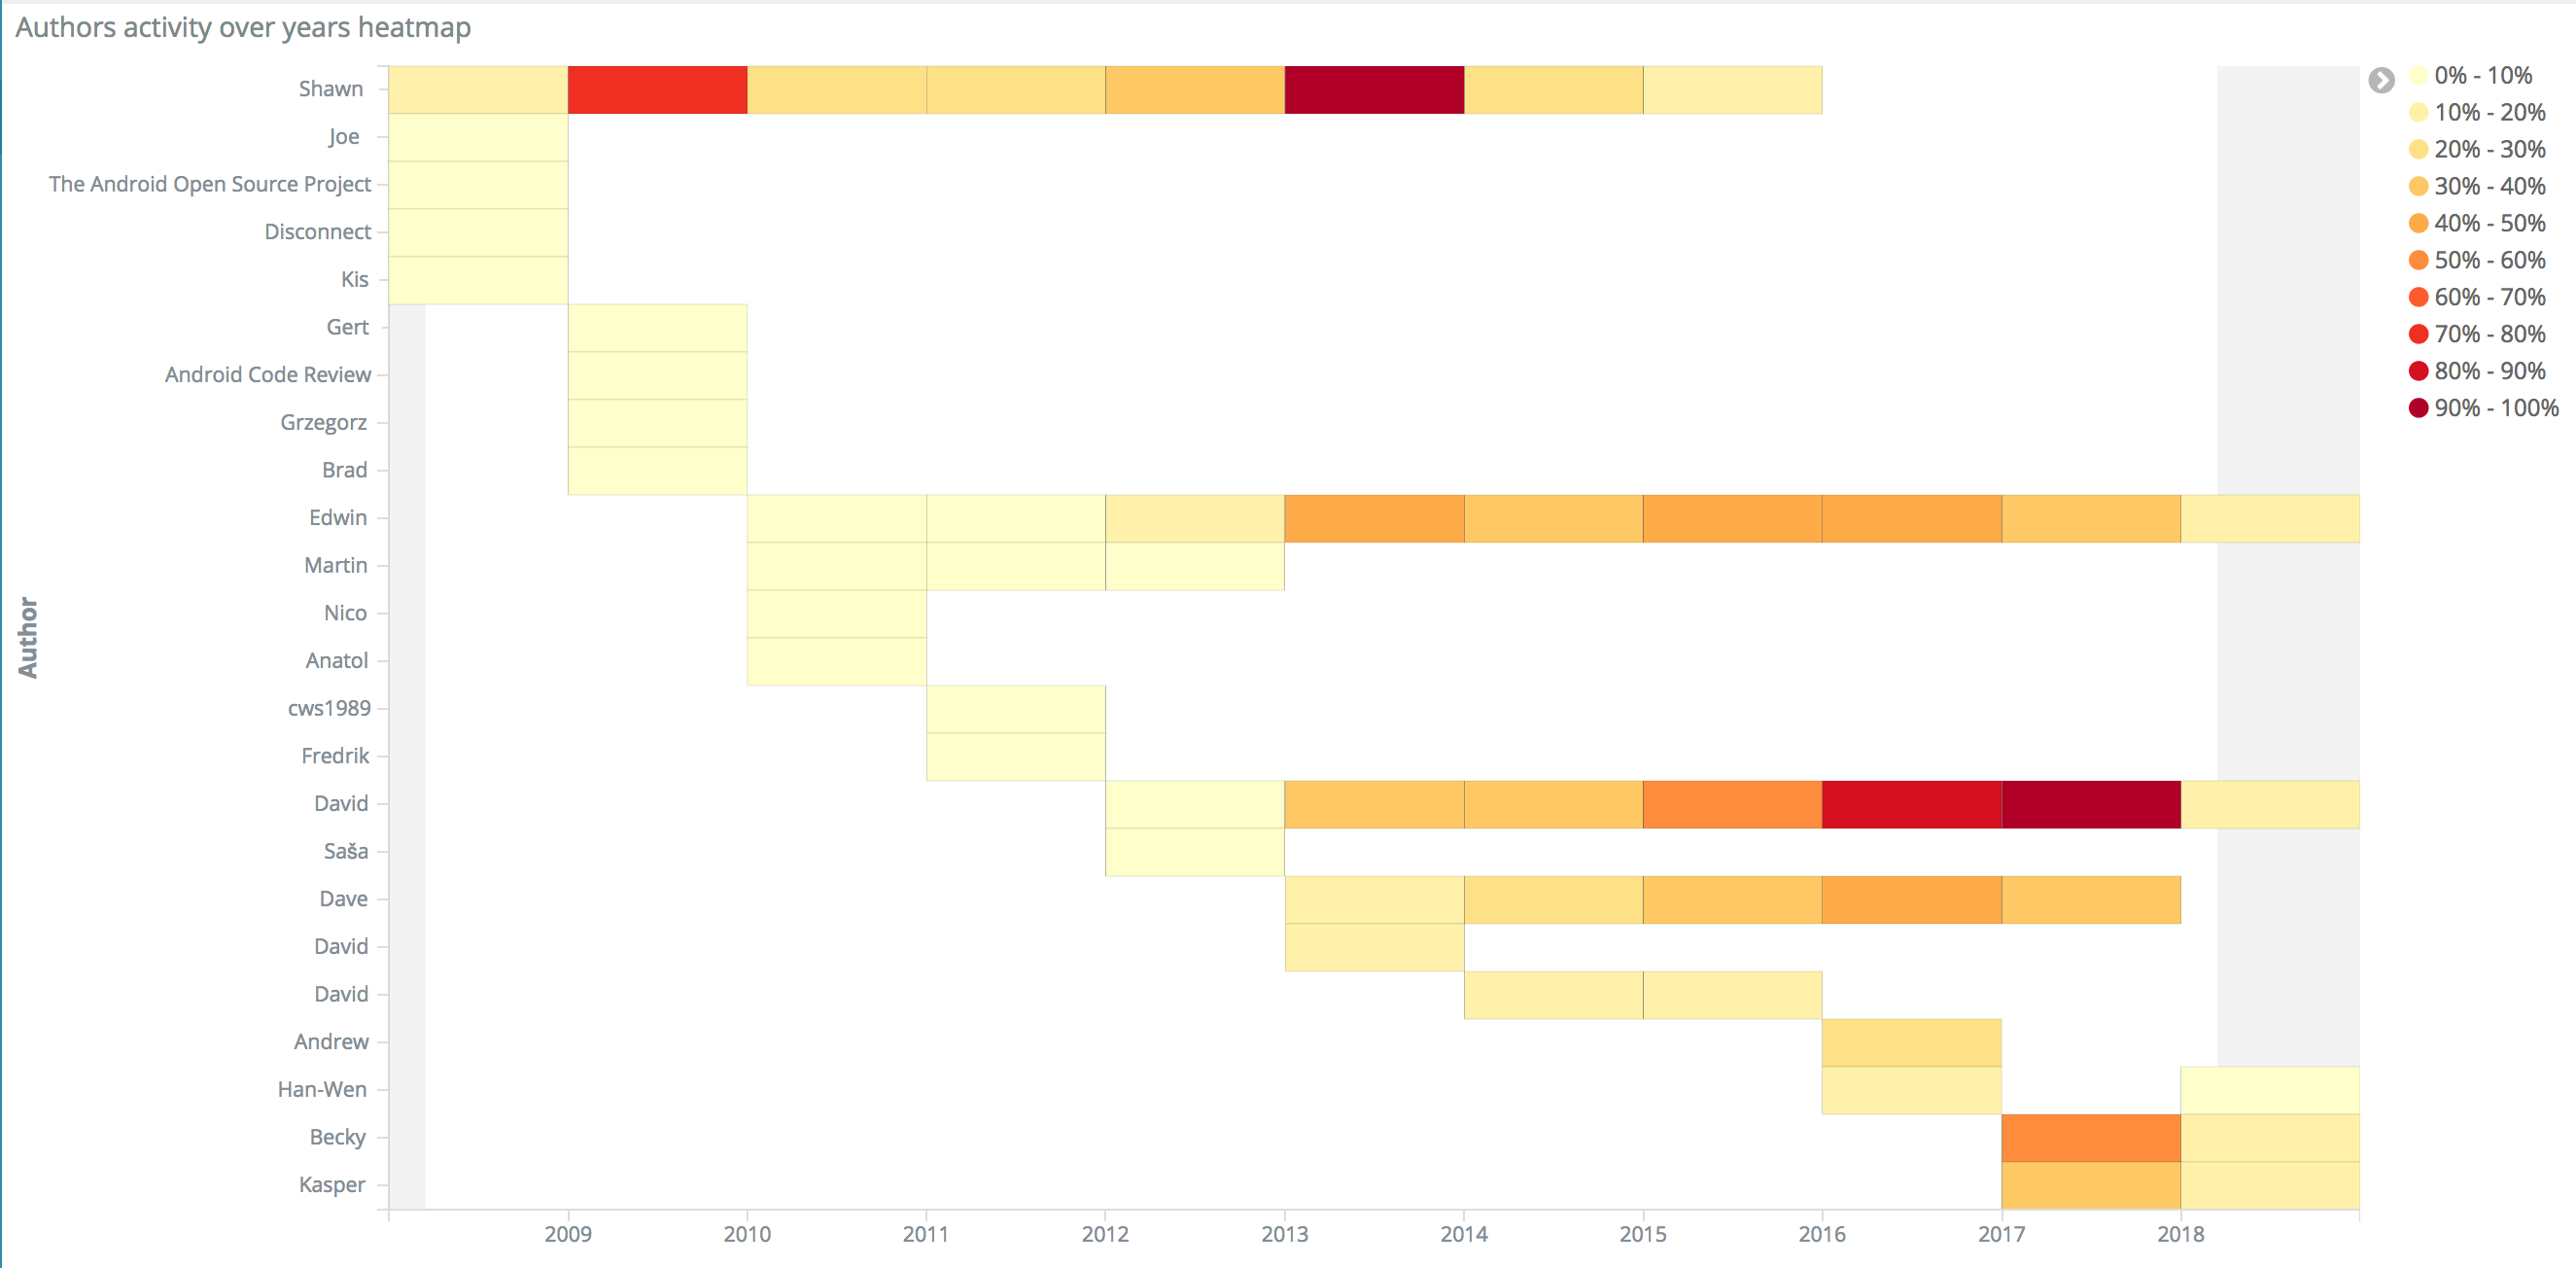
  • 3D (i.e.: heatmaps, treemaps): Show correlations among 3 metrics, such as time, commit count, and author. Here is an example:

Image title

3D Graph Example: Gerrit open-source project Commits over years per author heath-map.

This can show the contribution of a single team member over time. A 1D graph would give a snapshot at the time of this situation, while a 3D one can show the evolution over time. It can be used to spot changes in team activities and behaviors.

Since these metrics can inform measurements about team dynamics and code quality, KPIs can be set and easily monitored.

There are several open-source tools to achieve this; for example, Kibana or Tableau. The examples shown before were built using the former. In Kibana, a dashboard is a collection of visualisations. This gives the flexibility of composing different dashboards for different needs, reusing in components. Kibana is highly integrated with Elastisearch and Logstash, and the 3 are referred together as the ELK stack for log analytics.

Section 10

Tools and AaaS Solutions

All the techniques and tools described so far are freely available in the open-source community or on commercial standalone applications.

Open-Source vs. Commercial Tools

See below for a sample collection of open-source vs. commercial tools you may use to implement a successful DevOps Pipeline with Analytics:

  • VCS: Git/Gerrit Code Review (OpenSource) or GitHub (Commercial)
  • ALM/Issue Tracking: Tuleap OpenALM (OpenSource) or Atlassian Jira + Confluence (Commercial)
  • CI: Jenkins (OpenSource) or Circle CI (Commercial)
  • Distributed Storage: HDFS (OpenSource) or AWS-S3 (Commercial SaaS)
  • Processing: Apache Spark (OpenSource) on Hadoop or AWS-EMR (Commercial SaaS)
  • Indexing: ElasticSearch (OpenSource) or SPLUNK (Commercial)
  • Dashboards: Kibana (OpenSource) or Tableau (Commercial)

Either choice for any category would require people with the necessary skills to build, install, and maintain the entire software stack and keep it active on a 24x7 basis.

The Skills Gap Problem

For large companies with a dedicated team configuring and managing the entire pipeline, developing the skills to master all the tools is a plus. However, it is always better to start the iterations with something pre-configured or ready “out-of-the-box” to provide useful insights into the CI/CD pipeline from the very beginning. Recent studies highlighted that only 1 in 5 businesses have the skills needed to start and complete a successful DevOps Analytics implementation by themselves.

While investing in training your team and learning new tools, you need something to use as a reference to learn and iterate on the identification of what are the most relevant KPIs for your DevOps analytics improvement lifecycle.

Analytics-as-a-Service

Analytics-as-a-Service (aka AaaS) comes to the rescue, where you can get started very quickly and leverage your existing assets and data and, at the same time, learn new concepts, train your team without impacting your costs, and keep your ability to follow your BAU and project activities.

AaaS tools are cloud-based services that provide you with the final result of what your main stakeholders need, updated in real-time and in the form that your users need. You can get AaaS regardless of whether your services are currently running on a public/private cloud or are deployed on your own data centers. AaaS refers in fact to the analysis and publication of the results of the data coming from your systems, but do not require you to run or operate them.

That is great because it allows you to keep your existing CI/CD pipeline infrastructure while giving you exactly what is missing: the insights on how to improve it.

Like This Refcard? Read More From DZone

related article thumbnail

DZone Article

The Best Team Structures for DevOps Success
related article thumbnail

DZone Article

Using Python Libraries in Java
related article thumbnail

DZone Article

Infrastructure as Code (IaC) Beyond the Basics
related article thumbnail

DZone Article

Endpoint Security Controls: Designing a Secure Endpoint Architecture, Part 2
related refcard thumbnail

Free DZone Refcard

Platform Engineering Essentials
related refcard thumbnail

Free DZone Refcard

The Essentials of GitOps
related refcard thumbnail

Free DZone Refcard

Continuous Integration Patterns and Anti-Patterns
related refcard thumbnail

Free DZone Refcard

Getting Started With CI/CD Pipeline Security

ABOUT US

  • About DZone
  • Support and feedback
  • Community research
  • Sitemap

ADVERTISE

  • Advertise with DZone

CONTRIBUTE ON DZONE

  • Article Submission Guidelines
  • Become a Contributor
  • Core Program
  • Visit the Writers' Zone

LEGAL

  • Terms of Service
  • Privacy Policy

CONTACT US

  • 3343 Perimeter Hill Drive
  • Suite 100
  • Nashville, TN 37211
  • support@dzone.com

Let's be friends: