10+ Essential Visualization Libraries for Svelte Apps in 2024
An overview of top data visualization frameworks and libraries to help Svelte developers integrate charts, node-based diagrams, and project planning tools.
Join the DZone community and get the full member experience.
Join For FreeAccording to the online survey conducted in July 2024 by Stack Overflow, Svelte is currently on the list of most popular web frameworks and technologies with the usage score of 6.5%. In 2023, Svelte was rated highly by the respondents, thus winning the title of the second-most admired web framework, and it has been maintaining its leading position ever since.
With Svelte's ever-growing popularity and the recent major release of Svelte 5, the ecosystem of tools and libraries for solving a wide range of tasks within Svelte applications continues to grow.
Visualization tools are critical for designing modern applications that transform analytical data into interactive charts, real-time dashboards, and detailed process visualizations. So today, we’ll review top graphic libraries, frameworks, and components that can be integrated seamlessly into Svelte projects.
After studying the existing Svelte solutions for data representation, I've prepared a list of data visualization libraries and frameworks for you to choose from.
Graphic Frameworks
We'll start by exploring data visualization frameworks that can be used to create robust and customizable data visualizations within Svelte applications. Unlike standard libraries, graphic frameworks offer developers more freedom for creating and customizing complex visualizations, providing more flexibility and control. This makes them ideal for highly customized or large-scale data visualization needs.
Unovis
License: Apache 2.0 / GitHub: 2.2k stars
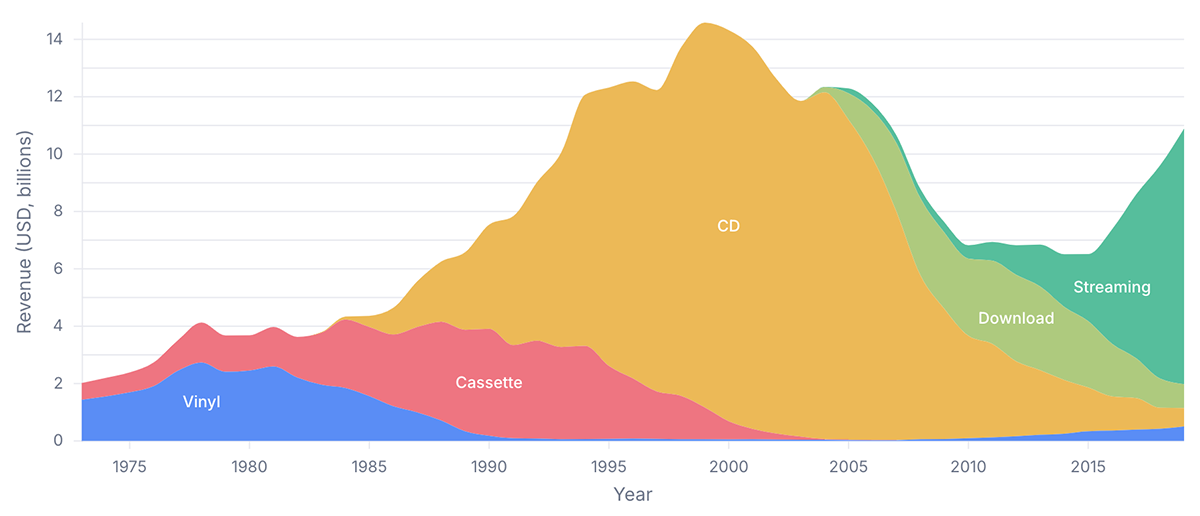
Unovis is a data visualization framework you can use for creating all kinds of charts (line, area, circular, bar, composite), maps (including advanced leaflet maps) and network graphs. Unovis is built with Typescript and compatible with all modern frameworks, including Svelte.
Unovis is distributed in the format of ES modules. After installing the library, simply import its components from @unovis/... packages. As the library is framework independent you can utilize its elements without any UI framework as well.
import { VisXYContainer, VisLine, VisAxis } from '@unovis/svelte' The minimal Line configuration for Svelte looks like this:
<script lang='ts'>
  import { VisXYContainer, VisLine } from '@unovis/svelte'

  export let data: DataRecord[]
  const x = (d: DataRecord) => d.x
  const y = (d: DataRecord) => d.y
</script>

<VisXYContainer {data}>
  <VisLine {x} {y}/>
</VisXYContainer>
Layer Cake
License: MIT / GitHub: 1.4k stars
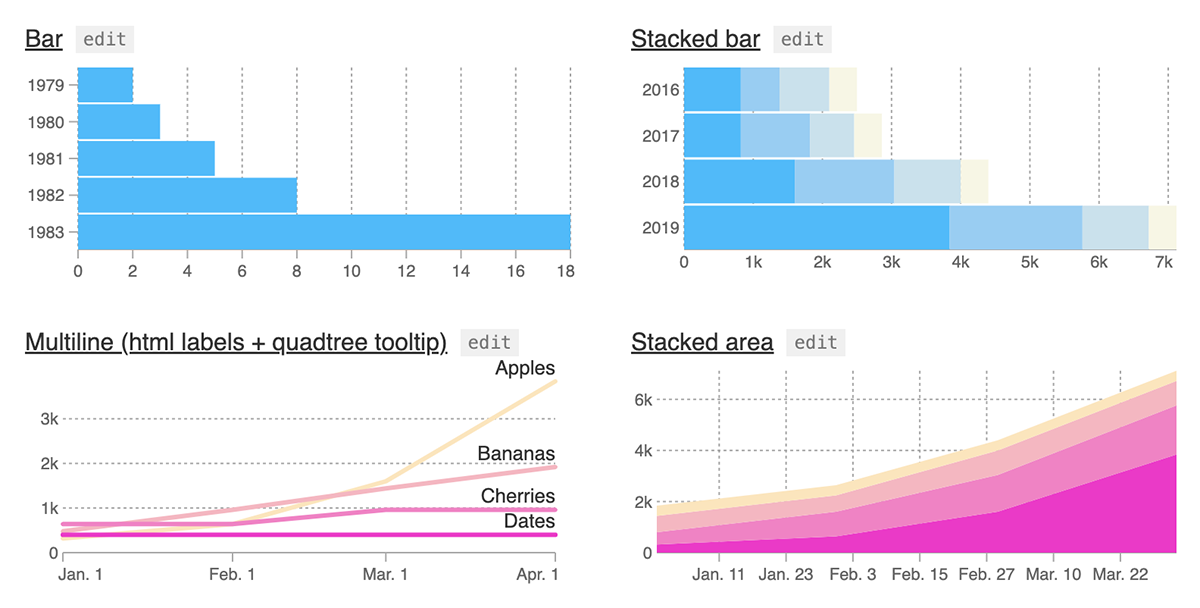
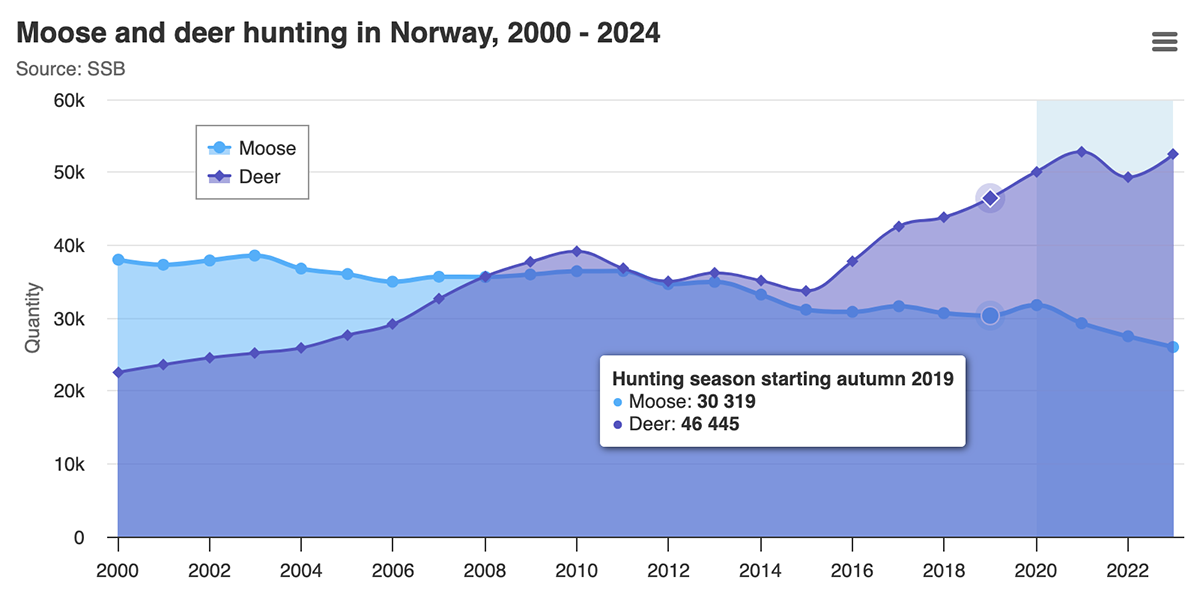
Layer Cake is a graphic framework designed for Svelte and compatible with the latest Svelte 5 update. It provides scales, a coordinate system, and DOM elements that allow you to create components for graphic data representation with the help of layers.
Layer Cake does not behave like a traditional library, which means the code you use lives inside your app, and you receive the possibilities for the deep customization of the elements, getting full control of them. The framework equips you with helper functions for the correct data formatting.
To install Layer Cake, you need to add it to your dependencies alongside Svelte:
npm install --save layercake
The idea behind a Layer Cake chart is that you can start from a basic scatter, line or bar chart template and later customize them for your specific needs. In contract to high-level charting libraries, Layer Cake is focused on giving you the tools to create, customize and reuse your own visualization components, rather than automatically generating specific chart views.
Flitter
License: MIT / GitHub: 280+ stars
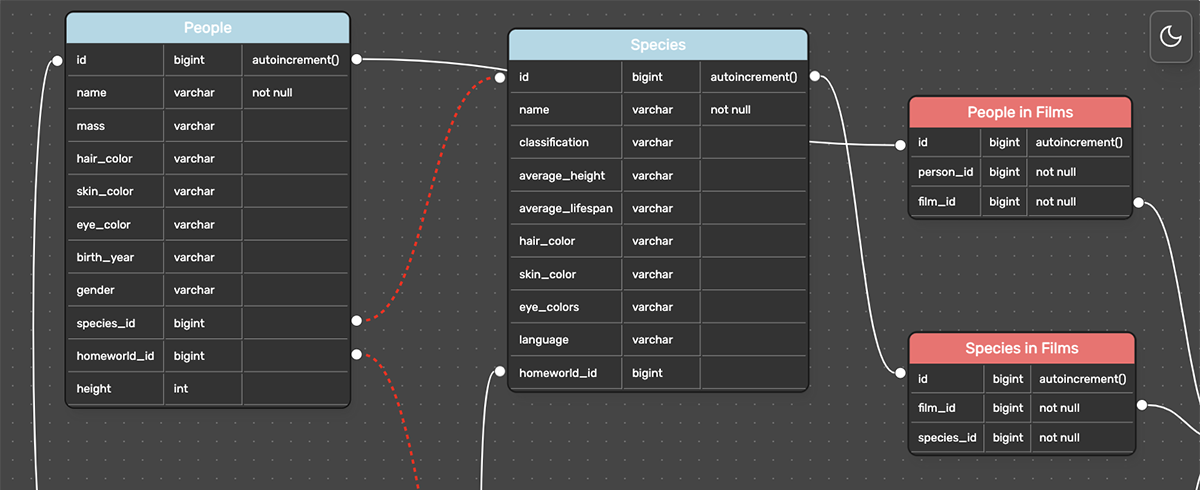
Inspired by Flutter, Flitter is a JS rendering engine for creating advanced web graphics, including entity-relationship diagrams for visualizing database structures. It supports SVG and Canvas and is compatible with Svelte, React, and other frameworks. It allows you to create complex layouts providing an easy way of handling them.
It can be used with Svelte by means of creating a new SvelteKit project:
npm create svelte@latest my-flitter-svelte-app
cd my-flitter-svelte-app
Then, you need to install dependencies:
npm install
And install Flitter and its Svelte bindings:
npm install @meursyphus/flitter @meursyphus/flitter-svelteProject Planning Visualization
If you're building a web app with a project management functionality, this section provides an overview of two ready-to-use Gantt chart solutions that can be seamlessly integrated with Svelte.
SVAR Svelte Gantt
License: GPLv3 / GitHub: 30+ stars
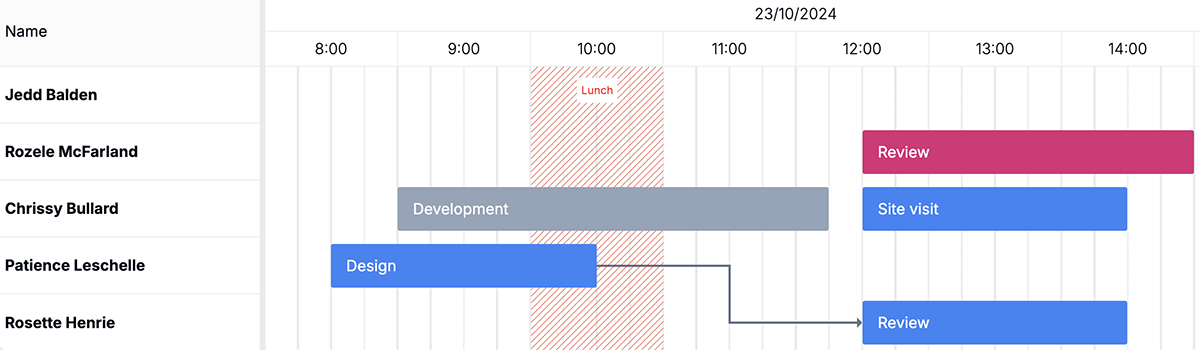
SVAR Svelte Gantt is a recently released Svelte component for creating interactive and visually attractive Gantt diagrams. Written in Svelte, lightweight, it effectively handles large data sets and provides enterprise-grade user interface for project and task planning and tracking.
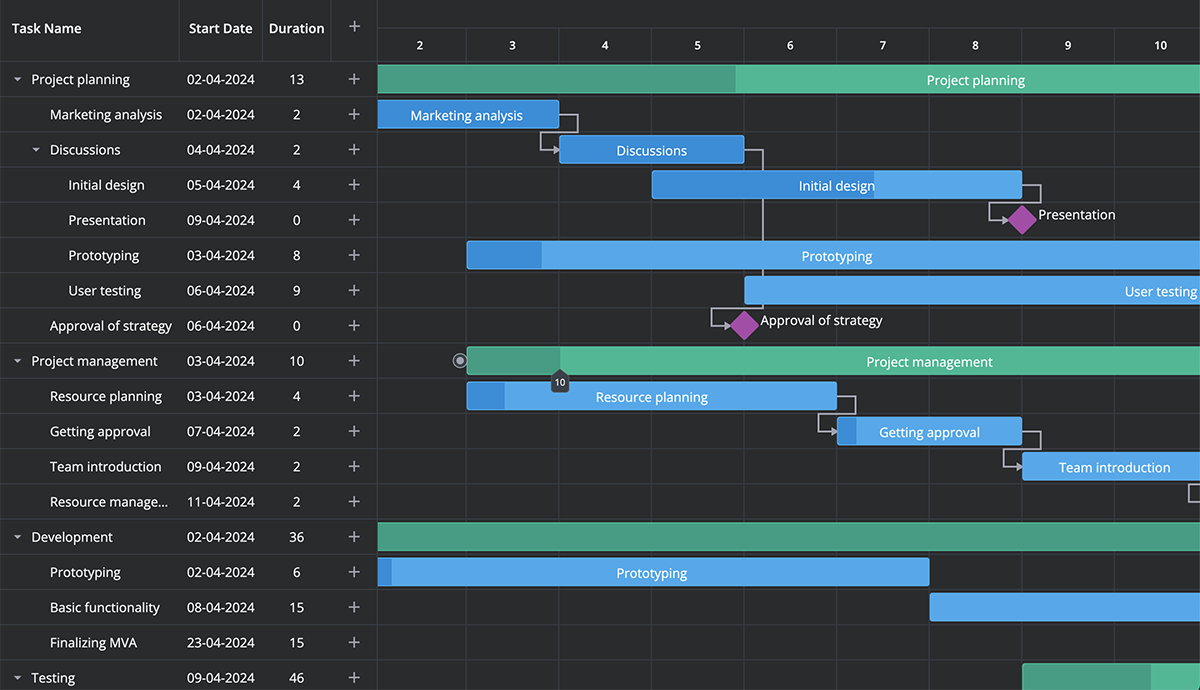
The component provides a wide range of features for effective project management: drag-and-drop task management, task reordering, a simple popup form for task and dependencies editing, tooltips with task details, a toolbar, a context menu, etc. You can easily customize the look and feel of this Svelte Gantt chart with intuitive script API and use it with your preferred back-end technologies.
To install SVAR Gantt, you need to go through the following steps:
Install the library with npm:
npm install wx-svelte-ganttInitialize the Gantt component:
<script>
  import { Gantt } from "wx-svelte-gantt";
</script>

<Gantt />
Svelte-Gantt
License: MIT / GitHub: 520+ stars
Svelte-Gantt is another Gantt chart component written in Svelte that is compatible with modern UI frameworks. It provides the possibilities of real-time task updates, working with a large number of tasks, zooming the charts, setting dependencies, ect.
The component can be installed via npm:
npm install svelte-ganttAdd imports to your file:
import { SvelteGantt, SvelteGanttTable } from 'svelte-gantt';Initialize the component:
var options = {
    /* ... */
};

var gantt = new SvelteGantt({
    // target a DOM element
    target: document.getElementById('example-gantt'),
    // svelte-gantt options
    props: options
});
Charting Libraries
This section covers the Svelte libraries that provide a collection of different charts types.
Layer Chart
License: MIT / GitHub: 640+ stars
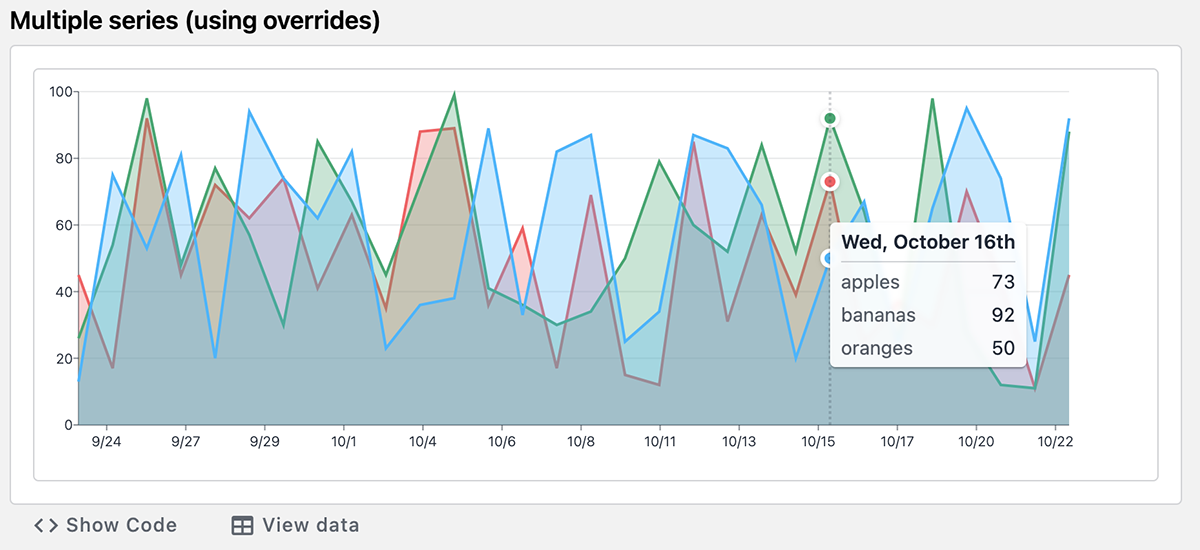
Layer Chart is a Svelte library built upon the above-mentioned Layer Cake framework. It offers a comprehensive collection of visualization utilities and components. The core idea of a Layer Chart is to provide building blocks for creating different kinds of visualizations, from simple to complex charts, interaction elements, and primitives.
To install the library, use:
npm install layerchartThen, update LayerChart components to tailwind.config.cjs content:
module.exports = {
  content: [
    './src/**/*.{html,svelte}',
    './node_modules/svelte-ux/**/*.{svelte,js}',
    './node_modules/layerchart/**/*.{svelte,js}' // <--- Add this
  ],
};
Import LayerChart component into your app:
<script>
  import { Chart, Svg, Axis, Bars } from 'layerchart';
</script>
Flowbite Svelte Charts
License: MIT / GitHub: 2.2k stars
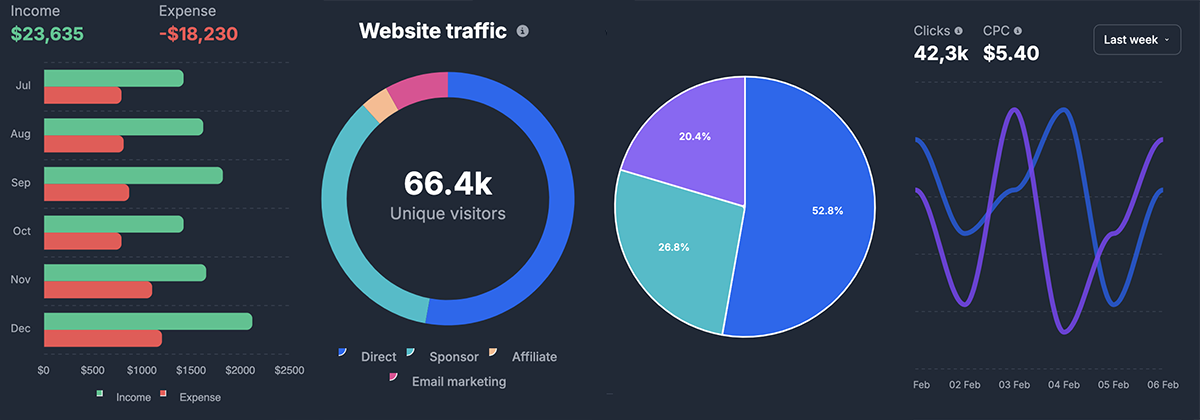
This charts plugin is a part of bigger Flowbite Svelte library that includes a vast variety of open-source UI components. The charts component is based on ApexCharts and Tailwind CSS and provides modern-looking charts: line, pie, bar, area, column, and radial.
To start working with Flowbite Svelte Charts, you need to install the Flowbite Svelte library using SvelteKit or Svelte, as well as Tailwind CSS to enable the utility classes. More info can be found in the docs.
Svelte-chartjs
License: MIT / GitHub: 300+ stars
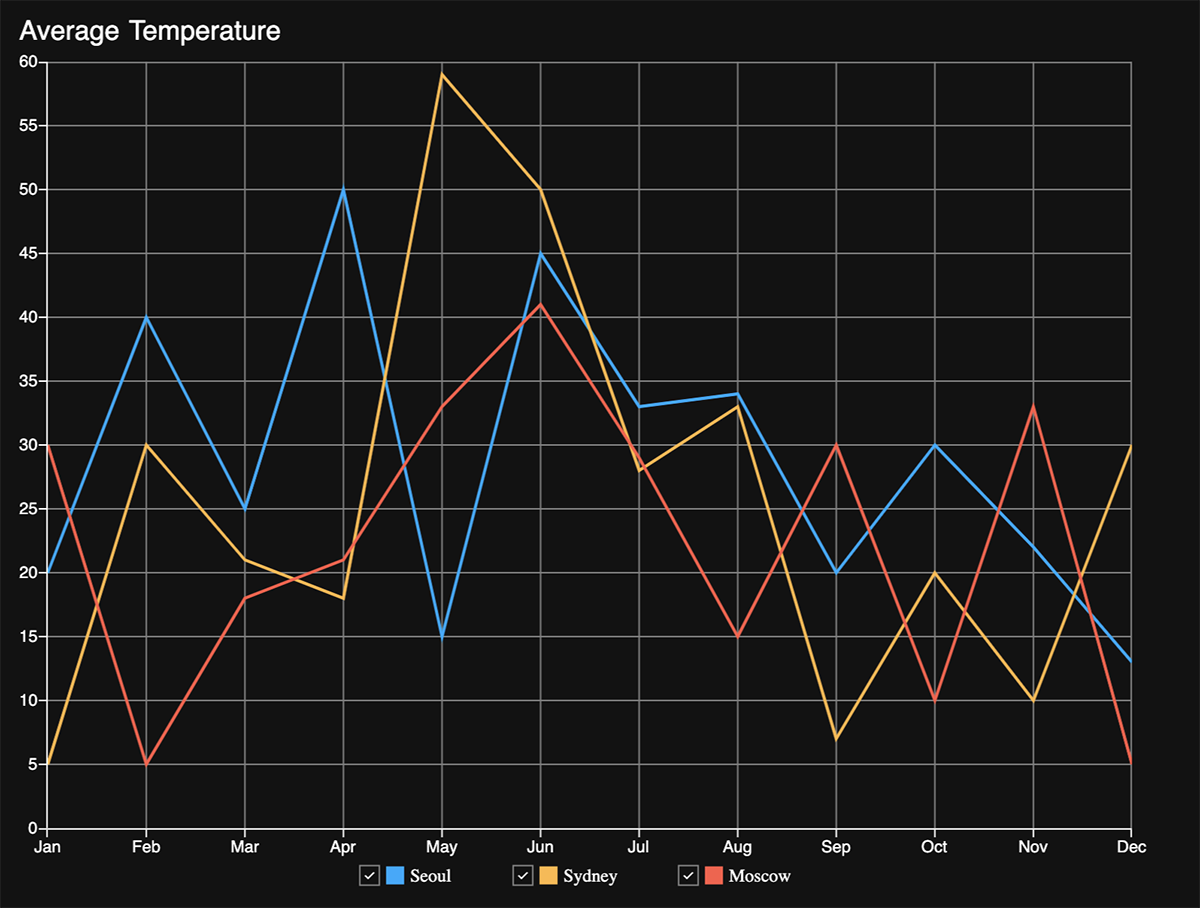
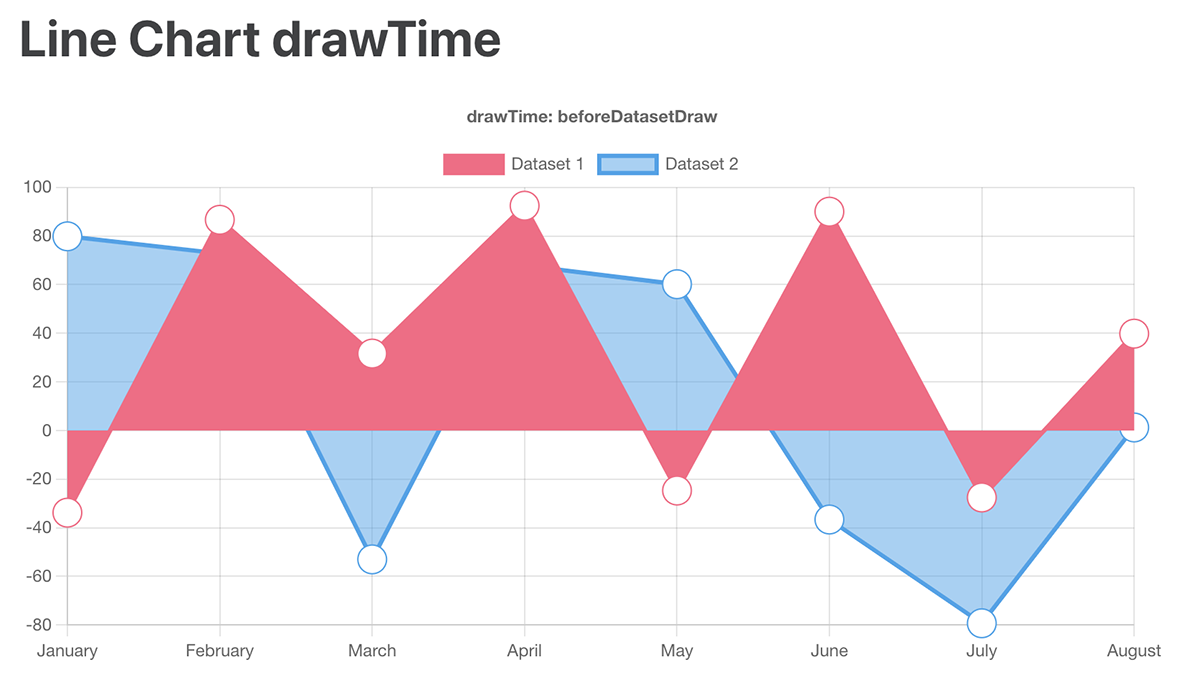
Svelte-chartjs is a Svelte wrapper for Chart.js, a modern and widely-used web charting library providing a wide variety of charts and plugins together with the possibility of their customization and seamless integration with Svelte, React, View, and Angular.
To use the wrapper in your project, you can install it via npm or yarn:
npm i svelte-chartjsyarn add svelte-chartjsAnd use in your code this way:
<script>
  import Line from "svelte-chartjs/src/Line.svelte"
</script>
<Line data={...} />
Highcharts
License: paid for commercial use (from $168 per seat annually).
Highcharts for Svelte is a special wrapper for integration of Highcharts library into a Svelte app. The wrapper gives access to Highcharts Core, Stock, Maps, and Gantt chart blocks, providing vast possibilities for implementing all their advanced functionalities.
The package is installed via npm:
npm install @highcharts/svelte highcharts --saveAnd can be used in your project this way:
<script lang="ts">
    import Highcharts from 'highcharts';
    import ExportingModule from 'highcharts/modules/exporting';
    import { Chart } from '@highcharts/svelte'; // Chart is also exported by default

    // Applying a certain Highcharts module
    ExportingModule(Highcharts);

    let options = {
        chart: {
            type: 'line'
        },
        title: {
            text: 'My Chart'
        },
        series: [{
            data: [1, 2, 3, 4, 5]
        }]
    };
</script>

<Chart options={options} highcharts={Highcharts}/>
Tiny Linked Charts
License: none / GitHub: 80+ stars
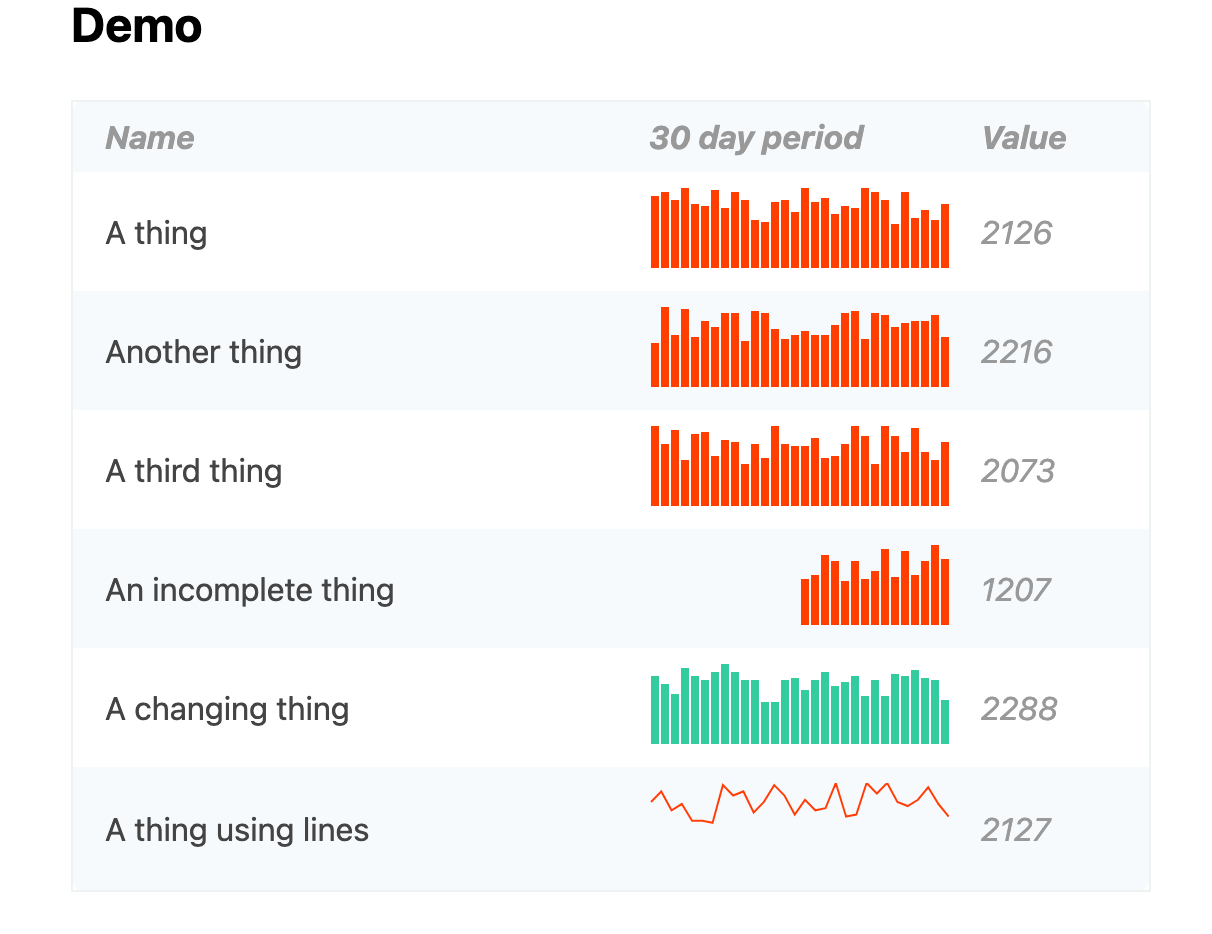
Tiny Linked Charts is a handy Svelte library designed for the purposes of graphic data representation rather than for the scientific illustration of processes or tendencies. The library contains tiny bar charts with no axis labels or additional details referring to the data that you visualize.
You can install Tiny Linked Charts via yarn or npm:
yarn add svelte-tiny-linked-chartsnpm install --save svelte-tiny-linked-chartsNode-Based Diagrams
And speaking about data visualization, it's hard to avoid node-based flow diagrams. So here are two solutions that can be used in Svelte apps.
Svelvet
License: MIT / GitHub: 2.6k stars
Svelvet is a Svelte library for creating dynamic interactive diagrams and node-based UIs. Svelvet components are easily customizable, support node-to-node data flow, and ensure accurate and attractive data representation without extra configuration.
You can use npm or yarn to add Svelvet to your project:
npm install svelvetyarn add svelvetThen, you will be able to create canvases with the help of the following components: Svelvet, Node, Controls, and Minimap.
With Svelvet, you can create fully customizable, elegant, and interactive node-based interfaces with smooth drag-and-drop functionality.
Svelte Flow
License: MIT (sponsorship for commercial projects) / GitHub: 25k stars (xyflow)
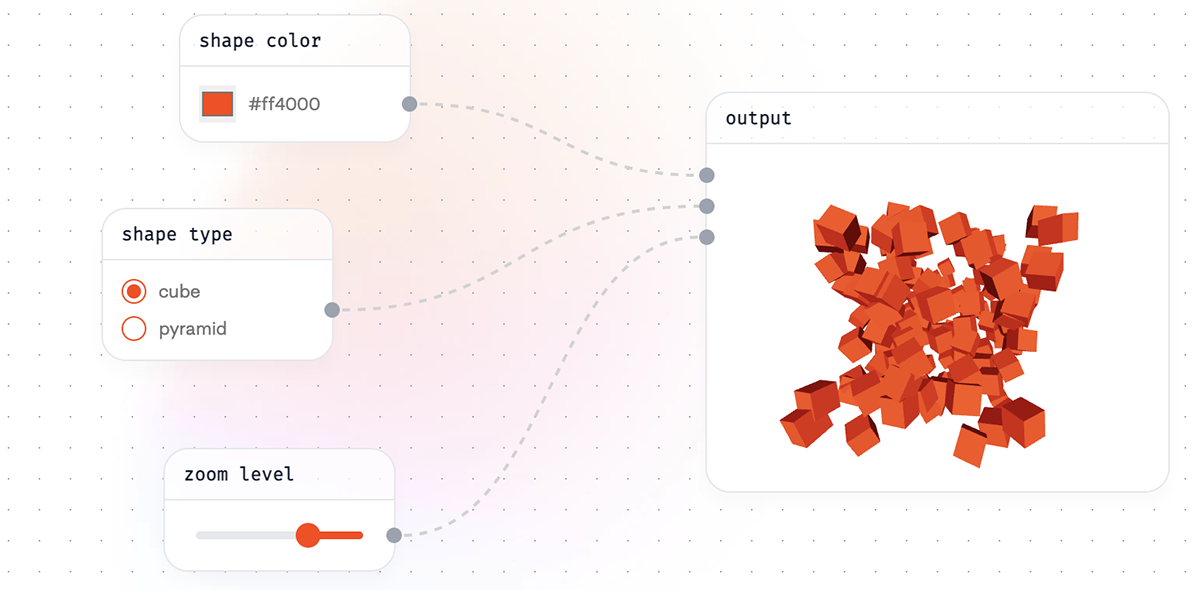
Svelte Flow is a customizable tool for creating interactive diagrams and node-based editors engineered by the creators of React Flow. The library provides the following built-in functionalities: zooming, multiple nodes selection, dragging, adding and removing edges.
Svelte Flow focuses on creating flow-based programming environments where users can visually connect different functional blocks. It provides a set of pre-built components like nodes, edges, and workspaces to construct these visual programming interfaces.
As stated on their GitHub page, Svelte Flow is still in the alpha version. While the API is relatively stable, some changes might be applied in the future.
The library can be installed using npm, yarn, or pnpm:
npm install @xyflow/svelteyarn add @xyflow/sveltepnpm add @xyflow/svelteConclusion
In this article, I’ve put together some of the most recent and relevant data visualization solutions for Svelte: libraries, frameworks, components, and wrappers. Each option satisfies a specific need in data representation, offering a range of possibilities depending on the complexity and scale of your project.
I hope this list serves as a helpful starting point, giving you a clear understanding of what tools are available when choosing a visualization library or framework for your Svelte application. As Svelte continues to evolve and gain popularity, the ecosystem of data visualization tools will most likely expand, offering even more powerful and optimized solutions for developers.
Opinions expressed by DZone contributors are their own.
Comments