JavaScript Data Visualization Libraries: How to Choose the Best
Most important factors to consider, while choosing the right JavaScript data visualization library for your project.
Join the DZone community and get the full member experience.
Join For FreeData visualization is required for the UI/dashboard of any program that focuses on data. It can be challenging to create accurate charts and infographics, but fortunately, many JavaScript libraries are available. However, there can be an overwhelming variety of options, each with advantages and disadvantages. You can use this article to choose a JavaScript data visualization library and learn more about its features.
Here are the most important factors to consider while choosing the right JavaScript data visualization library for your project.
Compatibility With Browsers and Devices
One of the most important indicators of an effective data visualization library is its accessibility to everyone. This can be accomplished in two ways: first, by having an easy-to-use interface, and second, by being accessible across all platforms. You can choose a solution with a fully responsive design and mobile compatibility.
Versatility of Tools
Data preparation is the first functionality that must be covered for proper data processing to provide meaningful visualizations with genuinely helpful information. Advanced and predictive analytics are also crucial for data visualization libraries to maximize your data and improve your ability to predict the future.
Capacity for Data Processing
Establishing that the chosen solution can give an optimal performance while managing a significant amount of data is important. Pay special attention to how well a data visualization library can manage multiple sources. The tool must be able to import any type of file and quickly connect to different databases.
Adaptability for Every Need
Every business has unique requirements and qualities. So, it is good to find a flexible solution that can change to meet the needs of a specific company. Additionally, a decent data visualization tool must be adaptable to the organization's industry. For example, retail businesses don't have the same requirements as financial experts or government agencies.
Convenient Exporting
If you are creating dashboards for business users, they might want to export their data and charts to PDF or images. It will be ideal if the data visualization library you use has an export function built in from the start.
Helpful Support
When you encounter a problem, you may want outside assistance to overcome it. Support might take many different shapes, such as personal consultation, tech support, or community forums. The majority of general questions are already answered in popular data visualization libraries through documentation, tutorials, or FAQ sections.
These are some well-known data visualization libraries that would be a wonderful asset to any data-intensive application.
D3.js
Effective for creating dynamic and interactive data visualizations for web browsers. It builds graphs, maps, and pie charts using current web standards. D3.js offers tools that help to create charts incrementally from the ground up. This makes it considerably more challenging to rapidly design a basic chart using D3.js because you need to understand how its functions and modules operate.
Webix JavaScript Charts Library
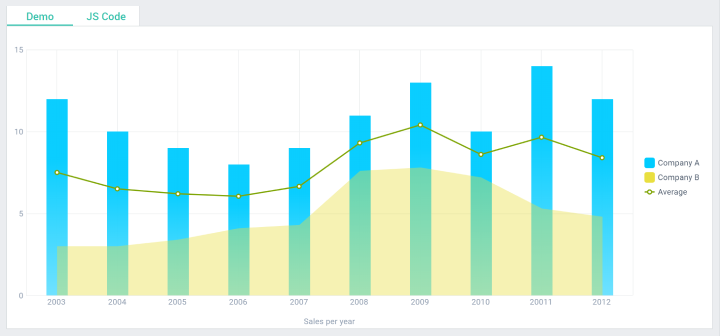
Graphing and charting framework used to create exceptional analytical online apps and unique user interfaces. It enables the implementation of dynamic data visualization with fluid animation and several interactive elements. The interactive UI controls include 14 types of charts and data tools, such as sorting, filtering, and grouping. The data export feature converts information into PDF, PNG, Excel, and CSV formats.
DHTMLX JavaScript Charts Library
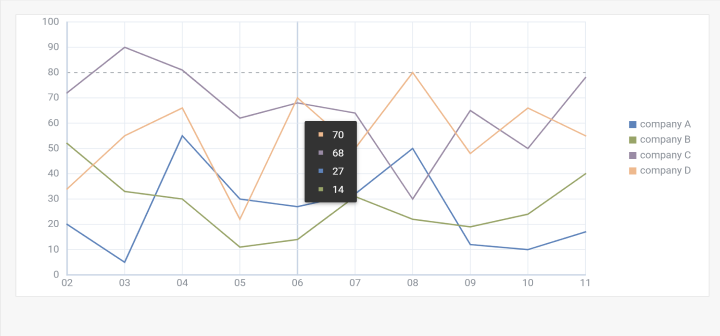
A flexible JavaScript chart library with countless settings, customization options, and code snippets. Chart configuration can be instantly adjusted thanks to the DHTMLX rich API. You may build an entirely online application by combining DHTMLX Charts with other UI widgets. Data from Charts and DHTMLX Grid can be synchronized for seamless updates.
Chart.js
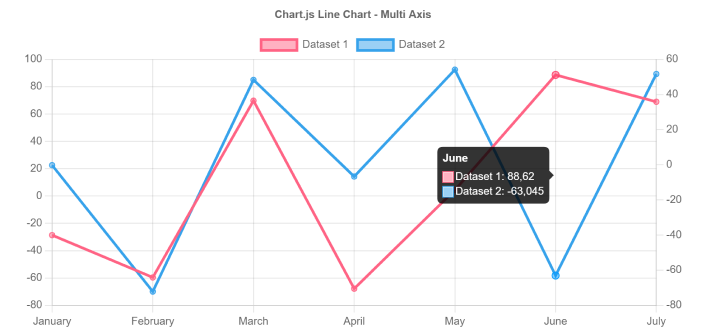
It provides clear, stylish, and captivating charts that you may easily use in your application. It offers nine different chart types, which are all, by default, adaptive and accessible. Plus, it features labels, legends, hover pop-ups, and series toggling that are all customizable. This library could be great for you if you regularly deal with large datasets.
Highcharts
Highcharts is a library for creating charts written in JavaScript, which makes it easy to add interactive, animated charts to a website or web application. At the moment, charts support a large number of linear, circular, column scattering charts and many other types.
FusionCharts
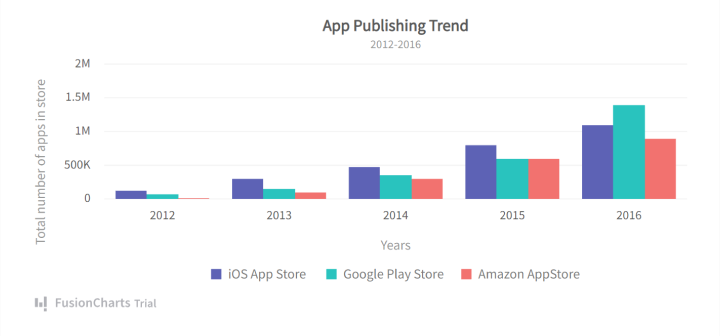
FusionCharts is another good library for building interactive graphs and charts, with hundreds of ready-made examples. Graphs from FusionCharts support data in both JSON and XML formats. Thanks to the ready-to-use chart examples, industry-specific dashboards, and even data stories that are available with source code, you can start using it right away.
Conclusion
Given how crucial data visualization is for web applications, JavaScript data visualization frameworks often have too many options. Choosing the perfect one depends on how well it integrates with your specific application and your intended use case.
Opinions expressed by DZone contributors are their own.
Comments