DZone
Thanks for visiting DZone today,
Edit Profile
  • Manage Email Subscriptions
  • How to Post to DZone
  • Article Submission Guidelines
Sign Out View Profile
  • Post an Article
  • Manage My Drafts
Over 2 million developers have joined DZone.
Log In / Join
Refcards Trend Reports
Events Video Library
Refcards
Trend Reports

Events

View Events Video Library

Trending

  • AI Agents in Java: Architecting Intelligent Health Data Systems
  • Why Your DLP Policies Fall Short the Moment AI Agents Enter the Picture
  • AI Paradigm Shift: Analytics Without SQL
  • What Is Plagiarism? How to Avoid It and Cite Sources

5 Steps to Regression Analysis [Infographic]

In this infographic, learn how you can quickly perform regression analysis in five easy-to-follow steps.

By 
Sunil Kappal user avatar
Sunil Kappal
·
Apr. 29, 18 · Presentation
Likes (2)
Comment
Save
Tweet
Share
7.9K Views

Join the DZone community and get the full member experience.
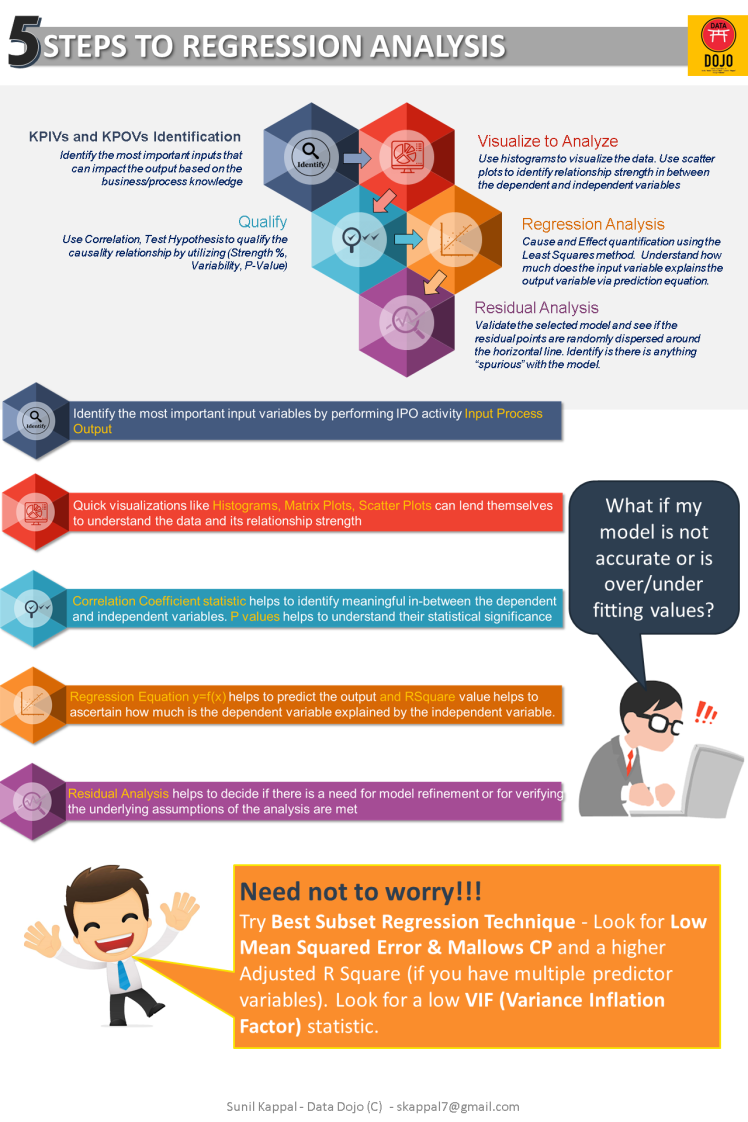
Join For Free

Here is a quick and crisp infographic that shows how to perform regression analysis in five easy-to-follow steps. 

Image title

Infographic

Published at DZone with permission of Sunil Kappal. See the original article here.

Opinions expressed by DZone contributors are their own.

Partner Resources

×

Comments

The likes didn't load as expected. Please refresh the page and try again.

  • RSS
  • X
  • Facebook

ABOUT US

  • About DZone
  • Support and feedback
  • Community research

ADVERTISE

  • Advertise with DZone

CONTRIBUTE ON DZONE

  • Article Submission Guidelines
  • Become a Contributor
  • Core Program
  • Visit the Writers' Zone

LEGAL

  • Terms of Service
  • Privacy Policy

CONTACT US

  • 3343 Perimeter Hill Drive
  • Suite 215
  • Nashville, TN 37211
  • [email protected]

Let's be friends:

  • RSS
  • X
  • Facebook