A Step-by-Step Debugger for JMeter: It’s Not a Dream Anymore
Check out this thorough review of the features of JMeter's step-by-step debugger.
Join the DZone community and get the full member experience.
Join For FreeWe’ve covered various ways to debug scripts in JMeter, but now you have the ability to debug scripts step-by-step and receive updates in real time. Here’s how.
Exit Complexity, Enter Simplicity
When I started to work with JMeter to create scripts, I was (as I’m sure we all do) feeling like debugging my scripts was way too cumbersome a process. By using the Debug Sampler and log() functions, it really felt like the old mainframe debugging days.
I wished we could just have a normal step-by-step debug, just like any normal IDE (integrated development environment), to debug my scripts and find issues.
Now, because of BlazeMeter, that day has finally come. BlazeMeter has created a step-by-step debugger, and here is how to get it:
By using the Plugin Manager (you don’t have it yet ?!) you can get the step-by-step debugger with just four easy steps:
- Open JMeter and go to the Options->Plugin Manager
- Switch to “Available Plugins” tab
- Select the “BlazeMeter Step-by-Step Debugger”
- Click “Apply Changes and Restart JMeter”
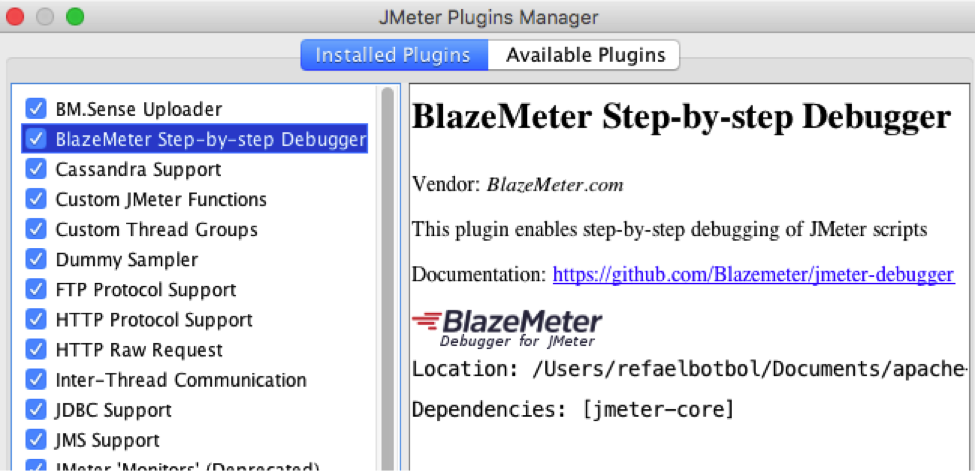
Once JMeter will relaunch itself, you should see the debugger plugin under “Installed plugins”.
Now, let’s go for a short tour to use it. For that, I’ve prepared a JMX file (attached) as an example in order to show you how to use the debugger features.
Features of the Step-by-Step JMeter Debugger
Feature 1: Running your Script Using the Debugger
- Go to Run-> Step by Step Debugger
- Maximize the pop-up window and click the “Start” button at the upper right corner
- You probably noticed that:
- Sample #1 is highlighted in Blue
- General Constant Timer is now in focus
This is because the debugger follows the JMeter scoping rules, which means execute the timer and then execute the sample. The debugger will always focus on the next element to be executed.
Feature 2: Step by Step: Let’s See These Variables!
- Press the “Step Over” button
- You probably noticed that the focus just switched to Sampler #1
- By pressing another “Step Over”, you will move to the Regular Expression execution
- Another “Step Over” will bring us to the “View Results Tree”
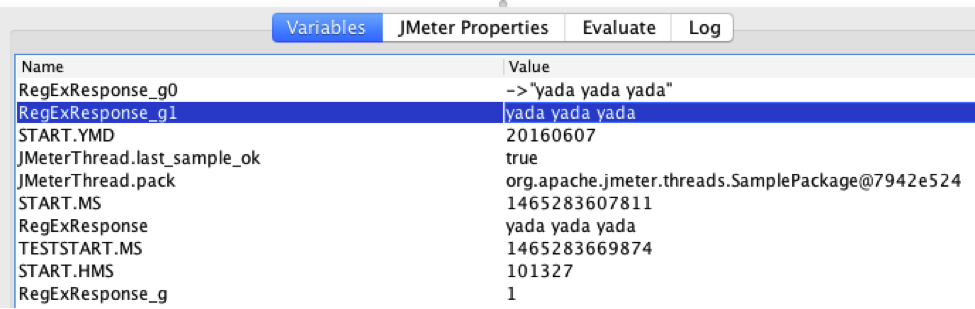
- Since the RegEx has been evaluated, you can see in the Variables tab that “RegExResponse” is now containing the string yada yada yada
Feature 3: Stop Before and After Listener Executions
You might be wondering what will happen in the next “Step Over”. Let’s find out.
Click it again.
You might have noticed that we are still in the “View Results Tree” listener even though it has been executed. Why?
Well, it’s not a bug. We just figured out that you will probably want to see the results before moving to the next element. So we might not want to switch the focus to sample #2 just yet.
Fun, ha… :)
(We would also remove any disabled elements—just to make your script cleaner while you debug it.)
Feature 4: Breakpoints
Just like any other IDE, we have breakpoints, just to save you gazillions of “Step Over” clicks. Let’s put a breakpoint on “Sample #2” by right clicking on it and select “breakpoint”. Then close and reopen the debugger, and then click on the “Continue” button. The debugger has stopped at Sample #2, just before it’s starting to execute its scope.
Feature 5: Evaluate Things on the Fly
You know the feeling when you want to see the value of a variable/function and monitor when it has been changed? Meet the Evaluate tab.
- Let’s restart the debugger from scratch and put a breakpoint on the RegEx2 element (under sample #2)
- Now before pressing “Continue”, let’s go to the Evaluate tab and put our #RegEx variable name (RegExTimestamp) in the JMeter expression line.
- Press “Continue” and wait for the debugger to stop before executing the RegEx
- You may notice that the value of the JMeter expression ${RegExTimestamp} is the string ${RegExTimestamp}. This is because JMeter has yet to initialize that parameter
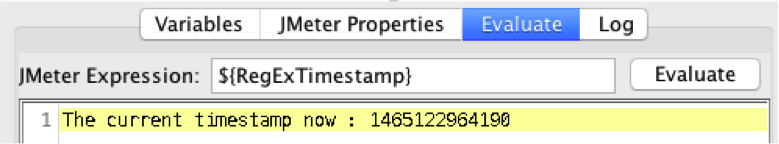
- By pressing “Step Over”, you will cause JMeter to initiate this JMeter variable and now the Evaluate tab will show the variable value (see image below)
- You can use the “Step Over” over and over and on each time, the debugger will reevaluate that string for you
Next Steps / On Our Roadmap
- We are going to add a stop button so you won’t need to close the debugger to restart your debugging session.
- We are also going to mark any variable which just changed in Bold so it will be easier to recognize which variable just changed.
- Improving the breakpoints stop on scope (and not the sampler).
- Keyboard shortcut to open the debugger (we will do our best :) ).
To conclude - the Step-by-Step debugger is a significant tool which every JMeter scripter should have in their toolbox. In addition to debugging your scripts, you can also understand how JMeter scoping works and see, for the first time, the execution order of your test plan.
Published at DZone with permission of Refael Botbol. See the original article here.
Opinions expressed by DZone contributors are their own.
Comments