Adding SVGs to PDFs With Python and ReportLab
Adding graphics into PDFs programmatically has never been easier! Read on to check out how to do it using Python in this post!
Join the DZone community and get the full member experience.
Join For Freereportlab has native support for generating svg, but not for embedding svgs in their pdfs. fortunately, dinu gherman created the svglib package, a pure-python package that can read svg files and convert them to other formats that reportlab can use. the official website for svglib is on github .
the svglib package will work on linux, mac os, and windows. the website states that it works with python 2.7 – 3.5, but it should work in newer versions of python as well.
you can use svglib to read your existing svg files and convert them into reportlab drawing objects. the svglib package also has a command-line tool, svg2pdf , that can convert svg files to pdfs.
dependencies
the svglib package depends on reportlab and lxml . you can install both of these packages using pip:
pip install reportlab lxmlinstallation
the svglib package can be installed using one of three methods.
install the latest release
if you’d like to install the latest release from the python packaging index, then you can just use pip the normal way:
pip install svglibinstall from latest version from source control
on the off chance that you want to use the latest version of the code (i.e. the bleeding edge/alpha builds), then you can install directly from github using pip like this:
pip install git+https://github.com/deeplook/svglibmanual installation
most of the time, using pip is the way to go. but you can also download the tarball from the python packaging index and do all the steps that pip does for you automatically if you want to. just run the following three commands in your terminal in order:
tar xfz svglib-0.8.1.tar.gz
cd svglib-0.8.1
python setup.py install
now that we have svglib installed, let’s learn how to use it!
usage
using svglib with reportlab is actually quite easy. all you need to do is import svg2rlg from svglib.svglib and give it the path to your svg file. let’s take a look:
# svg_demo.py

from reportlab.graphics import renderpdf, renderpm
from svglib.svglib import svg2rlg


def svg_demo(image_path, output_path):
    drawing = svg2rlg(image_path)
    renderpdf.drawtofile(drawing, output_path)
    renderpm.drawtofile(drawing, 'svg_demo.png', 'png')


if __name__ == '__main__':
    svg_demo('snakehead.svg', 'svg_demo.pdf')
after giving svg2rlg your path to the svg file, it will return a drawing object. then you can use this object to write it out as a pdf or a png. you could go on to use this script to create your own personal svg to png converting utility!
drawing on the canvas
personally, i don’t like to create one-off pdfs with just an image in them like in the previous example. instead, i want to be able to insert the image and write out text and other things. fortunately, you can do this very easily by painting your canvas with the drawing object. here’s an example:
# svg_on_canvas.py

from reportlab.graphics import renderpdf
from reportlab.pdfgen import canvas
from svglib.svglib import svg2rlg

def add_image(image_path):
    my_canvas = canvas.canvas('svg_on_canvas.pdf')
    drawing = svg2rlg(image_path)
    renderpdf.draw(drawing, my_canvas, 0, 40)
    my_canvas.drawstring(50, 30, 'my svg image')
    my_canvas.save()

if __name__ == '__main__':
    image_path = 'snakehead.svg'
    add_image(image_path)
here we create a canvas.canvas object and then create our svg drawing object. now you can use renderpdf.draw to draw your drawing on your canvas at a specific x/y coordinate. we go ahead and draw out some small text underneath our image and then save it off. the result should look something like this:
adding an svg to a flowable
drawings in reportlab can usually be added as a list of flowables and built with a document template. the svglib’s website says that its drawing objects are compatible with reportlab’s flowable system. let’s use a different svg for this example. we will be using the flag of cuba from wikipedia. the svglib tests download a bunch of flag svgs in their tests, so we will try one of the images that they use. you can get it here:
https://upload.wikimedia.org/wikipedia/commons/b/bd/flag_of_cuba.svg
once you have the image saved off, we can take a look at the code:
# svg_demo2.py

import os

from reportlab.graphics import renderpdf, renderpm
from reportlab.platypus import simpledoctemplate
from svglib.svglib import svg2rlg


def svg_demo(image_path, output_path):
    drawing = svg2rlg(image_path)

    doc = simpledoctemplate(output_path)

    story = []
    story.append(drawing)

    doc.build(story)

if __name__ == '__main__':
    svg_demo('flag_of_cuba.svg', 'svg_demo2.pdf')
this worked pretty well, although the flag is cut off on the right side. here’s the output:

i actually had some trouble with this example. reportlab or svglib seems to be really picky about the way the svg is formatted or its size. depending on the svg i used, i would end up with an attributeerror or a blank document or i would be successful. so your mileage will probably vary. i will say that i spoke with some of the core developers and they mentioned that **simpledoctemplate** doesn’t give you enough control over the frame that the drawing goes into, so you may need to create your own frame or pagetemplate to make the svg show up correctly. a workaround to get the snakehead.svg to work was to set the left and right margins to zero:
# svg_demo3.py

from reportlab.platypus import simpledoctemplate
from svglib.svglib import svg2rlg


def svg_demo(image_path, output_path):
    drawing = svg2rlg(image_path)

    doc = simpledoctemplate(output_path,
                            rightmargin=0,
                            leftmargin=0)

    story = []
    story.append(drawing)

    doc.build(story)

if __name__ == '__main__':
    svg_demo('snakehead.svg', 'svg_demo3.pdf')
scaling svgs in reportlab
the svg drawings you create with svglib are not scaled by default. so you will need to write a function to do that for you. let’s take a look:
# svg_scaled_on_canvas.py

from reportlab.graphics import renderpdf
from reportlab.pdfgen import canvas
from svglib.svglib import svg2rlg


def scale(drawing, scaling_factor):
    """
    scale a reportlab.graphics.shapes.drawing()
    object while maintaining the aspect ratio
    """
    scaling_x = scaling_factor
    scaling_y = scaling_factor

    drawing.width = drawing.minwidth() * scaling_x
    drawing.height = drawing.height * scaling_y
    drawing.scale(scaling_x, scaling_y)
    return drawing


def add_image(image_path, scaling_factor):
    my_canvas = canvas.canvas('svg_scaled_on_canvas.pdf')
    drawing = svg2rlg(image_path)
    scaled_drawing = scale(drawing, scaling_factor=scaling_factor)
    renderpdf.draw(scaled_drawing, my_canvas, 0, 40)
    my_canvas.drawstring(50, 30, 'my svg image')
    my_canvas.save()

if __name__ == '__main__':
    image_path = 'snakehead.svg'
    add_image(image_path, scaling_factor=0.5)
here we have two functions. the first function will scale our image using a scaling factor. in this case, we use 0.5 as our scaling factor. then we do some math against our drawing object and tell it to scale itself. finally, we draw it back out in much the same way as we did in the previous example.
here is the result:

using svg plots from matplotlib in reportlab
in a previous article , we learned how to create graphs using just the reportlab toolkit. one of the most popular 2d graphing packages for python is matplotlib though. you can read all about matplotlib here: https://matplotlib.org/ . the reason i am mentioning matplotlib in this article is that it supports svg as one of its output formats. so we will look at how to take a plot created with matplotlib and insert it into reportlab.
to install matplotlib, the most popular method is to use pip:
pip install matplotlibnow that we have matplotlib installed, we can create a simple plot and export it as svg. let’s see how this works:
import matplotlib.pyplot as pyplot
def create_matplotlib_svg(plot_path):
pyplot.plot(list(range(5)))
pyplot.title = 'matplotlib svg + reportlab'
pyplot.ylabel = 'increasing numbers'
pyplot.savefig(plot_path, format='svg')
if __name__ == '__main__':
from svg_demo import svg_demo
svg_path = 'matplot.svg'
create_matplotlib_svg(svg_path)
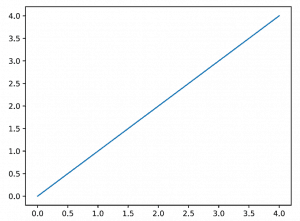
svg_demo(svg_path, 'matplot.pdf')in this code, we import the pyplot sub-library from matplotlib. next, we create a simple function that takes the path to where we want to save our plot. for this simple plot, we create a simple range of five numbers for one of the axes. then we add a title and a y-label. finally, we save the plot to disk as an svg.
the last step is in the if statement at the bottom of the code. here we import our svg_demo code from earlier in this article. we create our svg image and then we run it through our demo code to turn it into a pdf.
the result looks like this:
using svg2pdf
when you install svglib, you also get a command line tool called svg2pdf . as the name implies, you can use this tool to convert svg files to pdf files. let’s look at a couple of examples:
svg2pdf /path/to/plot.svgthis command just takes the path to the svg file that you want to turn into a pdf. it will automatically rename the output to the same name as the input file, but with the pdf extension. you can specify the output name though:
svg2pdf -o /path/to/output.pdf /path/to/plot.svg
the
-o
flag tells svg2pdf requires that you pass in the output pdf path followed by the input svg path.
the documentation also mentions that you can convert all the svg files to pdfs using a command like the following:
svg2pdf -o "%(base)s.pdf" path/to/file*.svgthis will rename the output pdf to the same name as the input svg file for each svg file in the specified folder.
wrapping up
the svglib is the primary method to add svgs to reportlab at the time of writing this post. while it isn’t full featured, it works pretty well and the api is quite nice. we also learned how to insert a plot svg created via the popular matplotlib package. finally, we looked at how to turn svgs to pdfs using the svg2pdf command line tool.
related reading
- a simple step-by-step reportlab tutorial
- reportlab 101: the textobject
- reportlab – how to add charts and graphs
- extracting pdf metadata and text with python
Published at DZone with permission of Mike Driscoll. See the original article here.
Opinions expressed by DZone contributors are their own.
Comments