

Beyond the Wall of Charts: How Advanced Observability Displaced the Telemetry Dashboard
Architectural shift from traditional human-curated dashboards to autonomous, context-aware AI systems and unified data lakes.
 ·
Join the DZone community and get the full member experience.
Join For FreeFor the past decade, the gold standard of Site Reliability Engineering (SRE) was "all your telemetry in one place, beautifully rendered." Centralized platforms allowed teams to build massive grids of charts tracking CPU usage, memory allocation, request latencies, and error rates. Yet this approach masks a critical flaw: traditional dashboards show only symptoms, forcing humans to act as data archaeologists to find the root cause.
With microservices handling highly distributed workloads, a simple user request might cross a dozen internal boundaries. When latency spikes, a static dashboard tells you what is broken, but it cannot tell you why. The modern engineering directive has fundamentally shifted from reactive visibility to deep system understanding.
The conventional approach of isolating metrics, logs, and traces into discrete dashboard tabs or separate tools has broken down under cloud-native complexity:
- The Contextual Chasm: When an alert fires, engineers are forced to pivot between systems, manually trying to correlate a metric spike in one graph with a raw text error in a log file. This manual synchronization creates a high mean time to resolution (MTTR).
- Pre-Aggregation Destruction: Traditional monitoring relies on pre-aggregated data averages to control cloud storage costs. This destroys fine-grained details, making it impractical to debug highly specific "unknown-unknown" incidents affecting rare user cohorts.
- Anticipation Bias: Dashboards assume that a software engineering team can accurately predict every failure mode ahead of time to build a chart for it. Complex systems fail in entirely unpredictable ways that static, predefined views cannot capture.
The Observability Revolution: Core Paradigms Replacing the Dashboard
Rather than forcing engineers to stare at screens waiting for a line to turn red, modern observability treats system telemetry as a unified, exploratory analytics problem:
- High-Cardinality Unified Data Layers: Modern architectures store unaggregated, raw event streams. By preserving trace IDs, customer IDs, and container headers, engines can instantly pinpoint the precise thread or database index responsible for a system failure.
- Contextual Topology and Causality: Advanced systems continuously map software dependencies and traffic patterns. Instead of sending a dozen isolated alert notifications, the system assembles an incident narrative, proving how a configuration drift upstream actively broke a payment processing gate downstream.
- Agentic AI Remediation: The industry is moving from monitoring toward autonomous operations. Specialized AI agents consume telemetry streams directly to execute preventative actions like scaling production clusters or rolling back buggy code deployments.
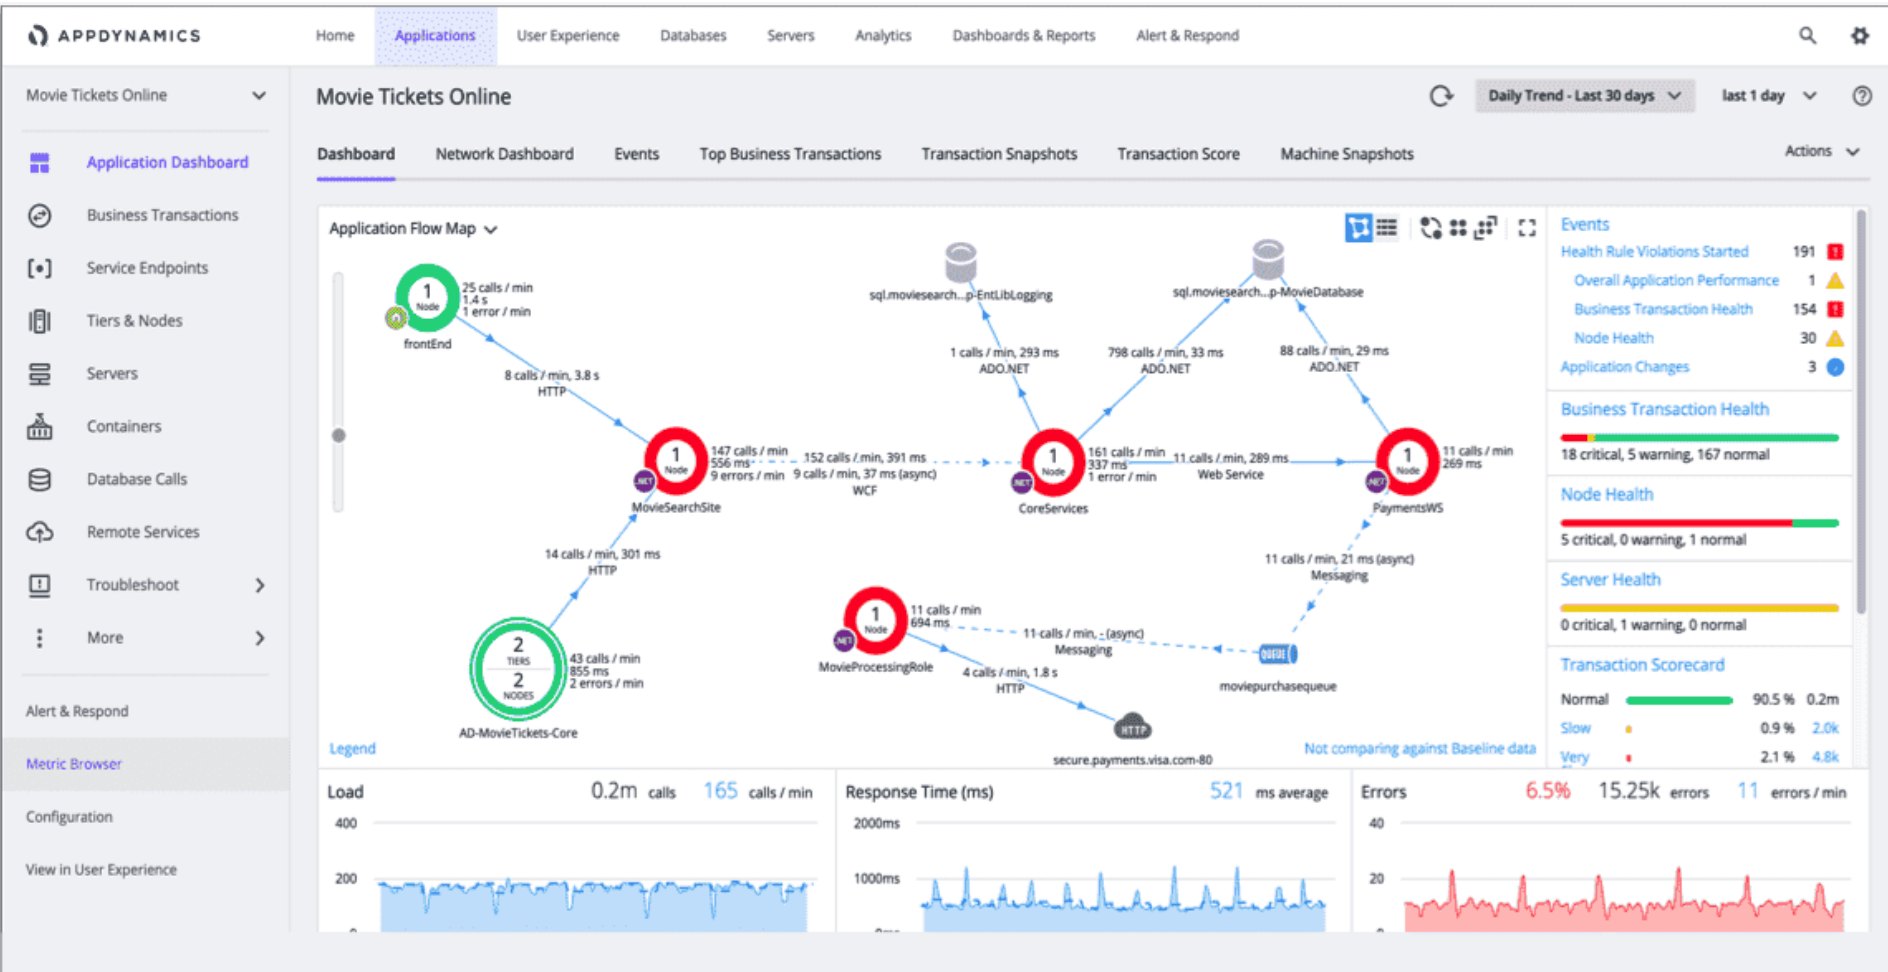
The traditional dashboard view: application health, load, response times, and error rates show that something is wrong, but not why. The engineer still has to hunt for the cause.
The high-cardinality view: instead of scanning charts, the failing dimension is isolated directly — here, errors tied to a specific service version (v350.10) and HTTP 401 status — pointing straight at the root cause.
Adapting to the Age of Non-Deterministic Infrastructure
The massive expansion of large language model (LLM) agents and generative software layers has further accelerated the demise of legacy dashboards. Traditional systems check whether an API endpoint returns a 200 OK HTTP status code.
An AI-driven microservice can operate perfectly within technical boundaries, response times, and system limits, while still delivering entirely hallucinated or factually incorrect output to an enterprise client. Observability has adapted by monitoring semantic tokens, prompt guardrails, and vector pipeline drift, complex factors that cannot be displayed on a standard bar chart.
The metric of success for a modern technology infrastructure is no longer the number of operational dashboards under management. Success is defined by autonomous, rapid understanding and instantaneous path-to-resolution, which is why the static visual graph has been displaced as the primary debugging surface.
The Strategic Dilemma
Transitioning from static, pre-aggregated dashboards to high-cardinality observability (tracking raw, un-aggregated event data across highly granular dimensions like user_id, container_id, and ip_address) is essential for modern debugging and reducing MTTR. However, storing raw, multi-dimensional event streams exponentially inflates cloud infrastructure and data ingest costs. Without strict architectural guardrails, observability spend can grow to consume an unsustainable percentage of total cloud budgets.
The True Drivers of High-Cardinality Cost
- Exploding Volume of Unique Dimensions: Cloud-native elements (ephemeral containers, serverless functions) spin up and down constantly, generating billions of unique metric combinations that saturate traditional relational structures.
- Data Ingestion Overhead: Commercial observability vendors charge based on data volume ingested and index size, and self-hosted open-source clusters (e.g., OpenSearch, or Prometheus with Cortex/Thanos) carry the same cost pressure through the infrastructure required to store and index that volume.
- Hot Storage Reliance: Keeping raw, unaggregated logs and traces instantly queryable requires expensive, high-throughput SSD cloud storage, driving up baseline cloud infrastructure costs.
Architectural Framework for Cost Mitigation
To balance the technical necessity of high-cardinality data with strict fiscal control, tech leaders should mandate a tiered storage approach:
Implement Intelligent Data Sampling
Not all telemetry is created equal. SRE teams should configure tail-based sampling rules. For instance, store 100% of traces that result in an HTTP 5xx error or high latency, but sample only 1% to 5% of healthy, predictable HTTP 200 OK traces.
Adopt Tiered Storage Horizons
- Hot Tier (0–7 Days): Keep full, high-cardinality raw telemetry in expensive, high-performance storage for immediate active incident response.
- Warm Tier (8–30 Days): Move data to aggregated metrics blocks or lower-cost search-optimized tiers for historical trend analysis.
- Cold Tier (31+ Days): Compress and offload raw data into highly economical object storage (such as Amazon S3, Google Cloud Storage, or Azure Blob) strictly for long-term compliance and audit requirements.
Tiered storage keeps high-cardinality observability affordable: recent data stays hot for fast incident response, then ages into progressively cheaper, slower storage for trend analysis and compliance.
Enforce Strict Lifecycle Policies. Automate the purging or down-sampling of high-cardinality dimensions as data ages. A specific container ID from three weeks ago holds little operational value for daily SRE workflows.
Verdict
Do not scale back observability goals to save on infrastructure bills. Instead, optimize how and where that telemetry lives. By implementing data sampling at ingestion and automated lifecycle workflows, organizations can unlock the full power of high-cardinality root-cause analysis while keeping data storage costs linear and predictable.
Opinions expressed by DZone contributors are their own.
Comments