Agentic AI Has an Observability Blind Spot Nobody Is Talking About
Production AI agents can trigger cascading failures when observability tracks what broke, but not whether the system can safely absorb remediation actions.
Join the DZone community and get the full member experience.
Join For FreeHere is what a production cascade looks like when nobody did anything wrong.
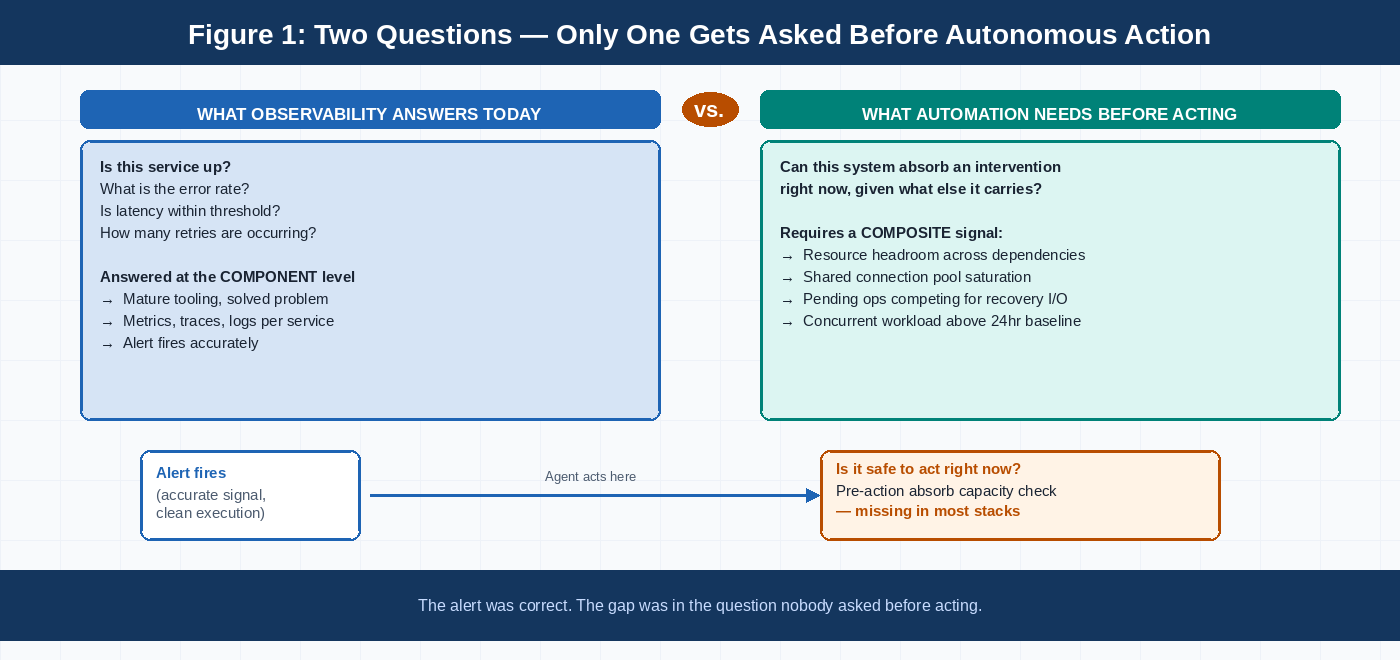
An alert fires on a microservice showing elevated latency. The signal is accurate. The automated remediation agent picks it up immediately and does exactly what it was built to do: restart the affected service and reroute traffic. The action is within scope, the credentials are valid, and three seconds later, the platform reports a successful remediation.
Then, four dependent services go dark.
The postmortem will call it a cascade. The dashboard will show a clean execution on the first incident and a second incident opening 90 seconds later. Nobody will find an error log on the remediation itself because there was none. The agent was not wrong. The action was technically correct. What nobody had built was the ability to ask: given what the system is carrying right now, is this the moment to add more disruption to it?
That is not a monitoring gap. Monitoring told everyone exactly what was broken. It is an observability architecture gap — the difference between knowing what is failing and knowing whether the system can safely absorb what you are about to do to fix it.
The Failure Pattern Is More Consistent Than Teams Expect
I ran into this structurally while doing chaos engineering on enterprise SD-WAN infrastructure at Cisco. We were running experiments against production-grade environments across large financial services and telecom customers, and standard chaos tooling kept finding the wrong failures. It was injecting faults into systems whose state had already shifted past the parameters we had set at the start of the experiment. The faults that caused real damage were the ones that chained with conditions already present in the environment — elevated resource utilization, two services over, a background process that had been running for 45 minutes, consuming memory that a restarted service needed, a connection pool sitting at 89 percent because of an unrelated batch job.
None of those conditions was hidden. Everyone was instrumented. The problem was that nobody was reading them together as a composite signal before deciding how hard to push the system. We were answering the wrong question.
We built a methodology to fix it. Instead of setting static experiment parameters, the engine reads live telemetry before each iteration, derives from that telemetry the system's current capacity to absorb perturbation, and calibrates the intervention intensity accordingly. A feedback loop between the actual impact and the intended impact across successive iterations finds the behavioral boundary without disabling the environment. That methodology became USPTO Patent No. US12242370B2.
Patent: https://patents.google.com/patent/US12242370B2/en
What we built for SD-WAN infrastructure is the same thing agentic AI deployments need now. The underlying problem is identical: an automated actor is making decisions about whether and how to intervene in a live system, using a signal that accurately describes what is broken but says nothing about what the system can safely absorb in the moment the decision is made.
Why AWS FIS and Gremlin Will Not Find This for You
Infrastructure fault injection is good at what it does. AWS FIS, Gremlin, and Chaos Toolkit test whether your Lambda survives throttling, whether the event pipeline recovers from a queue outage, and whether the hosting environment holds up under resource pressure. These are legitimate questions, and the tooling answers them well.
They just do not test the failure mode that is generating the most expensive incidents as agentic AI deployments scale. An agent's worst production failure is not a cold start timeout or a concurrency breach. It is a clean, successful invocation that executes the wrong sequence — because the combination of inputs, tool call results, and current system state put the agent at the edge of its operational envelope, and nobody built a test that ever got it there.
Air Canada's chatbot did not crash. It executed correctly in a scenario the designers never tested. No infrastructure fault injection exercise would have found that boundary because the boundary was not in the infrastructure.
The same structure shows up in autonomous remediation. The agent reads a real signal, takes a valid action within its authorized scope, and produces an outcome nobody intended because the action was correct in isolation but wrong given the composite state around it. Standard tooling reports a clean execution. The cascade shows up in the next incident ticket.
Finding the behavioral boundary requires a test methodology that reads live system state before calibrating experiment intensity — not one that applies static parameters to a system whose state has already shifted. Static parameters applied to dynamic systems find the failure modes you designed the test to find. They miss the ones that actually hurt.
Three Instrumentation Gaps to Close Before Your Agents Hold Production Credentials
These did not come from a research paper. They came from postmortems — at Cisco across financial services and telecom customers, and at Splunk across thousands of enterprise observability deployments. The same three gaps show up every time.
1. Concurrent workload state across the dependency graph, not just the service under incident.
A service restart that is safe in isolation is frequently dangerous when adjacent services are already running above their normal resource ceilings. The absorb capacity question is a system-level question, not a component-level one. Most runbooks do not include a pre-action resource check across the dependency graph of the service being touched. Automated agents have no reason to be different.
What to build: a pre-action query that checks whether any first-degree dependency of the service being remediated is above 80 percent of its 24-hour baseline utilization. One data point. It exists in most observability stacks already. It is almost never surfaced in an incident context.
2. Pending operations competing for the same recovery resources.
A recovering service needs I/O headroom during the 60 to 90 seconds after restart while it rebuilds its in-memory state. A background index rebuild consuming 30 percent of available I/O is invisible to the incident response flow because it is not itself failing. It does not show up in any alert. It shows up in the postmortem as a contributing factor.
What to build: a pre-action inventory query against active background and scheduled operations on the same infrastructure tier as the remediation target. Not continuous monitoring — just one read before acting.
3. Intervention intensity matched to current system state, not last month's playbook.
The remediation that worked last Tuesday was calibrated to last Tuesday's system state. Applying it at the same intensity to a system currently carrying three extra loads is not a reliable practice — it is reusing a number that made sense in a context that no longer exists.
Every automated remediation action should answer one question before executing: Is the system in the same absorb capacity range as when this intervention was validated? If it is not, stage the action, reduce intensity, or escalate. This is not complicated engineering. It is a check that almost nobody has built.
The automation is not the problem. The automation acting without a pre-action absorb capacity check is the problem. Building that check is a day's work. Not building it is how you get cascades that look like they came from nowhere.
"We were validating system health, not output integrity. That experience changed how we define resilience; it is no longer just about systems staying up but about systems staying correct under stress."
— John Russo, VP Healthcare Technology Solutions, OSP Labs
Which Automated Actions Need This Check and How Urgently
Not every intervention carries the same absorb capacity risk. Here is a working classification based on what I have watched produce incidents. The cluster restart and downstream workflow rows are where most of the expensive postmortems come from.
|
Intervention |
Absorb Risk |
Minimum Pre-Action Check |
Automate or Escalate |
|
Read-only diagnostics (health checks, metric queries, log pulls) |
Very Low |
None |
Fully automatable, no check needed |
|
Traffic rerouting (LB weight shifts, circuit breaker trips) |
Low to Medium |
Downstream service vs. 24hr baseline |
Automate with dependency check; escalate if downstream >75% baseline |
|
Single service restart (pod recycle, instance restart) |
Medium |
I/O headroom + active background ops on same tier |
Automate if headroom clear; escalate if background ops active |
|
Cluster-level restart (rolling or full, multiple instances) |
High |
Full dependency graph resource state + pending ops inventory |
Stage the restart; never run under pre-existing cross-service stress |
|
Config or schema change (feature flags, parameter updates) |
High to Very High |
All checks + rollback path validated |
Human review required outside the nominal absorb capacity range |
|
Agent-initiated downstream workflow (external API calls, cross-service triggers) |
Very High (often irreversible) |
Intent-execution separation + full pre-action assessment |
Human authorization unless the action is fully reversible |
Table 1: The cluster restart and downstream workflow tiers are where most production cascades originate. The check is cheap. The postmortem is not.
How to Build the Absorb Capacity Layer
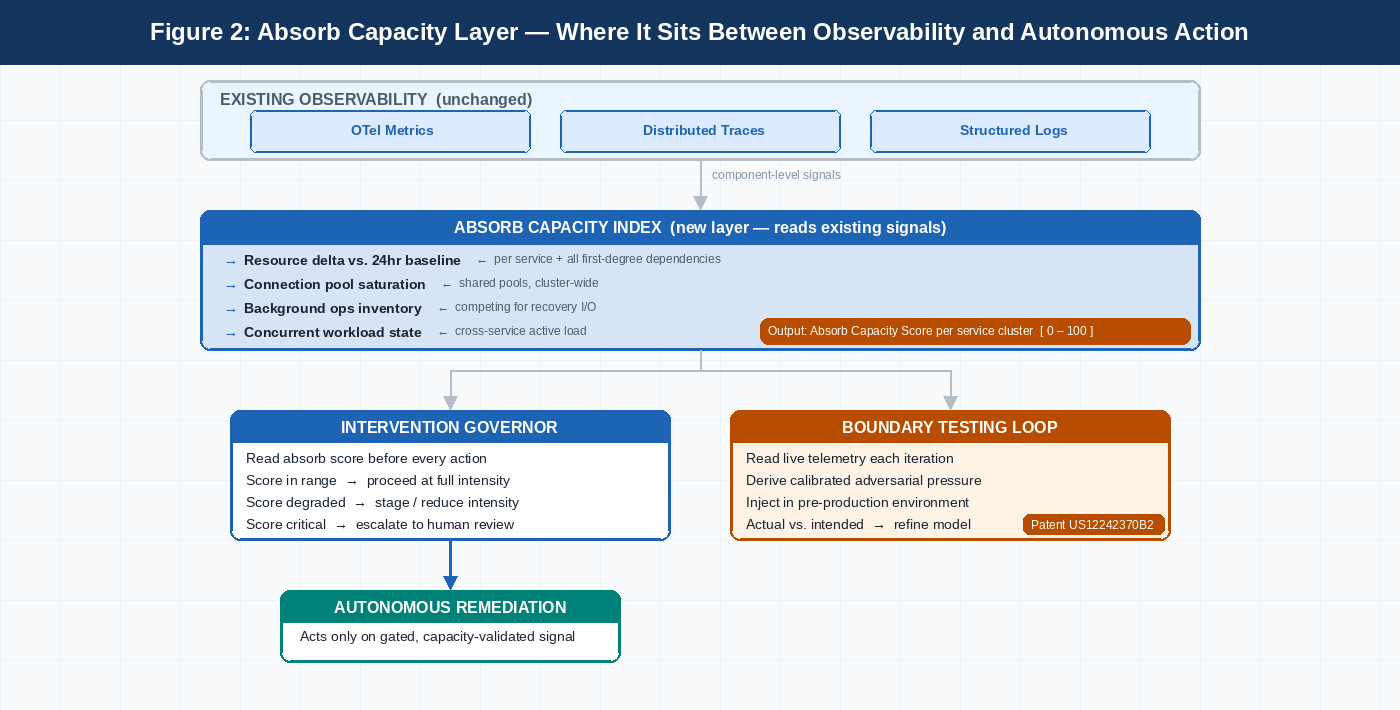
Adding absorb capacity as a first-class observable does not mean replacing what you have. Your existing metrics, traces, and logs are doing their job. The gap is not in those signals — it is in the layer that reads them together and produces a single pre-action number before any automated intervention fires.
The architecture has three parts.
- First, a live absorb capacity index: a rolling calculation across the dependency graph of each critical service, reading resource utilization deltas against the 24-hour baseline, shared connection pool saturation, active background operation inventory, and concurrent workload state. Output is a single number per service cluster — current absorb capacity as a percentage of the validated intervention tolerance.
- Second, an intervention intensity governor that reads that number before any automated remediation executes. If the index is within range, the action proceeds. If not, the governor selects a reduced-intensity variant, stages the action, or sends it to human review. It does not touch the remediation logic. It gates execution.
- Third, a behavioral boundary testing loop adapted from the intent-based chaos engineering methodology in Patent US12242370B2. Periodic pre-production tests read live telemetry, derive calibrated adversarial pressure from the current absorb capacity model, and use an actual-versus-intended impact feedback loop to keep the model current. Without this loop, the pre-action check is comparing today's system state against a capacity model that was valid when you built it six months ago.
The Check That Almost Nobody Has Built
Most teams I have worked with have good observability. The signals are there. The alerting is tuned. The dashboards show what is failing in real time. What they have not built is the layer that reads all of it together and answers a different question: not what is broken, but whether the system is in a state that can take what you are about to do to it.
Autonomous remediation agents and agentic AI systems make that question urgent in a way it was not when the decision-maker was a human engineer with pattern recognition built over years. The human hesitated. They glanced at adjacent services. They asked the on-call SRE if anything else was running before they pushed the big red button. The agent does not hesitate. It reads the signal, acts within scope, and files the result as success.
RL-calibrated infrastructure failures are recoverable. A cluster goes down, the runbook fires, the service comes back. Behavioral failures in systems with real external side effects — agents that trigger downstream workflows, confirm transactions, modify records across services — are not always recoverable in the same way. The damage lands in external systems before any alert fires.
Adding absorb capacity as a first-class observable is not a large infrastructure project. The signals you need are already in your stack. The composite read, the pre-action check, the governor that gates execution — none of this requires new technology. It requires deciding to ask the right question before the agent acts, and building the thin layer that makes that question answerable in real time.
The observability you have is telling the truth. It is just not telling the whole truth yet.
Published at DZone with permission of Sayali Patil. See the original article here.
Opinions expressed by DZone contributors are their own.
Comments