

AI Model Evaluation: Metrics, Visualization and Performance (2 of 3)
Evaluate AI models using key metrics and visualization tools to ensure fairness, reliability and scalability in real-world applications.
 CORE
·
An Artificial Intelligence (AI) model, despite going through constant and rigorous training, may not function as intended. It is important to observe strict and continuous evaluations to measure its accuracy and reliability in real-world applications. Assessing key metrics such as precision, recall, and F1-score allows the AI model to apply its learned patterns across different datasets successfully. Without sufficient evaluation, even advanced AI models may not reach their full potential.
The effectiveness of an AI model is evaluated through a combination of measurement techniques, visual representation, and analysis of failures. These include the following:
-
Using different sets of performance metrics for evaluation.
-
Specific investigation techniques for result analysis.
-
Employing strategies to improve model performance.
Why is Performance Analysis Important?
AI systems must demonstrate exceptional performance while efficiently handling both training data and new, unseen data. Poor performance can lead to several issues:
-
Memorization: A model that simply memorizes its training data may fail to recognize real-world inputs during deployment.
-
Oversimplification: When modeling processes, the machine learning (ML) system might become too basic to identify the underlying patterns in the data.
-
Bias: During operation, the system may exhibit preference towards certain classes, neglecting others.
Performance evaluation improves AI models while ensuring accurate and reliable results in AI applications.
Key performance Metrics for AI Models
The performance metrics vary depending on the type of model used, whether it's for classification, regression, or clustering.
Accuracy
The percentage correctly classified models:
Accuracy = Total Predictions/Correct Predictions × 100
Example:
from sklearn.metrics import accuracy_score

y_true = [1, 0, 1, 1, 0, 1]  # Actual labels
y_pred = [1, 0, 1, 0, 0, 1]  # Predicted labels

accuracy = accuracy_score(y_true, y_pred)

print(f'Accuracy: {accuracy * 100:.2f}%')
Limitations:
The measurement of accuracy becomes false because unbalanced data sets exist. A model with high accuracy becomes ineffective when it continually predicts a particular class, which exists in 95% of the samples.
Precision, Recall, and F1-Score
Particular evaluation metrics deliver useful insights when datasets have uneven class distributions such as fraud prevention and health diagnosis systems.
-
Through precision metric we measure the correct positive predictions among all proposed cases.
-
The recall metric detects the number of real positive classifications your model actually produces.
-
The measurement of F1-Score provides a balanced average between precision and recall values through harmonic calculation.
F1-Score = 2× Precision + Recall/ Precision × Recall
Example:
from sklearn.metrics import precision_score, recall_score, f1_score

precision = precision_score(y_true, y_pred)
recall = recall_score(y_true, y_pred)
f1 = f1_score(y_true, y_pred)

print(f'Precision: {precision:.2f}, Recall: {recall:.2f}, F1-Score: {f1:.2f}')
Performance Metrics for Regression Models
Regression models produce predictions of continuous values, which include housing prices and stock market values. Common metrics include:
-
Mean Absolute Error (MAE): Calculates the average of absolute value differences that exist between actual results and prediction outcomes.
-
Mean Squared Error (MSE): Flags larger errors compared to MAE.
-
The R² Score (Coefficient of Determination): Functions to determine the extent to which the model explains data variations.
Example in Python :
from sklearn.metrics import mean_absolute_error, mean_squared_error, r2_score

y_true = [3, -0.5, 2, 7]
y_pred = [2.5, 0.0, 2, 8]


mae = mean_absolute_error(y_true, y_pred)
mse = mean_squared_error(y_true, y_pred)
r2 = r2_score(y_true, y_pred)

print(f'MAE: {mae:.2f}, MSE: {mse:.2f}, R² Score: {r2:.2f}')
Visualization Techniques for Model Performance
Understanding model errors is possible through visual evaluation, which improves the prediction accuracy.
Confusion Matrix (For Classification Models)
The confusion matrix method displays precise outcomes of correct and incorrect predictions for all classes present in a classification system after matrix analysis.
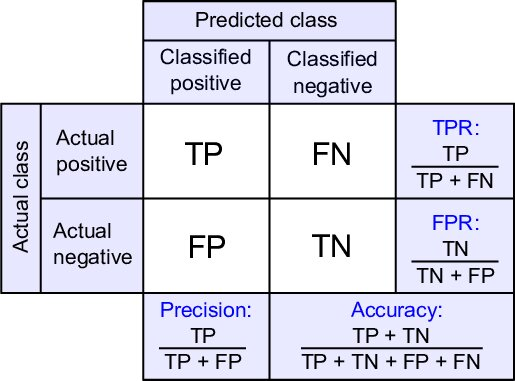
The confusion matrix operates as a vital instrument to evaluate AI models particularly when used in machine learning and deep learning environments. The analysis allows both misclassification patterns identification and effective model evaluation that leads to targeted improvements. The number of true positives, false positives, true negatives, and false negatives can all be checked to improve the predictability, accuracy, and dependability of a model.
from sklearn.metrics import confusion_matrix

import seaborn as sns
import matplotlib.pyplot as plt

cm = confusion_matrix(y_true, y_pred)
sns.heatmap(cm, annot=True, fmt='d', cmap='Blues')

plt.xlabel('Predicted')
plt.ylabel('Actual')
plt.show()
ROC Curve and AUC Score
Models determine their interclass discrimination capacity through the ROC curve.
from sklearn.metrics import roc_curve, auc

y_prob = [0.8, 0.2, 0.7, 0.1, 0.3, 0.9]  # Probabilities assigned by the model
fpr, tpr = roc_curve(y_true, y_prob)
auc_score = auc(fpr, tpr)

plt.plot(fpr, tpr, label=f'AUC = {auc_score:.2f}')
plt.xlabel('False Positive Rate')
plt.ylabel('True Positive Rate')
plt.legend()
plt.show()
Error Analysis and Model Improvement
Checking for Data Bias
Model performance issues on particular classes should lead to investigations regarding dataset bias problems. A set of procedures for distribution balancing enables correct implementation or weighted loss functions help correct such problems.
class_weights = {0: 1.0, 1: 3.0}  # Give more weight to minority class
model.fit(X_train, y_train, class_weight=class_weights)
Hyperparameter Tuning
The best settings should be discovered through Random Search or Grid Search methods.
from sklearn.model_selection import GridSearchCV
from sklearn.ensemble import RandomForestClassifier

param_grid = {'n_estimators': [50, 100, 200], 'max_depth': [None, 10, 20]}
grid = GridSearchCV(RandomForestClassifier(), param_grid, scoring='accuracy')
grid.fit(X_train, y_train)

print(grid.best_params_)
Hardware and software tools should be analyzed to achieve strong performance within AI models. The addition of proper metrics together with visualization tools and error analysis help in boosting model reliability while improving accuracy.
Conclusion
To ensure accuracy, reliability, and relevance in practical applications, AI model assessment is essential. The usage of key metrics such as precision, recall, F1-score, and regression metrics like MAE and R² Score help guarantee that performance metrics are evaluated.
Confusion matrices and ROC curves, both visualization techniques, can be used to easily interpret how your model is performing. Bias detection, class balancing, and hyperparameter tuning have also demonstrated success in result optimization. With these methods, AI models can achieve higher efficiency, fairness, and scalability, providing credible and unbiased results in applied scenarios.
In the final part of this series, you will learn more about how you can optimize an AI model using data preprocessing, algorithmic improvements, hyperparameter tuning, hardware acceleration, and deployment strategies. Meanwhile, if you want to create your first AI model, here's our quick guide: "Build Your First AI Model in Python: A Beginner's Guide (1 of 3)."
Opinions expressed by DZone contributors are their own.