Amazon ECS Log Analysis (Part 1)
Learn how to use Logz.io's ELK Stack to tackle the challenge of logging your ECS. See how you can mold and shape that data into dashboards and more.
Join the DZone community and get the full member experience.
Join For Free
amazon ec2 container service (amazon ecs) is a management service for running, stopping, and managing docker containers on top of ec2 servers. these containers run on a cluster of ec2 instances, with ecs handling the automation side of things — the installation and operation of the underlying infrastructure.
all of the familiar amazon services such as iam, elb, vpc, and auto scaling can be used with these containers — making it a good solution for managing a containerized app that is scalable and robust enough to handle heavy loads.
security for docker containers is a touchy issue and is still very much a work-in-progress. there are a number of ways that ecs can help to alleviate the security issue. vpc and iam are two examples of how to limit access to the docker containers and their resources.
logging is another aspect that makes using ecs for managing containers a safe option. ecs is also integrated with cloudtrail, so you can track all of the api calls made by ecs (both by the ecs console and the ecs api) and ship the resulting logs into s3 ( here’s a list of the api calls tracked ). these logs will provide you with information on the type of request made to ecs, the ip making the request, who made it and when, and more. all of this information important when you are auditing your system and compliance standards.
this article describes how to use the logz.io elk stack to log ecs. we will be establishing a pipeline of logs from ecs to cloudtrail and from cloudtrail to an s3 bucket. then, we will pull the data from s3 into logz.io using the built-in s3 integration.
note: analyzing the logs generated by the docker containers themselves is an entirely different story. i’ll cover this in part two of this series.
prerequisites
this article assumes that you have an ecs cluster setup in aws. if you do not have that setup and are just getting started with the service, i highly recommend this getting started with ecs console walk-through — it will take you through the steps for setting up a cluster that is servicing a simple web application. i also recommend reading up on the ecs service on the aws documentation site .
enabling cloudtrail
our first step is to enable cloudtrail logging (if you already have this setup, you can skip to the next step).
if cloudtrail has already been enabled, you will be adding a new trail. if this is the first time you are using cloudtrail, just follow the get-started instructions to enable the service. either way, configuring the new trail is pretty straightforward.
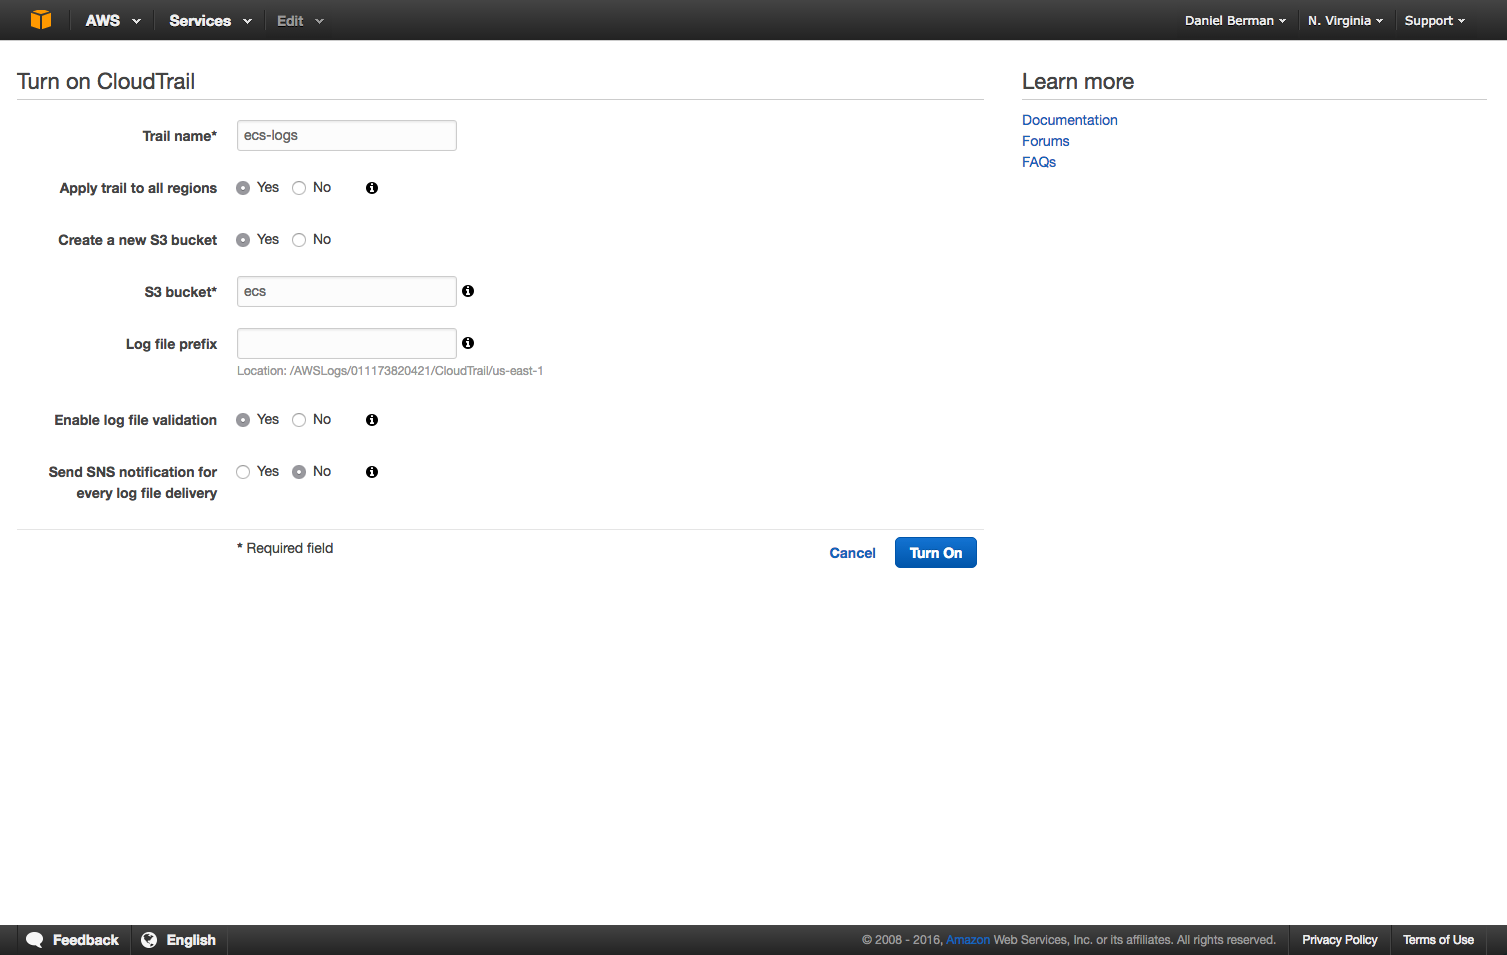
give a name for the new trail and configure the s3 bucket to which you will forward the logs. this is the bucket from which we will pull the logs to send them to the logz.io elk stack.
click “create” (or “turn on,” if this is the first trail you are creating). any api call made to aws ecs will now be logged automatically to s3.
a good way to verify this is by using the aws cli command (you will need to install aws cli ):
$ aws cloudtrail aws cloudtrail lookup-events --lookup-attributes attributekey=resourcename,attributevalue=ecs
ecs events will be displayed like this:
{
   "eventid": "55627f7e-4d82-487b-9ce9-b3933bfdf4ce",
   "username": "root",
   "eventtime": 1470751491.0,
   "cloudtrailevent": "{\"eventversion\":\"1.04\",\"useridentity\":{\"type\":\"root\",\"principalid\":\"011173820421\",\"arn\":\"arn:aws:iam::011173820421:root\",\"accountid\":\"011173820421\",\"accesskeyid\":\"asiaid2fmu6dng5nytia\",\"sessioncontext\":{\"attributes\":{\"mfaauthenticated\":\"false\",\"creationdate\":\"2016-08-09t07:38:02z\"}},\"invokedby\":\"cloudformation.amazonaws.com\"},\"eventtime\":\"2016-08-09t14:04:51z\",\"eventsource\":\"autoscaling.amazonaws.com\",\"eventname\":\"createlaunchconfiguration\",\"awsregion\":\"us-east-1\",\"sourceipaddress\":\"cloudformation.amazonaws.com\",\"useragent\":\"cloudformation.amazonaws.com\",\"requestparameters\":{\"ebsoptimized\":false,\"instancemonitoring\":{\"enabled\":true},\"instancetype\":\"t2.medium\",\"associatepublicipaddress\":true,\"keyname\":\"ecs\",\"launchconfigurationname\":\"ec2containerservice-demo1-ecsinstancelc-fyyhk63y9og\",\"imageid\":\"ami-55870742\",\"userdata\":\"\\u003csensitivedataremoved\\u003e\",\"securitygroups\":[\"sg-87e71efd\"],\"iaminstanceprofile\":\"ecsinstancerole\"},\"responseelements\":null,\"requestid\":\"3d806f0f-5e3a-11e6-b769-a5b2e233c878\",\"eventid\":\"55627f7e-4d82-487b-9ce9-b3933bfdf4ce\",\"eventtype\":\"awsapicall\",\"recipientaccountid\":\"011173820421\"}",
   "eventname": "createlaunchconfiguration",
   "resources": [
      {
         "resourcetype": "aws::ec2::securitygroup",
         "resourcename": "sg-87e71efd"
      },
      {
         "resourcetype": "aws::autoscaling::launchconfiguration",
         "resourcename": "ec2containerservice-demo1-ecsinstancelc-fyyhk63y9og"
      },
      {
         "resourcetype": "aws::iam::instanceprofile",
         "resourcename": "ecsinstancerole"
      },
      {
         "resourcetype": "aws::ec2::keypair",
         "resourcename": "ecs"
      },
      {
         "resourcetype": "aws::ec2::ami",
         "resourcename": "ami-55870742"
      }
   ]
}
shipping ecs event logs to logz.io
now, it starts to get interesting. we’ve verified that api calls to the ecs service are being tracked by cloudtrail, so our next step is to configure our shipping pipeline from cloudtrail into the logz.io elk stack for further analysis.
to do this, we first need to make sure that you have the correct permissions to list buckets and get objects from all the paths under it.
make sure that your iam user has the following policies attached (replace “ecseventlogs” with the name of your s3 bucket):
{
      "sid": "stmt1467037144000",
      "effect": "allow",
      "action": [
         "s3:listbucket"
      ],
      "resource": [
         "arn:aws:s3:::ecseventlogs"
      ]
   },
   {
      "sid": "stmt1467037240000",
      "effect": "allow",
      "action": [
         "s3:getobject"
      ],
      "resource": [
         "arn:aws:s3:::ecseventlogs/*"
      ]
   }
 ]
}
be sure to make note of the user credentials because our next step is to define the bucket in logz.io (this is under the security credentials tab on the user page).
open the log shipping tab in the logz.io ui, and select the aws -> cloudtrail bucket section:
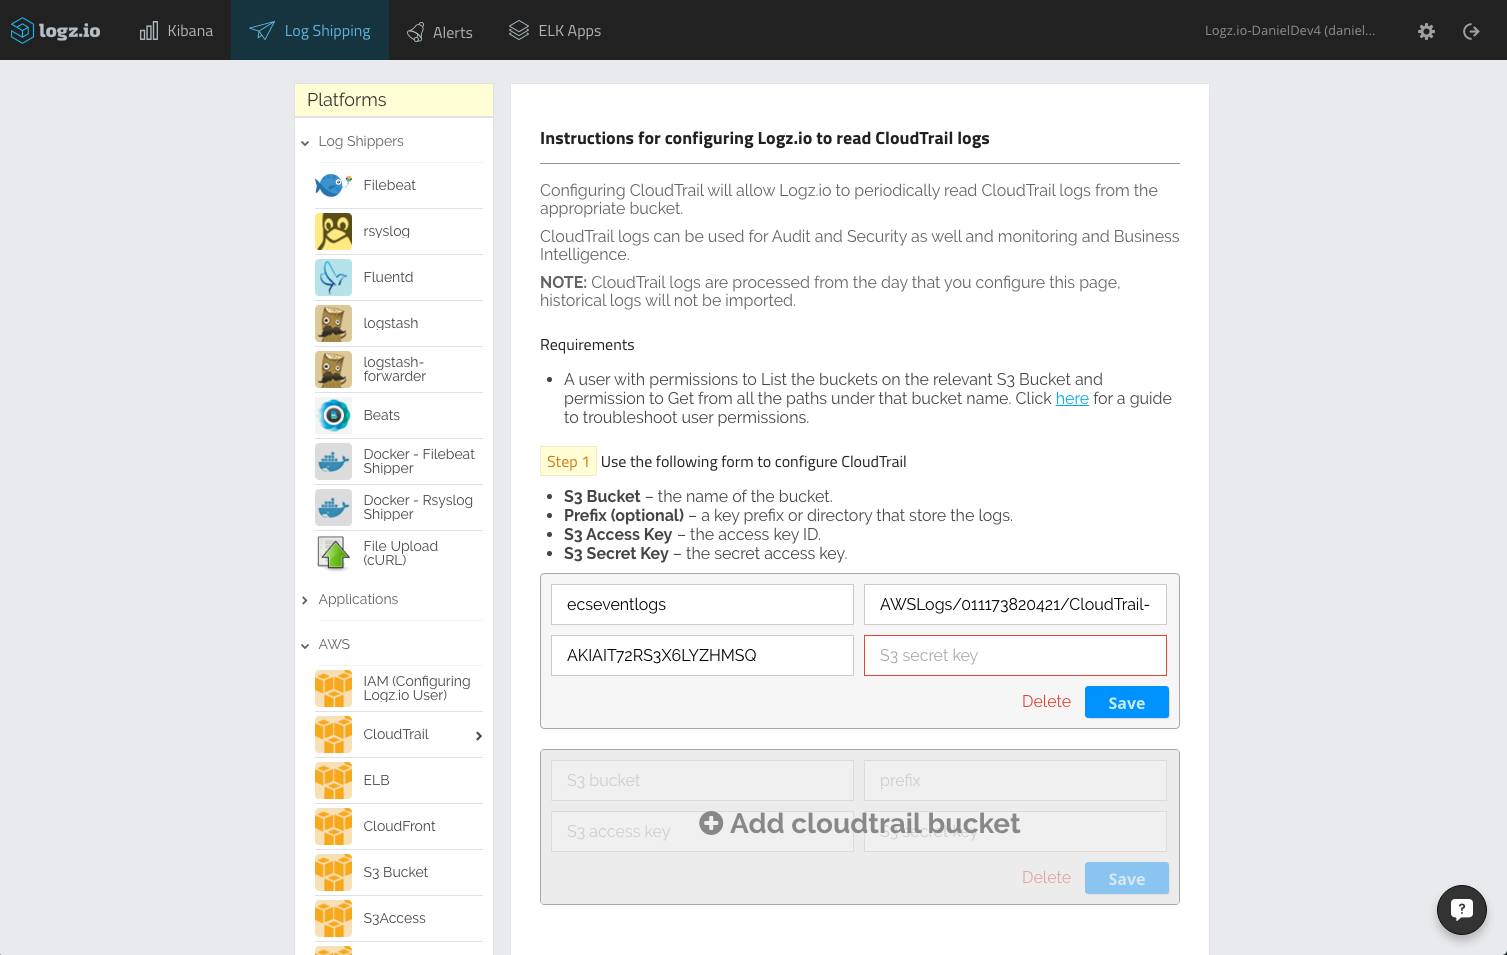
enter the details of the s3 bucket that contains your ecs cloudtrail logs — the bucket name, the bucket path (e.g. /awslogs/011173820421/cloudtrail/), and the user credentials (access and security keys).
click “save.” you should get a green message that confirms that your s3 bucket can now be accessed. if not, there is most likely a permissions issue — check out this troubleshooting article for more information.
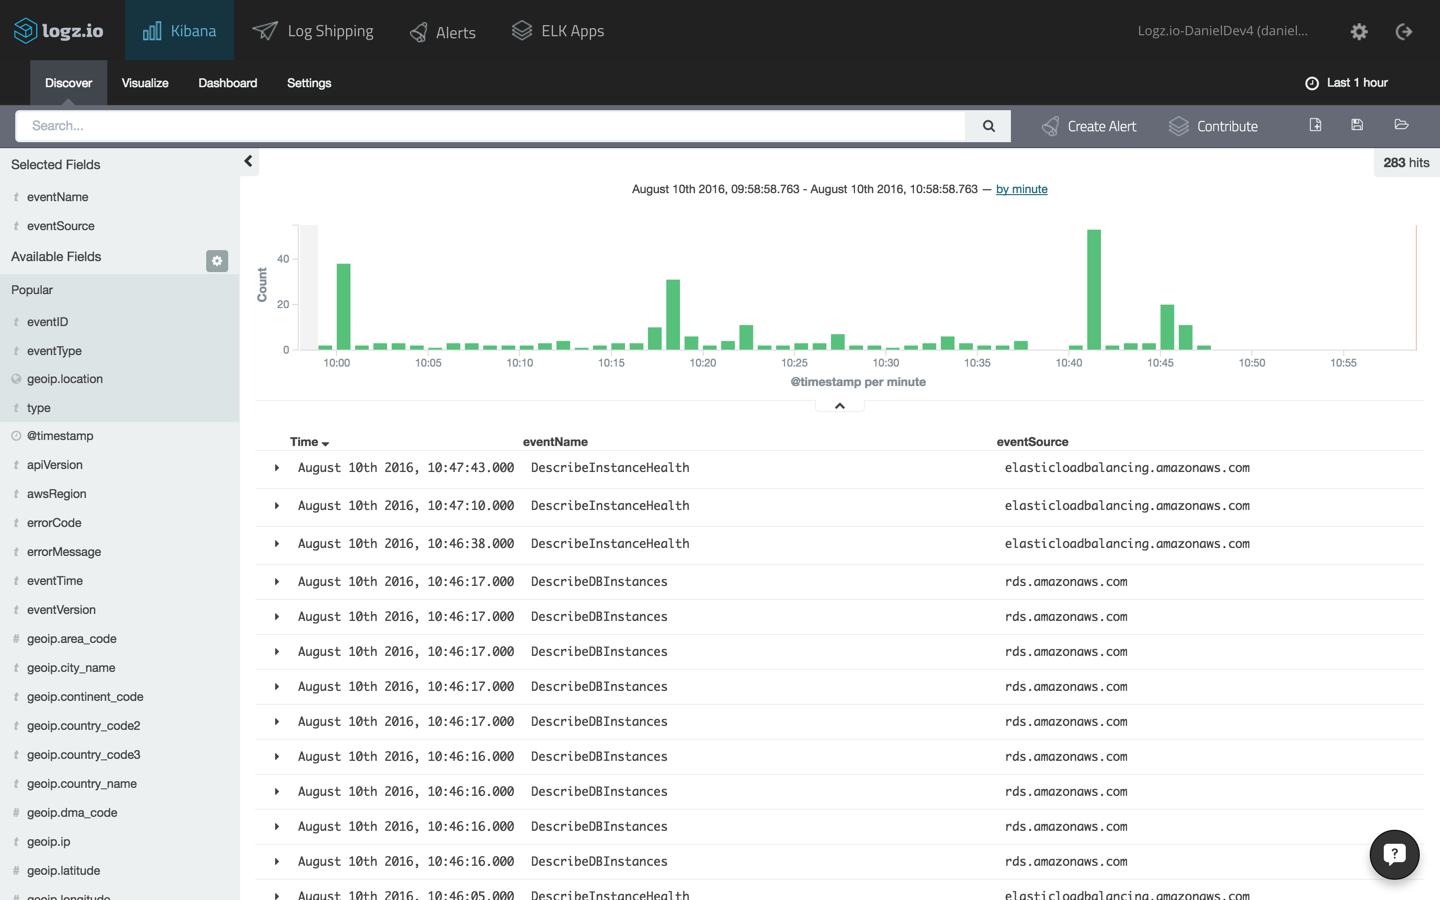
open the discover tab in the kibana dashboard that is built into the logz.io user interface. your ecs logs will be displayed:
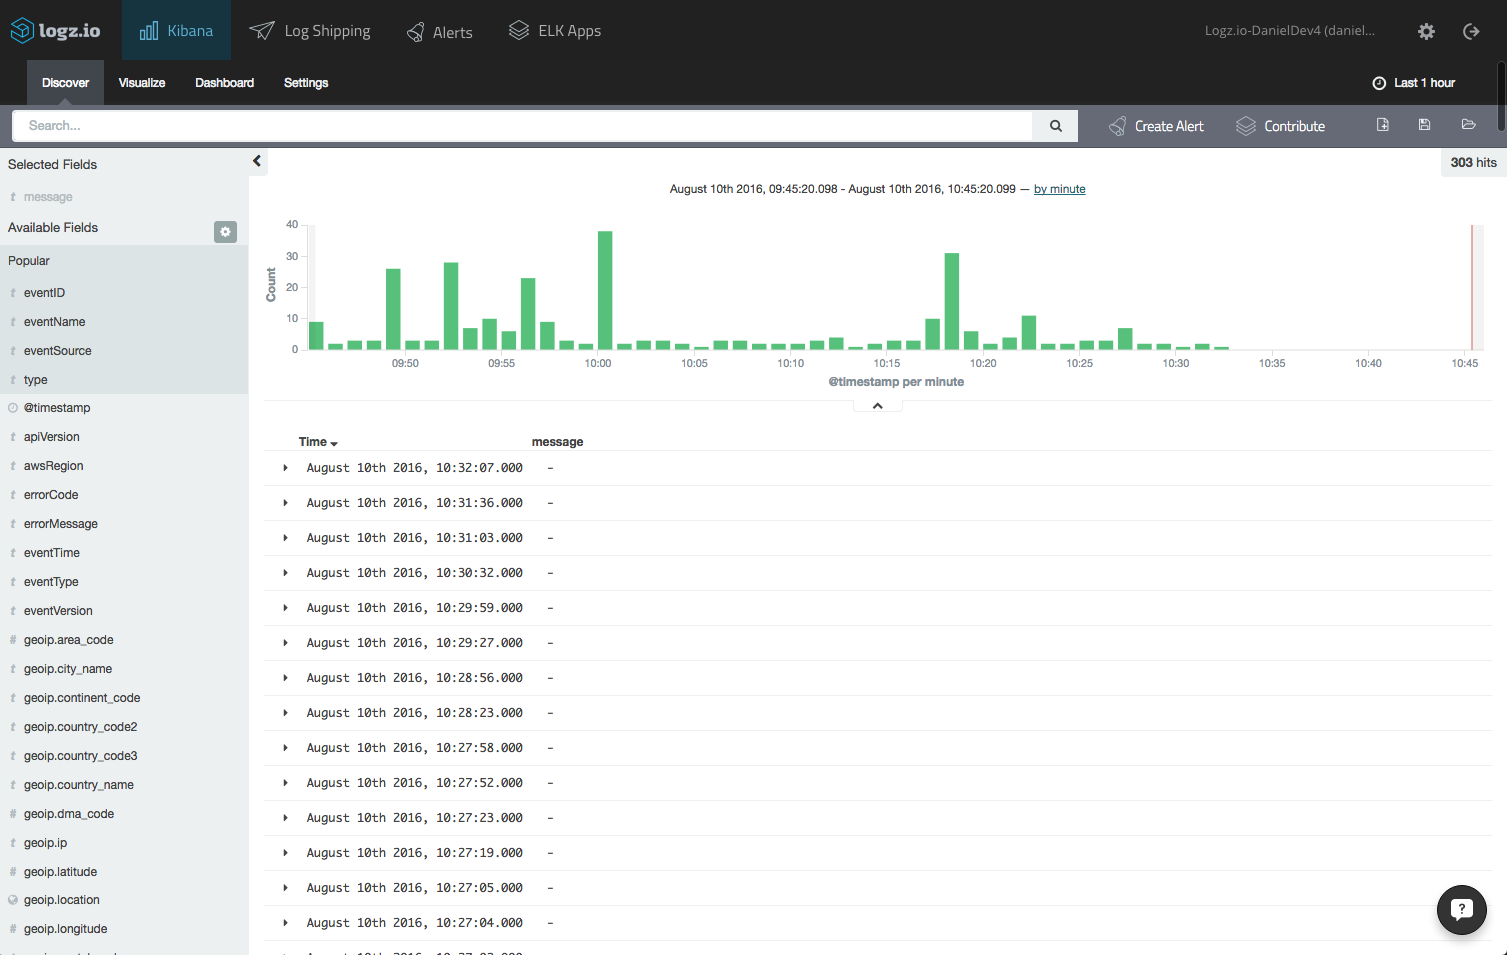
logz.io will parse cloudtrail logs for you, but you will need to refresh the mapping by opening the setting page and clicking the refresh mapping button.
analyzing ecs events
you have successfully established an event logging pipeline from cloudtrail into the logz.io elk stack, so all api calls made to ecs will now be displayed in your kibana dashboard.
to get better visibility into the messages being logged, add some fields to the message list. for example, select the “eventname” and “eventresource” fields. this will allow you to see which aws service is generating the event:
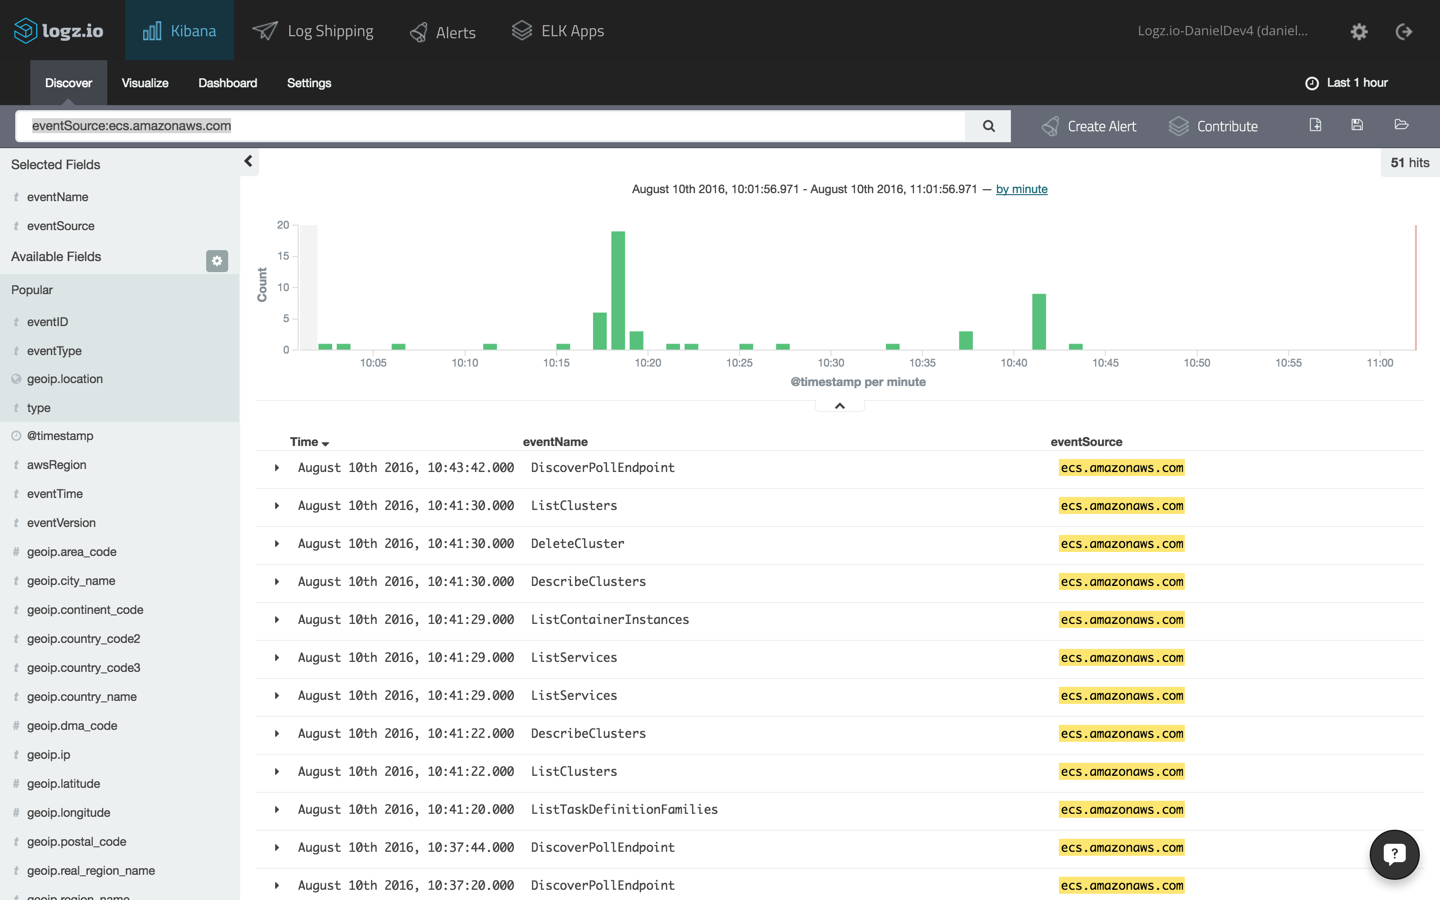
since multiple aws services including ec2 and elb are involved in running an ecs cluster, you will see a considerable number of events being tracked by cloudtrail. as an initial step, it’s a good idea to filter the messages using this query in kibana:
eventsource:ecs.amazonaws.com
you can now see a more distilled view of the api calls to ecs:
selecting one of the entries, we will be able to view the logged message as it was indexed in elasticsearch in json format:
{
   "_index": "logz-pusfjuomruyfnhdfzltthhjuiogamcvd-160810_v1",
   "_type": "cloudtrail",
   "_id": "avzza9gdhglawdhrdu3a",
   "_score": null,
   "_source": {
      "eventid": "aaa65dc3-18e0-4e2d-b358-5ae7f2b9ff53",
      "awsregion": "us-east-1",
      "geoip": {
         "city_name": "tel aviv",
         "timezone": "asia/jerusalem",
         "ip": "37.142.40.241",
         "latitude": 32.0667,
         "country_code2": "il",
         "country_name": "israel",
         "country_code3": "isr",
         "continent_code": "as",
         "region_name": "05",
         "location": [
            34.766699999999986,
            32.0667
         ],
         "real_region_name": "tel aviv",
        "longitude": 34.766699999999986
      },
      "eventversion": "1.04",
      "responseelements": null,
      "sourceipaddress": "37.142.40.241",
      "eventsource": "ecs.amazonaws.com",
      "requestparameters": {
         "maxresults": 100
      },
      "useragent": "console.amazonaws.com",
      "useridentity": {
         "accesskeyid": "asiajvyankos2u2ezqdq",
         "sessioncontext": {
            "attributes": {
            "mfaauthenticated": "false",
      "creationdate": "2016-08-10t06:27:54z"
         }
      },
      "accountid": "011173820421",
      "principalid": "011173820421",
      "type": "root",
      "arn": "arn:aws:iam::011173820421:root"
   },
   "eventtype": "awsapicall",
   "type": "cloudtrail",
   "tags": [
      "cloudtrail-geoip"
   ],
   "@timestamp": "2016-08-10t07:41:30.000+00:00",
   "requestid": "5ffdab4d-fc83-4927-9ad3-4c990daf1a9f",
   "eventtime": "2016-08-10t07:41:30z",
   "eventname": "listclusters",
   "recipientaccountid": "011173820421"
 },
 "fields": {
   "@timestamp": [
      1470814890000
   ]
},
"highlight": {
   "eventsource": [

"@[email protected]@/kibana-highlighted-field@"
      ]
   },
   "sort": [
      1470814890000
   ]
}
building an ecs events dashboard
one of kibana’s strengths is its easy ability to build beautiful visualizations on top of searches and queries. as an example, here is how you can build a security-oriented dashboard that can track who is accessing your ecs cluster and how.
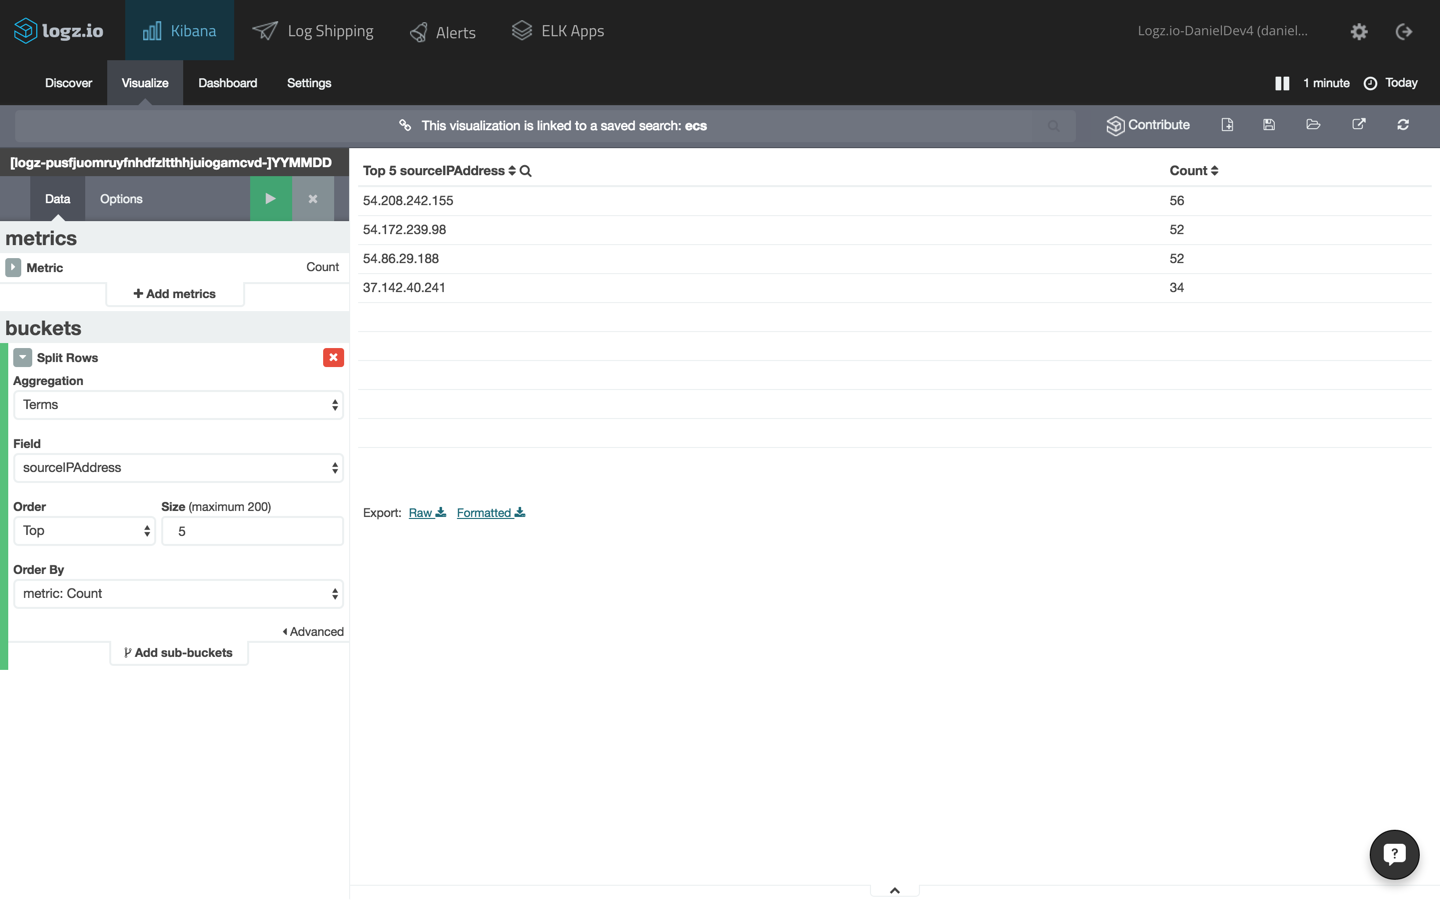
source ip addresses
let’s start with a simple visualization depicting the top source ip addresses. to do this, save the query above and use it for a new data table visualization (in kibana, go to visualize → pie chart, and select the saved search).
the configuration for the table will display split rows of the top five values for the “sourceipaddress” field. the configuration and the resulting visualization will look like this:
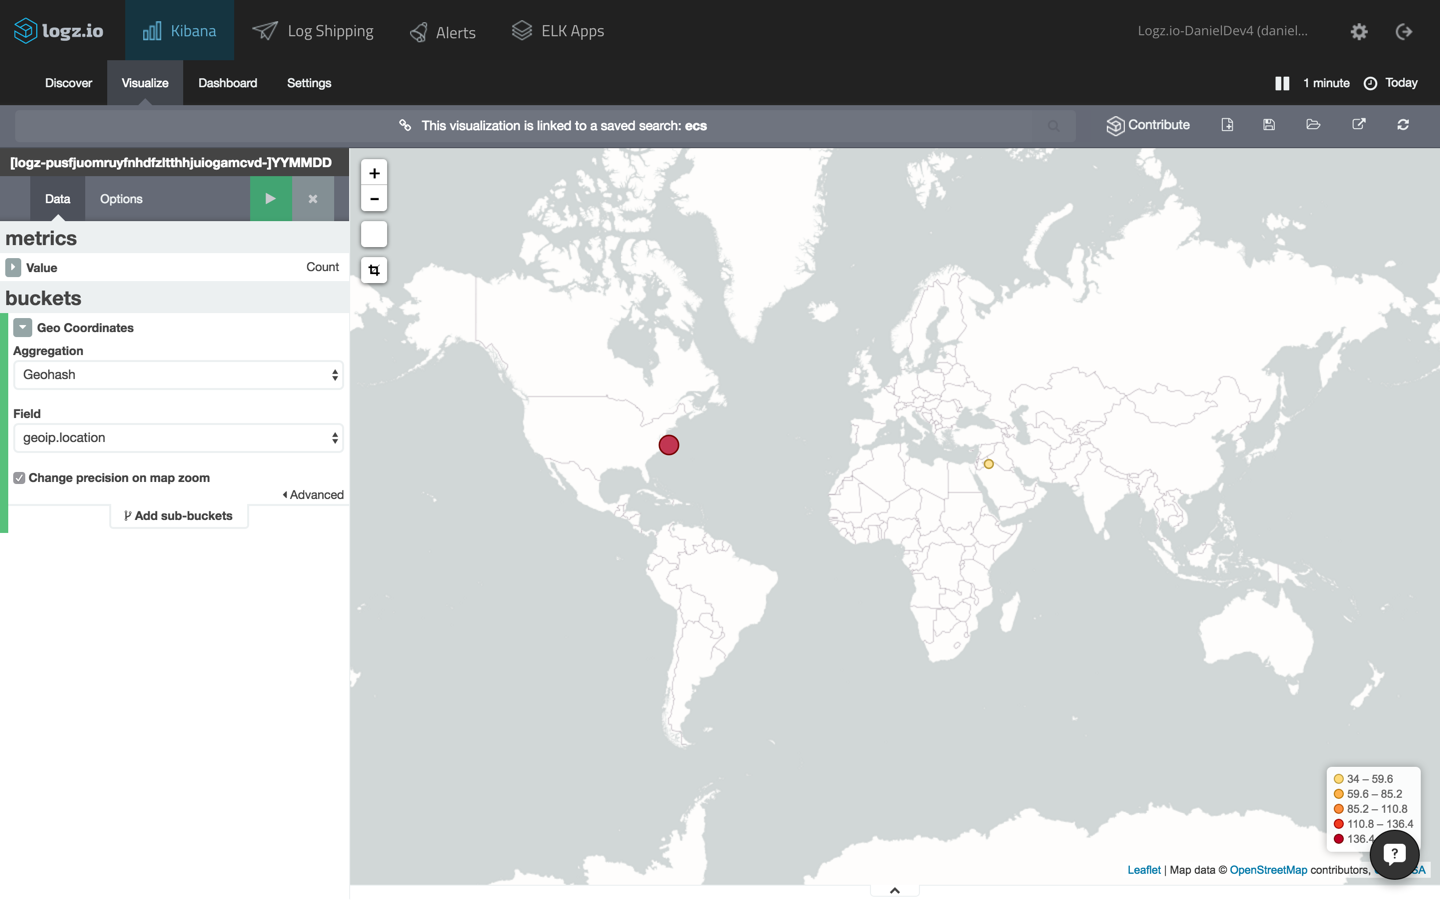
geomap for api calls
our next visualization will create a map that details the geographic location of the ecs service consumers.
using the same search, this time, we’re going to select the “tilemap” visualization type. the configuration is automatically loaded in this case (using the “geoip.location” field of the cloudtrail logs).
here is the configuration and the end result:
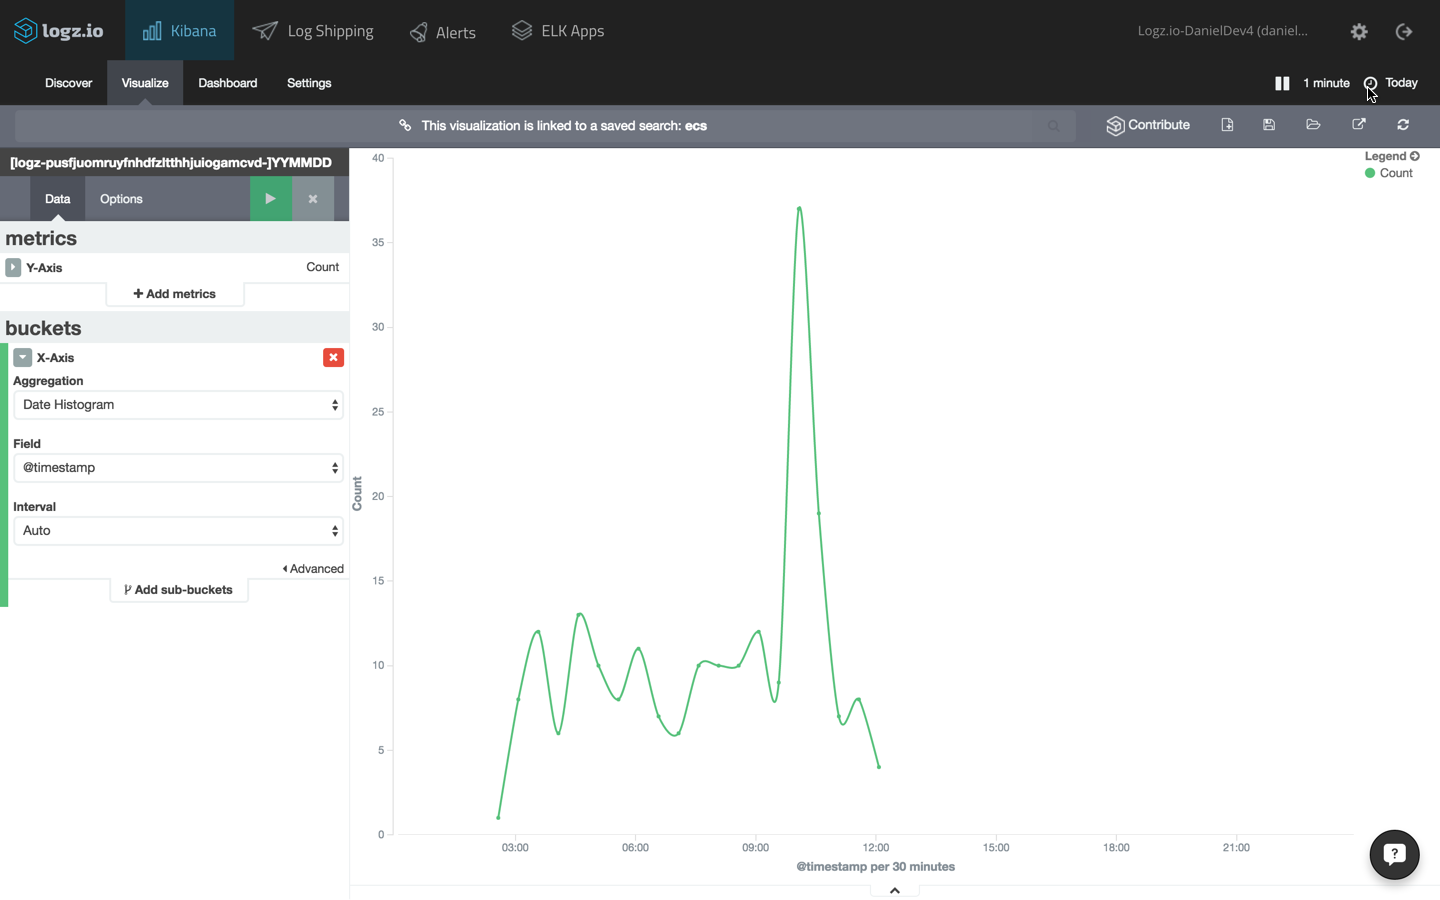
ecs events over time
another example is to show the number of calls to ecs over time. to do this, create a line chart visualization with an x axis using the date histogram aggregation type.
the configuration and visualization:
these are just three examples of visualizing the data in kibana. once you have a number of these visualizations set up, you can combine them into one comprehensive dashboard.
it goes without saying that there are many ways to slice and dice ecs data, and the method that you will use will depend on your use case and what specific information you are trying to analyze and visualize.
logz.io comes with a built-in elk apps library of pre-made visualizations and dashboards — including ones for cloudtrail logs. saving you the time of constructing visualizations one by one, you can install these apps in one click. a popular elk app is the cloudtrail security and auditing dashboard , which includes visualizations for login and deletion actions, users, and other security and network related graphs.
coming next: docker
by shipping cloudtrail logs into elk, you can get a good detailed picture on the api calls made to ecs.
again, these are high-level logs and do not reveal information on what is transpiring within the docker containers themselves. to monitor containers, a completely different solution is needed in which docker logs, together with additional available docker info (e.g. docker stats, docker daemon events) are collected from the containers. the next piece in this series will cover this aspect.
Published at DZone with permission of Daniel Berman. See the original article here.
Opinions expressed by DZone contributors are their own.
Comments