Anatomy of a PostgreSQL Query Plan
The first thing to look at to start optimizing a query is the Query Planner. In this post, we explain how a query gets executed and how to understand the EXPLAIN command.
Join the DZone community and get the full member experience.
Join For FreeIntroduction
Understanding the PostgreSQL query plan is a critical skill set for developers and database administrators alike. It is probably the first thing we would look at to start optimizing a query, and also the first thing to verify and validate if our optimized query is indeed optimized the way we expect it to be.
The Query Life Cycle in PostgreSQL Database
Before we attempt to read a query plan it is important to ask some very basic questions:
- Why do we even need a query plan?
- What exactly is represented in the plan?
- Is PostgreSQL not smart enough to optimize my queries automatically? Why should I worry about the planner?
- Is the planner the only thing I need to look at?
Every query goes through different stages and it is important to understand what each stage means to the database.
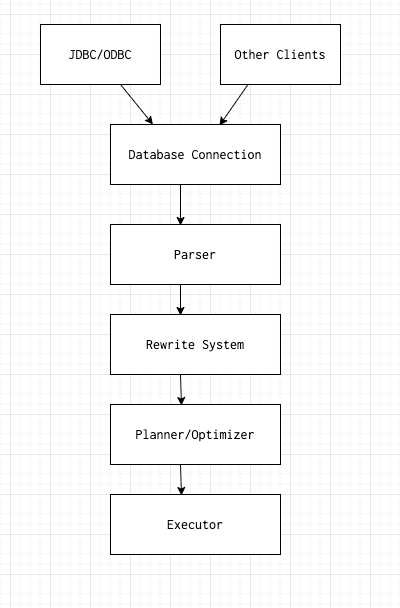
The second phase would be to translate the query to an intermediate format known as the parse tree. Discussing the internals of the parse tree would be beyond the scope of this article, but you can imagine it is like a compiled form of an SQL query.
The third phase is what we call the re-write system/rule system. It takes the parse tree generated from the second stage and re-writes it in a way that the planner/optimizer can start working in it.
The fourth phase is the most important phase and the heart of the database. Without the planner, the executor would be flying blind for how to execute the query, what indexes to use, whether to scan a smaller table to eliminate more unnecessary rows, etc. This phase is what we will be discussing in this article.
The fifth and final phase is the executor, which does the actual execution and returns the result. Almost all database systems follow a process that is more or less similar to the above.
Data Setup
Let's set up some dummy table with fake data to run our experiments on.
create table fake_data(id serial, name text, sentence text, company text);
And then fill this table with data. I used the below Python script to generate random rows.
xxxxxxxxxx
from faker import Faker
fake = Faker()
# Change this range to whatever value you like
MAX_RANGE = 1000
with open('data.csv', 'w') as f:
for i in range(0, MAX_RANGE):
name = fake.name().replace(",", "")
sentence = fake.sentence(
nb_words=16, variable_nb_words=True
).replace(",", "")
company = fake.company().replace(",", "")
content = "'" + name + "'" + "," + \
"'" + sentence + "'" + "," \
+ "'" + company + "'" + "\n"
f.write(content)
The script uses the Faker library to generate fake data. It will generate a csv file at the root level and can be imported as a regular csv into PostgreSQL with the below command.
xxxxxxxxxx
COPY fake_data(name, sentence, company)
FROM '/path/to/csv' DELIMITER ','
Since id is serial it will get automatically filled by PostgreSQL itself.
xxxxxxxxxx
SELECT COUNT(*) FROM fake_data;
The table now contains 1119284 records.
Most of the examples below will be based on the above table. It is intentionally kept simple to focus on the process rather than table/data complexity.
The below examples use the Arctype editor. The featured image of the post comes from the Depesz online Explain tool.
Getting Into the Planning Stage
PostgreSQL and many other database systems let users see under the hood of what is actually happening in the planning stage. We can do so by running what is called an EXPLAIN command.
PostgreSQL EXPLAIN a Query
xxxxxxxxxx
EXPLAIN SELECT * FROM fake_data LIMIT 10;
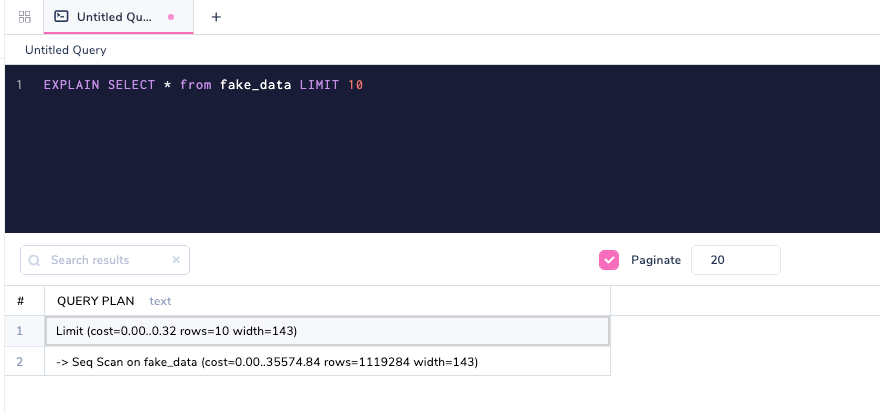
EXPLAIN, you can look at query plans before they are actually executed by the database. We will get to the understanding part of each of these in the below section, but let's first take a look at another extended version of EXPLAIN called EXPLAIN ANALYSE.
Explain Analyze Together
xxxxxxxxxx
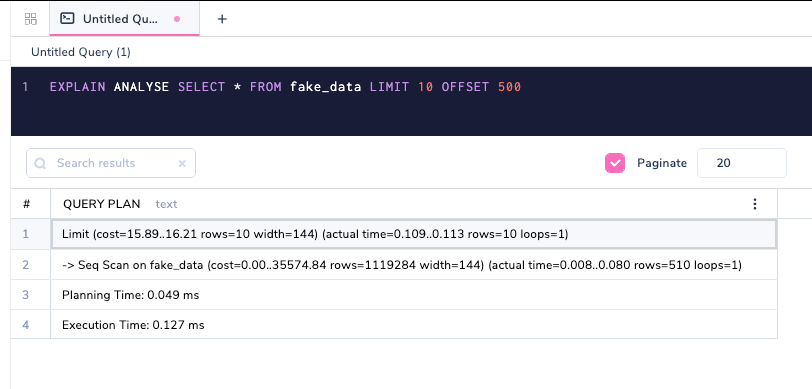
EXPLAIN ANALYSE SELECT * FROM fake_data LIMIT 10;

EXPLAIN, EXPLAIN ANALYSE actually runs the query in the database. This option is incredibly helpful to understand whether the planner is not playing its part correctly; i.e., whether or not there is a huge difference in the plan generated from EXPLAIN and EXPLAIN ANALYSE.
PostgreSQL is comfortable with bothANALYZEandANALYSE
What are Buffers and Caches in a Database?
Let's proceed to a more interested metric called BUFFERS. This explains how much of the data came from the PostgreSQL cache and how much had to fetch from disk.
xxxxxxxxxx
EXPLAIN (ANALYSE,BUFFERS) SELECT * FROM fake_data LIMIT 10 OFFSET 200
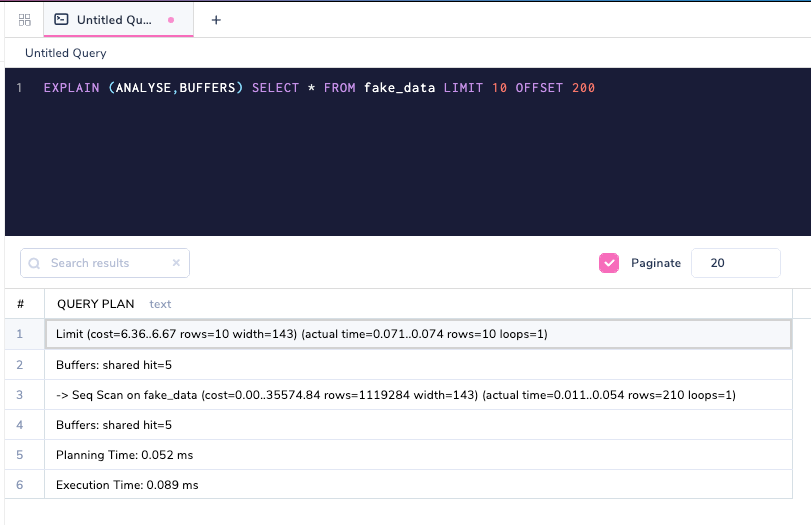
Buffers : shared hit=5 means that five pages were fetched from the PostgreSQL cache itself. Let's tweak the query to offset from different rows.
xxxxxxxxxx
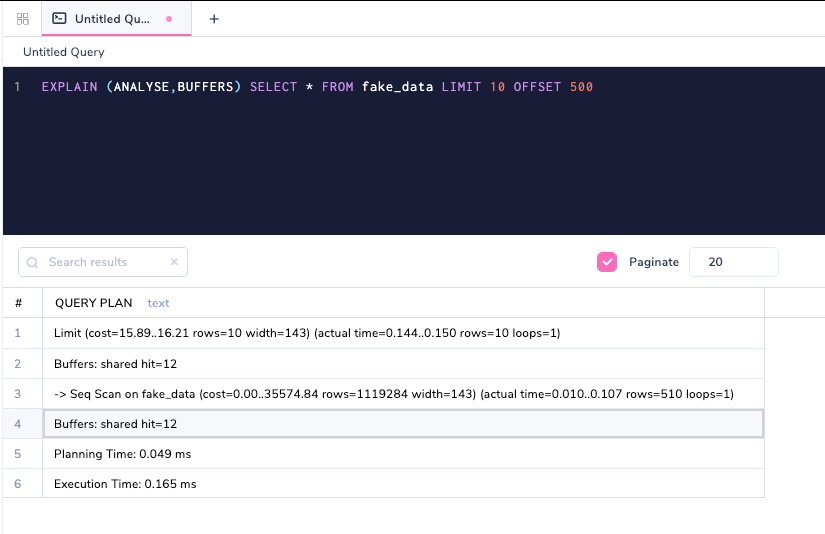
EXPLAIN (ANALYSE,BUFFERS) SELECT * FROM fake_data LIMIT 10 OFFSET 500
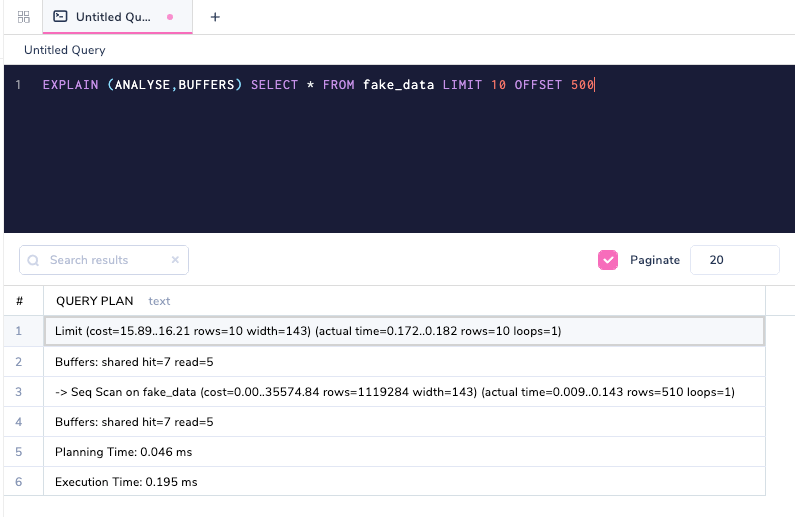
Buffers: shared hit=7 read=5 shows that 5 pages came from disk. The read part is the variable that shows how many pages came from disk, and hit as already explained came from the cache. If we execute the same query again (remember that ANALYSE runs the query), then all of the data now comes from the cache.
EXPLAIN (ANALYSE, BUFFERS) command.
The VERBOSE Command Argument
xxxxxxxxxx
EXPLAIN (ANALYSE,BUFFERS,VERBOSE) SELECT * FROM fake_data LIMIT 10 OFFSET 500
Verbose is another command argument that gives extra information.
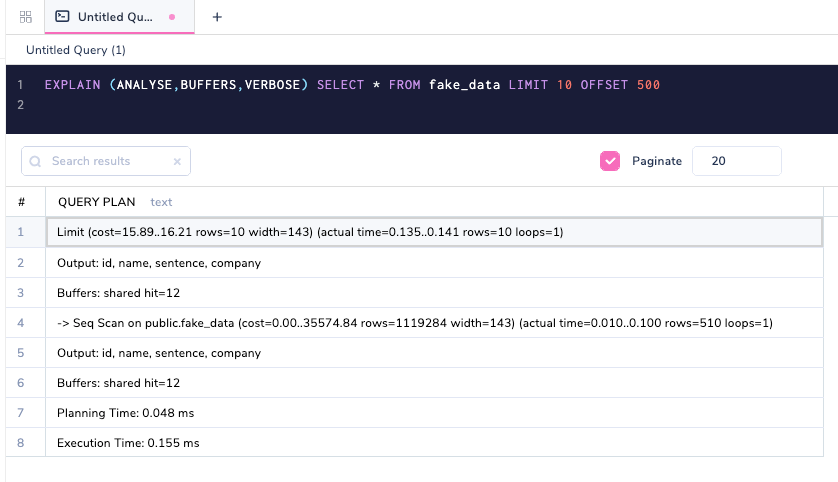
Notice that the Output: id, name, sentence, company is additional. In a complex query plan, there will be loads of other information that will be printed. By default, the COSTS and TIMING option is TRUE as a setting and there is no need to specify them explicitly unless you want to set them as FALSE.
FORMAT in Postgres Explain
PostgreSQL has the ability to give the query plan in a nice format such as JSON so that these plans can be interpreted in a language-neutral way.
xxxxxxxxxx
EXPLAIN (ANALYSE,BUFFERS,VERBOSE,FORMAT JSON) SELECT * FROM fake_data LIMIT 10 OFFSET 500
Will print the query plan in JSON format. You can view this format in Arctype by copying its output and inserting it into another table as shown in the GIF below.

- Text (Default)
- JSON (Above example)
- XML
- YAML
There are two other options called SETTINGS and WAL which can be included with the query plan, but these are out of scope for this particular post.
To summarize:
EXPLAINis the plan type you would typically start with, and is mostly used in production systems.EXPLAIN ANALYSEis used to run the query along with getting the query plan. This is how you get the planning time and execution time breakdown in the plan and a comparison with the cost and actual time of the executed query.EXPLAIN (ANALYSE, BUFFERS)is used on top of analyse to get how many rows/pages came from cache and disk and how the cache behaves.EXPLAIN (ANALYSE, BUFFERS, VERBOSE)to get verbose and additional information regarding the queries.EXPLAIN(ANALYSE,BUFFERS,VERBOSE,FORMAT JSON)is how you would export in a specific format; in this case, JSON.
In the next section, we will use these tools to examine how the PostgreSQL query plan works. For ease of reading, we will only be looking at the Text format of a PostgreSQL query plan.
Elements of a Query Plan
Any query plan irrespective of the complexity has some fundamental structure to it. In this section, we are going to focus on these structures, which will help us understand the query plan in an abstract fashion.
Nodes of a Query
A query plan is made up of nodes:
xxxxxxxxxx
EXPLAIN SELECT * FROM fake_data LIMIT 10 OFFSET 500;
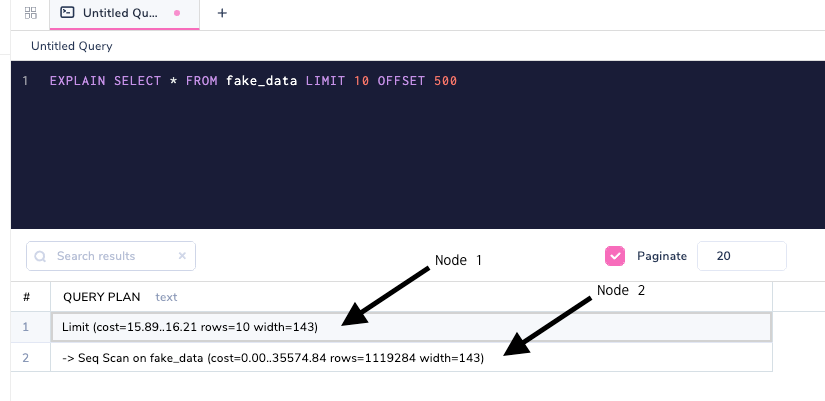
A node can be thought of as a stage in database execution. Nodes are mostly nested as shown above; the Seq Scan is done before and on top of it, and then the Limit clause is applied. Let's add a Where clause to understand further nesting.
xxxxxxxxxx
EXPLAIN SELECT * FROM fake_data where NAME = 'Sandra Smith' LIMIT 10
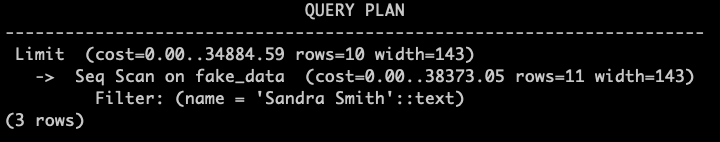
- Filter Rows where name = Sandra Smith.
- Do a sequential scan with the above filter.
- Apply limit clause on top.
As you can see, the database recognizes that only 10 rows are needed, and does not scan beyond once the required 10 rows have been achieved. Please note I have turned off the SET max_parallel_workers_per_gather =0; so that the plan is simpler. We will explore parallelization in a later article.
Cost in the Query Planner
Costs are a crucial part of a database query plan, and these can be easily misunderstood because of how they are represented. Let's take a look again at the simple plan with costs.
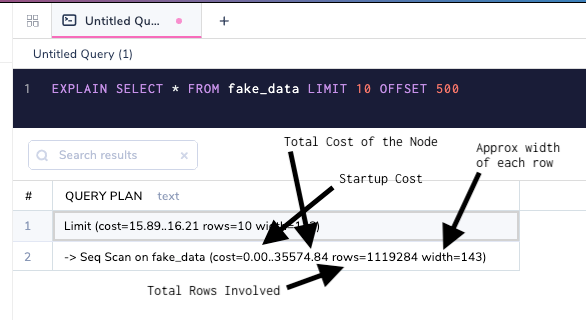
A few important things to note are:
- The startup cost of a
LIMITclause is not zero. This is because the startup costs are summed up to the top and, what you see is the cost for the nodes below it. - The total cost is an arbitrary measure and is more relevant to the planner than the user. You would never fetch the whole table data at the same time in any practical use case.
- Sequential scans are notoriously bad at estimates because the database has no idea how to optimize them. Indexes can tremendously speed up queries with
WHEREclauses. Widthis important because the wider a row is, the more data has to be fetched from the disk. That is why it is very important to follow normalization for database tables.
If we actually run the query then the costs would make more sense.
Database Planning and Execution
Planning and Execution Time are metrics that are obtained only with the EXPLAIN ANALYSE option.
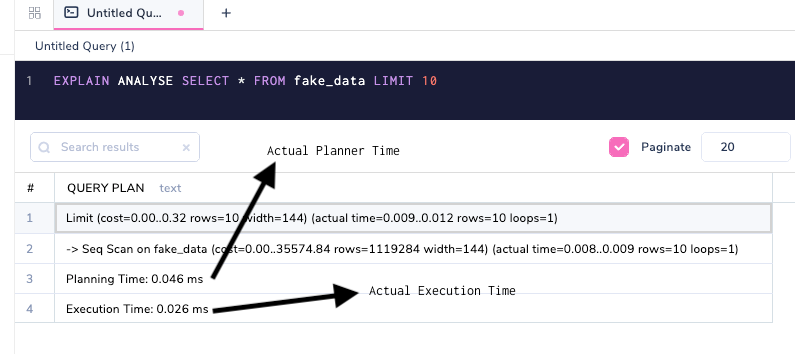
The Planner (Planning Time) decides how the query should run based on a variety of parameters, and the Executor (Execution Time) runs the query. These parameters indicated above are abstract and apply to any kind of query. The runtime is represented in milliseconds. In many cases, the planning time and execution time might not be close, and as in the above, the planner might take more time to plan the query and the executor is taking less time which is usually not the case. They don't necessarily need to match one another, but if they deviate a lot, then it's time to introspect on why it happened.
In a typical OLTP system such as PostgreSQL, any planning and execution combined should be less than 50MS unless it is an analytics query/huge writes/known exceptions. Remember, OLTP stands for Online Transaction Processing. In a typical business, transactions usually run from thousands to millions. These execution times should always be watched very carefully, as these smaller costlier queries might sum up and add a huge overhead.
Where to Go From Here
We have covered topics ranging from query lifecycle to how the planner makes its decisions, I have deliberately left out topics like node types (scans, sorting, joins) as they would require dedicated articles of their own. The goal of this article is to give a broad understanding of how the query planner works, what influences its decisions and what tools PostgreSQL provides to understand the planner even better.
Let's revisit the questions we asked above.
Q: Why do we even need a query plan?
A: 'A Fool with a Plan is better off than a Genius without a Plan!' - old Arctype proverb. A plan is absolutely necessary to decide what path to take, particularly when the decision is made based on stats.
Q: What exactly is represented in the plan?
A: The plan consists of nodes, costs, planning, and execution times. Nodes are the fundamental building block of a query. Cost is the basic attribute for a node. Planning and execution time to see actual times.
Q: Is PostgreSQL not smart enough to optimize my queries automatically? Why should I worry about the planner?
A: PostgreSQL is actually as smart as it can get. The planner is getting better and better with each release, but there is no such as a fully automated/perfect planner. It is actually not practical since an optimization might be good for one query but bad for another. The planner has to draw the line somewhere and give consistent behavior and performance. A lot of responsibility lies with developers/DBAs to write optimized queries and understand database behavior in a better fashion.
Q: Is the planner the only thing I need to look at?
A: Definitely not. There are a lot of other things such as domain expertise of the application, table design, and database architecture, etc., which are very crucial. But as a developer/DBA understanding and improving these abstract skill sets are extremely important for our career.
With this fundamental knowledge, we can now confidently read any plan and form a high-level idea of what is happening. Query optimization is a very broad topic and would require knowledge of a variety of things happening inside the database. In further articles, we will see how different kinds of queries and their nodes are planned and executed and what factors influence the planner's behavior, and how we can optimize them.
Opinions expressed by DZone contributors are their own.
Comments