A Practical Guide to API Threat Analytics in Cloud Platforms
APIs are prime attack targets, so basic security isn’t enough. Use threat analytics to filter logs, detect suspicious activity, and respond fast.
Join the DZone community and get the full member experience.
Join For FreeAny modern application is centered around APIs. They drive mobile applications, link business systems, and deliver new digital experiences. However, the convenience has its own risks — attackers often use APIs to break into systems.
Basic security steps like authentication and rate limits are no longer enough. Attackers now use stolen credentials, automated scripts, and advanced methods to target APIs. To stay safe, organizations need API threat analytics to collect API logs, spot unusual activity, and monitor it in real time with dashboards.
This article shows how to build a cloud-based API threat analytics workflow, key steps for implementation, and a comparison of tools from major cloud providers.
Why API Threat Analytics Matters
APIs are high-value targets because they expose business data and functionality. Without monitoring, security teams are left in the dark. Common risks include:
- Bot attacks: Automated scripts making thousands of API calls in seconds.
- Credential stuffing: Hackers testing stolen username-password pairs to take over accounts.
- Abuse of API keys: An API key accidentally exposed in public code repositories being used by attackers.
- Data scraping: Competitors or bad actors using APIs to steal content or pricing data.
- Denial-of-service attacks: Flooding APIs with requests to slow down or crash your service.
Tracking and analyzing API traffic helps prevent these problems by providing:
- Visibility into API activity: Without analytics, it’s hard to see who is using your APIs, from where, and for what.
- Detection of suspicious behavior: Early alerts for brute-force logins, unusual data downloads, or token abuse.
- Faster threat response: Dashboards and alerts help security teams take action before damage happens.
- Compliance support: Regulations like GDPR or HIPAA require detailed data monitoring, which logging makes possible.
Step-by-Step Guide: Creating API Security Dashboards
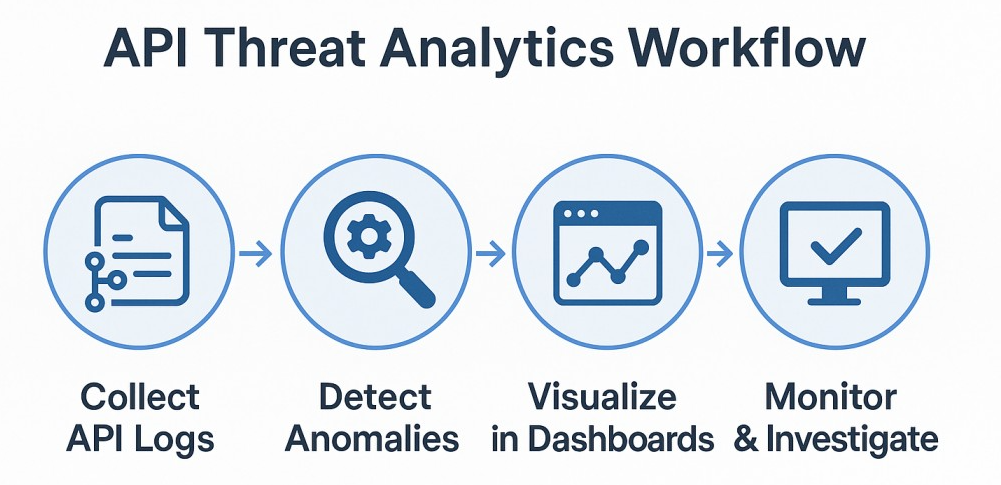
To build a strong analytics workflow, you need logging, analysis, visualization, and alerts.
1. Collect API Logs
Start by gathering logs from your API gateways, load balancers, and backend services. These logs usually include:
- Who made the request (user or service)
- What endpoint was called
- When the request was made
- Response times and error codes
Having a single place to store these logs helps you analyze them later. Also, ensure a consistent format like JSON or Common Log Format.
2. Normalize and Filter the Data
Logs can be noisy. Before you can build dashboards, it’s important to clean them up:
- Remove unnecessary fields that add no security value.
- Group similar data (e.g., combine logs from multiple APIs).
- Filter out health checks or automated background calls that clutter your view.
This step helps you focus only on what matters for detecting threats.
3. Identify Key Security Signals
Not every log entry is a problem. You need to decide which signals matter for security:
- Requests with many failed logins
- Sudden traffic spikes from one IP address
- Unusual API keys being used
- Repeated access to sensitive endpoints
- Large data transfers or abnormal request sizes
These signals form the basis of your dashboards and alerts.
4. Build Dashboards for Monitoring
With clean data and clear security signals, you can now create dashboards that show:
- Top endpoints under attack (e.g., login, checkout, admin APIs)
- Geographic maps of API requests to see suspicious locations
- Trend charts for error rates (e.g., 401 or 403 responses)
- Anomaly scores based on machine learning or simple rules
5. Set Up Alerts
Dashboards are useful, but alerts make them actionable. Configure alerts for scenarios like:
- Error rates jump above a certain limit
- A single user or IP makes too many requests
- New, unknown API keys start making calls
This ensures security teams get notified in real time and can take immediate action.
6. Automate Responses (Optional)
For advanced setups, you can link your dashboards to automated workflows:
- Blocking suspicious IP addresses
- Throttling traffic for high-risk APIs
- Forcing multi-factor authentication on flagged accounts
Automation helps reduce the time between detection and response.
7. Review and Improve
Threat analytics isn’t a “set it and forget it” process. Review your dashboards and alerts regularly:
- Are there too many false alarms?
- Are attackers finding new ways around your rules?
- Are there API endpoints you aren’t tracking yet?
By tuning your dashboards and detection rules, you keep your system effective and up to date.
Flow:
API Gateway / Backend → Log Collection → Storage & Normalization → Threat Detection → Dashboards & Alerts → Automated Response
Practical Code and Query Examples
Adding analytics doesn’t just mean dashboards — you can run queries on your logs directly. Here are some practical snippets:
Example 1: Detecting Failed Logins in BigQuery
SELECT
user_id,
COUNT(*) AS failed_attempts,
TIMESTAMP_TRUNC(timestamp, HOUR) AS hour_window
FROM `project.api_logs`
WHERE response_code = 401
GROUP BY user_id, hour_window
HAVING COUNT(*) > 10
ORDER BY failed_attempts DESC;
Flags accounts with more than 10 failed logins in an hour.
Example 2: Detecting Traffic Spikes in Splunk
index=api_logs
| stats count by client_ip, _time
| where count > 1000
Identifies potential DoS or bot activity from a single IP.
Example 3: Chronicle YARA-L Rule for Suspicious API Keys
rule APIKey_Misuse
when {
http.request.header['x-api-key'] matches /.{32}/
and http.request.path contains "/sensitive"
and count(http.response.status==200) > 100 in 5m
}
then {
alert "Potential API key abuse detected"
}
Useful for detecting abnormal API key usage.
Example 4: PromQL for 403 Errors in Grafana
sum(rate(api_requests_total{status="403"}[5m])) by (endpoint)Tracks blocked access attempts across endpoints.
Tools You Can Use
You can achieve this setup with a variety of tools. Here’s a table showing various tools provided by different cloud providers:
| Component | AWS | google cloud | azure | other options |
|---|---|---|---|---|
| Log Collection | CloudWatch Logs | Cloud Logging | Azure Monitor Logs | ELK Stack (ElasticSearch) |
| Log Storage and Query | Athena/Open Search | BigQuery | Log Analytics | Splunk, Datadog |
| Threat Detection | GuardDuty | Chronicle | Microsoft Sentinel | Sumo Logic, Wazuh |
| Dashboarding | QuickSight | Looker Studio | PowerBI | Grafana, Kibana |
| Alerting | CloudWatch Alarms | Cloud Monitoring | Azure Alerts | PagerDuty, Opsgenie |
Key Takeaways
- APIs are often targeted by attackers, making threat analytics critical.
- Collect and centralize logs from all your APIs.
- Focus on key security metrics like failed logins, unusual traffic, and error spikes.
- Build dashboards to make data visual and actionable.
- Use alerts and automation to respond faster.
- Choose the tools that fit your environment — most cloud providers have similar options.
With a solid API threat analytics setup, you can transform raw data into actionable insights and keep your APIs safe from evolving threats.
Opinions expressed by DZone contributors are their own.
Comments