APM Tools Comparison: Which One Should You Choose?
APM tools are important for monitoring the performance pf applications and helping you solve performance problems. So how do you know which one is best?
Join the DZone community and get the full member experience.
Join For FreeAPM (Application Performance Management) tools are solutions for monitoring and managing the performance, availability and user experience of software applications. In times when our users are very demanding regarding speed and uptime (particularly in web-based applications), APM tools are very useful for detecting and diagnosing performance-related problems in production environments, without significantly adding overhead to resource consumption.
Typically, APM tools expose information about response times, load, transactions, resources consumption, network data and other performance metrics of a system application and infrastructure. These metrics are presented with a certain level of correlation that allows the user to analyze the data easily, and quickly detect the cause of the problems or potential optimizations in order to maintain an expected service level.
In the last few years, APM tools have become very popular for companies who have software applications, and especially SaaS ones. This is because they are affordable and can be adapted to almost any kind of business.
In this blog post, we will present a review of some of the market's most popular SaaS APM tools, detailing the advantages and disadvantages of each one. In the end, I will present a comparison table.
The APM tools I will review are:
Disclaimer: the advantages and the disadvantages presented in this post, as well as the final conclusions, are based on my personal experience using and working in many projects with this kind of tools, and on many user reviews that I read while I was researching for my projects. Each reader will decide if the advantages and disadvantages here apply for her/his specific situation, based on what they are looking for in an APM tool or in her/his personal experience using software with these characteristics.
Let's get started.
New Relic
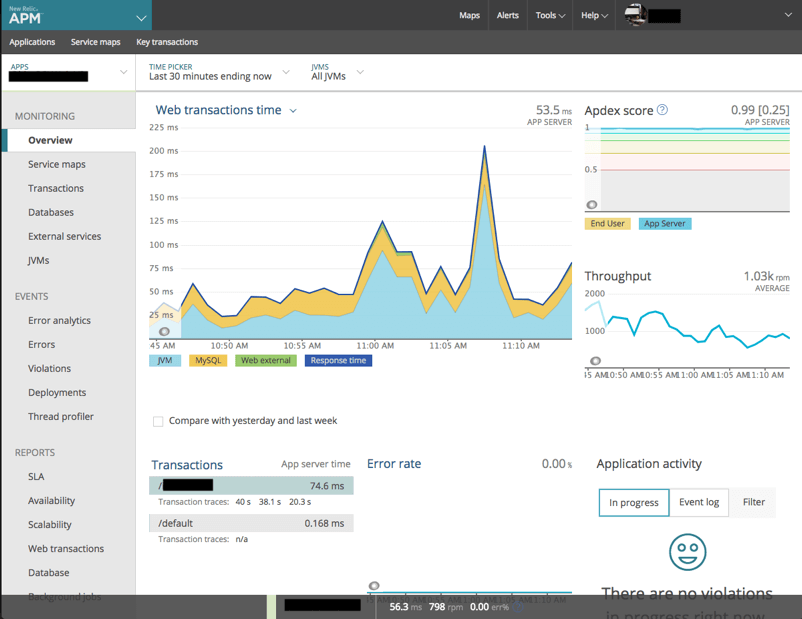
New Relic is probably one of the most popular tools in the application performance management industry. It presents information about many types of software and hardware components or about the user experience, and supports lots of technologies, either through its own agents or external plugins.
Examples of languages supported by the New Relic APM agent are Java, .NET, Node.js, PHP, Python, and Ruby. Examples of technologies supported through the external plugins are Oracle DB, MySQL, Microsoft SQL Server, Citrix NetScaler, PostgreSQL, Apache HTTPd, Nginx Web Server, Amazon Web Server, and more.
One of the best features is the detailed transaction monitoring, offering cross-application tracing and performance tracking of the SQL statements.
Advantages:
- Friendly user interface
- Very good at data correlation
- Enables transaction and process tracing.
- Good community forum and support
Disadvantages:
- Only has a SaaS option (no on-premise version)
- Data retention - This depends on the subscription level, but in the best case, NR stores all the data for 8 days (and then it only stores average data).
- Pricing - The price of subscriptions starts at $60/month approximately and rises depending on many aspects (subscription level, monitoring components, number of servers, etc.). On the other hand, it has a free Lite version, but it presents really poor data and has only 2 hours of data retention.
New Relic GUI:
CloudWatch
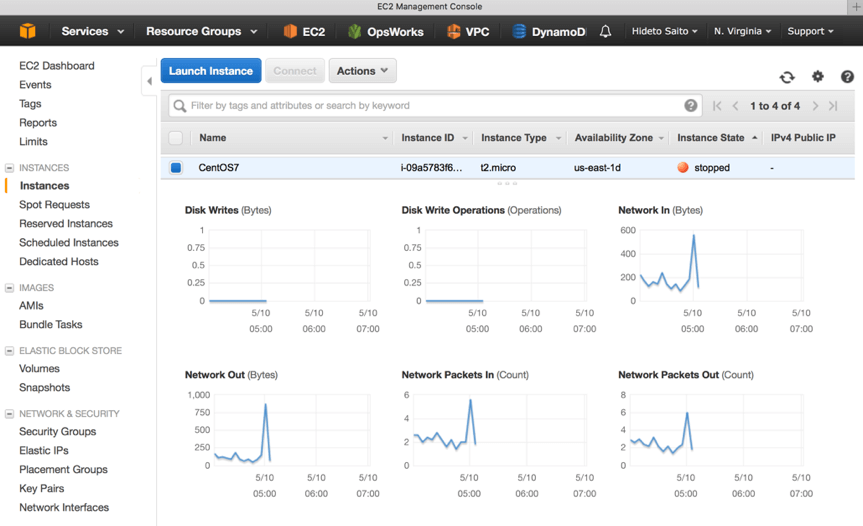
CloudWatch is the AWS monitoring and management tool. It provides performance data from AWS components and the applications running on the Amazon infrastructure. CloudWatch has basic monitoring that is free for AWS users, and it can be improved by paying an affordable price, which provides better features like more detailed monitoring, custom metrics and more. On the other hand, the user interface could be a little complex for users with no experience on this kind of tools.
Advantages:
- The free tier version (for AWS users) offers enough resources to perform basic monitoring of an application.
- Customizable dashboards to show metrics and graphs.
- Flexible low prices.
Disadvantages:
- It can be only used for AWS components and therefore for applications running only on Amazon servers. I found some scripts made by third parties to get metrics for non-AWS servers but they aren't an "official" solution and I haven't tested them.
- The user interface is not really friendly for data analysis making it difficult to perform data correlation.
- No transaction tracing.
- No memory usage metrics by default. A custom metric has to be configured in order to have this basic indicator monitored.
CloudWatch GUI:
Dynatrace APM
The Dynatrace tool offers performance monitoring and application management both in a SaaS model and on-premise. It supports multiple technologies, has deep transaction tracing, user experience monitoring (synthetic monitoring and real user monitoring) and network monitoring.
The best feature, in my opinion, is a one-agent component, which automatically detects all the server components and quickly starts reporting data in different levels, once it is installed. Even the page load time is reported, by injecting JavaScript into your web application.
Advantages:
- Easy installation and configuration.
- Free version enables having up to 5 servers monitored for an unlimited time, without functionalities or data retention limitations. Their number of visits is limited to 100k.
- Detects application topology, deployments and environment changes in real time.
- Great at transaction and process tracing.
Disadvantages:
- The user interface is a little complex, especially for users without experience on this tools.
- Pricing. Despite the fact that the free version is really good for small infrastructures (5 servers or less) the paid options have similar prices to New Relic.
DynaTrace GUI:

AppDynamics
A few years ago, this tool was the main modern software for APM monitoring. In my opinion, it shares the rank of some of the other tools of this post (since there is a tendency for all tools to support the same technologies and features), but it remains one of the most popular.
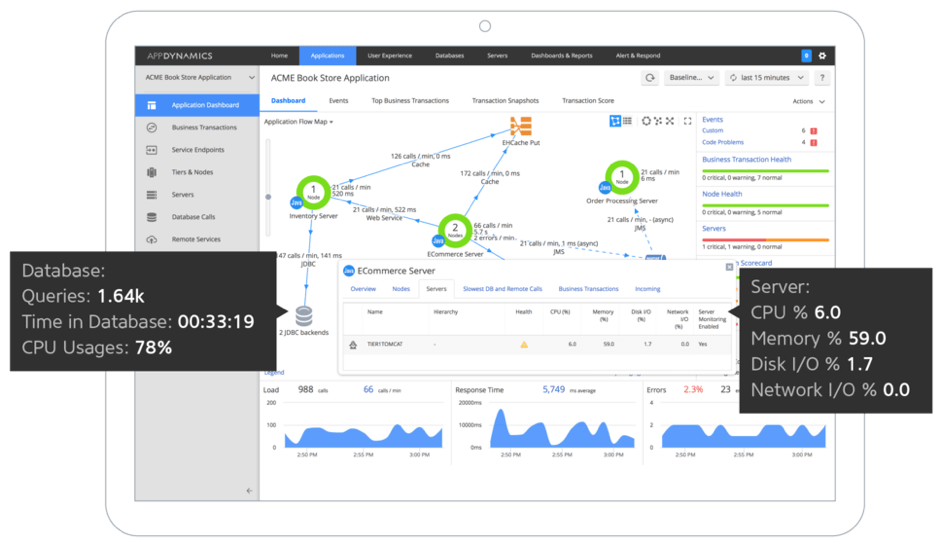
Looking at some of the AppDynamics features (like the main screen with the map of the services used with their call loads and health index, or the user-experience monitors), they give the impression that the tool monitoring priorities are larger enterprises with big infrastructures.
Advantages:
- Friendly user interface, with customizable dashboards
- Good server resources monitoring
- Enables transactions and process tracing
- Uses machine learning algorithms to set the baseline values to set the alarms
Disadvantages:
- Some of the tool features are based on Flash, and you can't use them without enabling it on the browser
- Pricing. What are the prices? AppDynamics doesn't have the prices published on the web page, you will have to contact sales to get a quote based on your needs.
AppDynamics GUI:
CA Technologies APM
According to various users' reviews, one of the main characteristics of the CA APM tool is that it is a flexible and customizable software: the company offers a support service that enables setting up specific monitoring and alerts for getting more accurate and useful data for each company-specific situation.
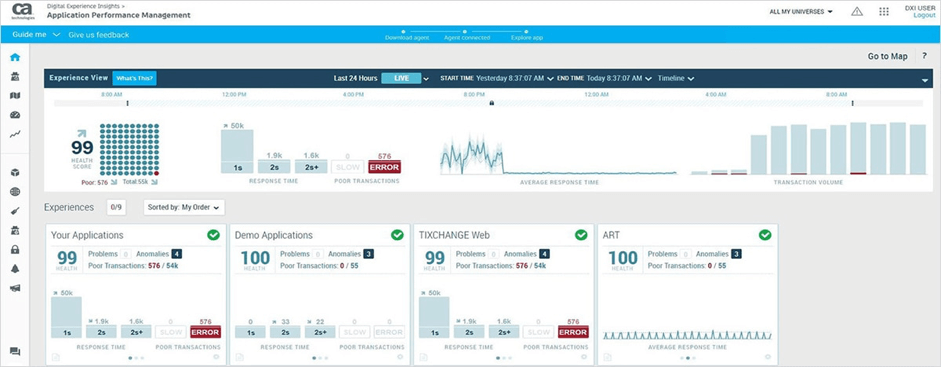
CA APM has customizable dashboards, multi-perspective views of end-user experience, automatic transaction traces, and many infrastructure resources metrics.
Advantages:
- A versatile tool, as CA company is willing to adapt the tool for customer needs
- The Team Center provides a customizable dashboard for quickly navigating the details to dig into the issues
- Enables transaction and process tracing
- Good support and community forum
Disadvantages:
- It may require quite a large learning curve, especially for people without experience in these kinds of tools.
- Prices may be a little high for small infrastructures.
CA APM GUI:
Conclusion and Comparison
As you are probably thinking, the conclusion of the post is that there is no definitive APM tool to choose over the others. When these tools first appeared they specialized in a certain area, but nowadays almost all of them cover all the main aspects needed in order to be a good APM tool.
The good news is that all of the reviewed APM tools can be integrated with BlazeMeter, a SaaS, open-source based continuous testing platform in order to improve tests' monitoring.
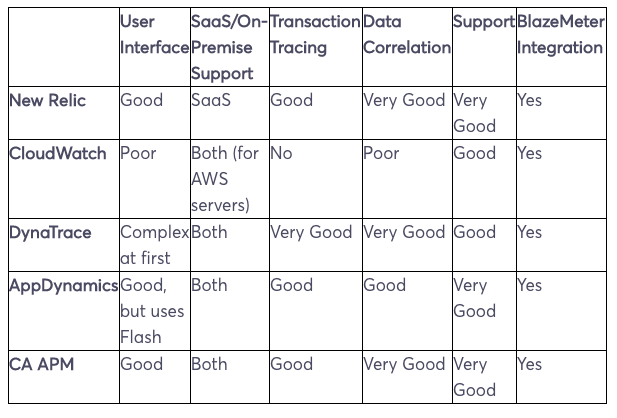
However, there are features that can help the user when making a final decision. The following table shows some of them based on my experience and online user's reviews.
By running your performance tests in BlazeMeter and then integrating BlazeMeter with the APM tool of your choice, you can test that your website, API or app is performing up to your standard. Create benchmark performance tests to run automatically after every build and every night and high scale load tests before big events like Black Friday or Open Enrollment, and your website, API and app will always be covered.
BlazeMeter lets you massively scale your tests, collaborate on tests and results, and is based on open-source technology.
Published at DZone with permission of Andrei Guchin, DZone MVB. See the original article here.
Opinions expressed by DZone contributors are their own.

Comments