AR By Hand (Part 2): Plane Detection
Learn AR by hand in this latest installment on plane detection.
Join the DZone community and get the full member experience.
Join For Free
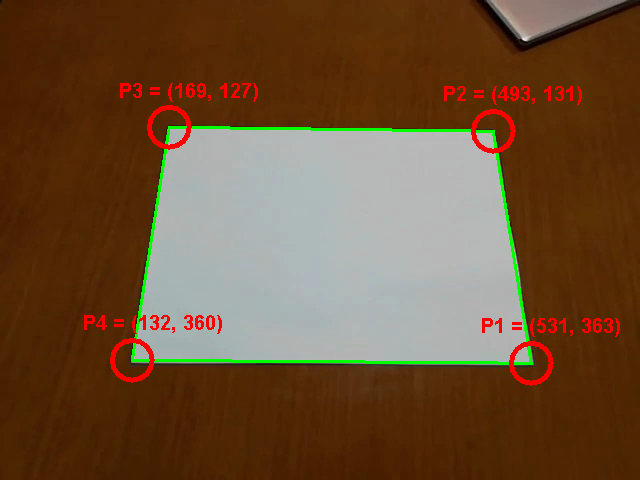
Welcome back to our AR series. The previous chapter introduced the whole project. This chapter will cover the first topic on the list: plane detection and tracking. At the end of this article, you will be able to identify the corner points of the A4 paper from the input image, in the right order so you can draw a rectangle contour in there. Example outcome of this chapter is in the following image.
The full implementation is available in the accompanying project. You can download it through the original article. The main class for this article is WhiteMarkerTracker. I would encourage you to look into the source code while reading the article. Now, let’s get into it.
Pre-Processing
Pre-processing is the first phase in image processing. The goal of the pre-processing is to clean up the image and extract only the information usable in the further phase. Since, in many cases, this phase has to go through every pixel of the image, only relatively simple operations can be performed. The result is a list of “features” (you will see what this word means in a little bit) useful for more detailed processing. And many times, it’s desirable to have a much smaller number of features than the number of pixels.
In our case, the goal is to identify the white rectangle. And the good way to start is by identifying the pixels lying on the edge of the white area. That pixels are the “features” in this particular context. And they can be extracted by the following process.
- Threshold pixel by the color (white color must have red, green and blue components high enough).
- Identify all the connected areas (blobs).
- Pick up the biggest blob (assuming the marker paper is the dominant white object in the image) and throw away all the others. This cleans certain artifacts.
- If the biggest blob doesn’t have enough volume (means number of pixels), then exit.
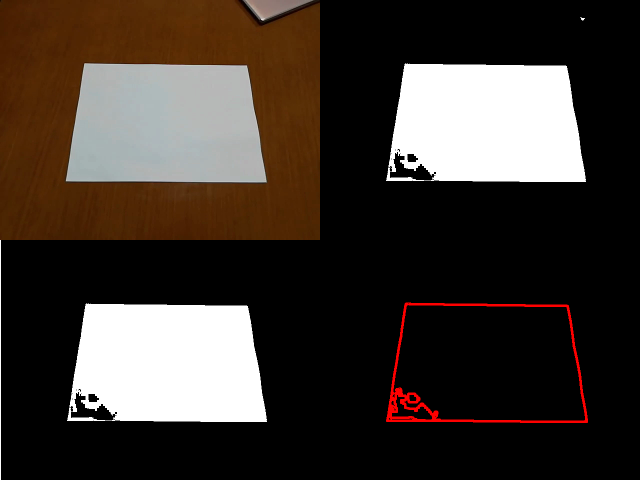
- Identify contour points of the blob. These are the white pixels next to the black pixel.
The result is a set of contour points, illustrated in the image below. To give you rough numbers, the input image has 640×480 pixels, which is slightly over 300,000 pixels in total. Pre-processing chooses, given reasonable input, less than 3,000 pixels. This reduces the amount of data by the factor of 1,000.
Let me add one more note. Based on the way you acquire the input image, you might need to apply additional operation(s) like Gaussian smoothing to get the reasonable contour. I have used an image from a video sequence, where compression algorithm already did a similar job. Therefore, it wasn’t necessary in my case.
Once contour pixels are selected, then the next phase can start.
Detection
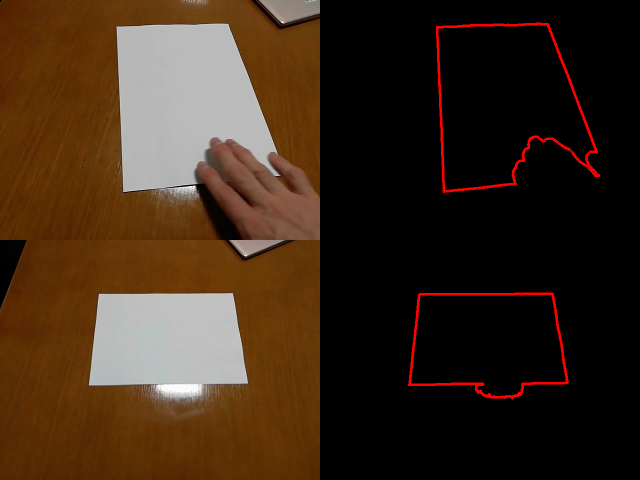
Now, you have a set of contour pixels. So what to do with them? Although you can see they mostly form the edges of the marker paper, there are still some errors. In addition, they are just pixels, which doesn’t tell the position of the corner points. And in some cases, corner points locations might be not that well defined. Like in the following image.
Detection algorithm first identifies four edge lines and then calculates the corner positions from the intersections. Note that there are several points on the way where the algorithm can fail to detect something. In such a case, it reports that there wasn’t anything detected.
Edge Lines
The good method for identifying edge lines, while having errors and outliers in there, is RANSAC (Random Sample Consensus). The general RANSAC workflow is following.
- Repeat N times (N is up to you)
- Randomly choose a minimal number of points you need to build the model
- Build the model from chosen points
- Compare the model with other sample points and calculate the number of good fits (inliers, or points which are close enough to the expected positions)
- If the number of inliers is high enough, then accept the model and terminate the cycle
- You either have a model, or there is a high probability that the model doesn’t exist
Now, it's more concrete for the edges of the marker paper. The main difference is that we want to find four lines lying as much as possible over the contour points. For this, it is necessary to choose the maximal number of iterations we are willing to take (N), the minimum number of points lying “close enough” to the line in order to accept the line (minAccept– good is to use % of the total number of sample points), and distance from the line which is considered as “close enough” (dstThres). The full algorithm is in the class Fitting, method linesRansac. Here is just a brief description.
- Start with empty result list
- Repeat max N times, stop if result list has desired a number of lines (four in this case)
- Pick up two different random points from the sample set
- Build the line
- Calculate the number of inliers (max distance from the line is
dstThres) - If the number of inliers is greater or equal to the
minAcceptparameter, then- Add the line to the result list
- Remove inliers from the sample set (to prevent the same line being detected again)
- Return the result list
If you run this algorithm, then you will “ideally” (I will get back to the word “ideally” later in this chapter) end up with lines like in this image.
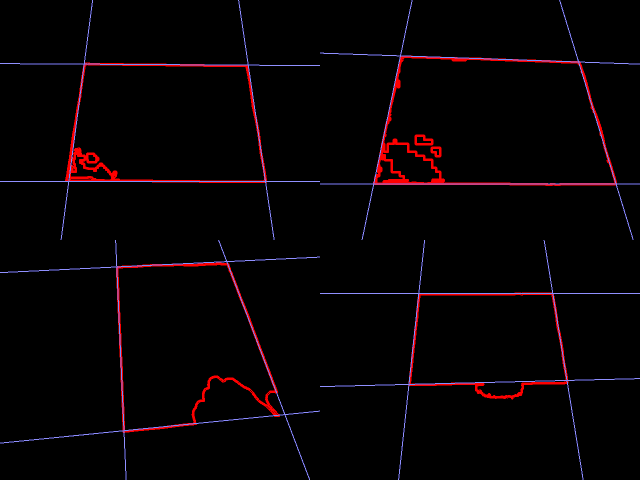
You see, RANSAC is tolerant of the various form of distractions. All you need is to have enough number of sample points being “close enough.” Now, once edge lines are known, the final shape can be extracted.
Paper Shape
Going from edges to the corner points is a matter of identifying which lines are perpendicular, calculating intersections and ordering them counter-clockwise. The full implementation is in the WhiteMarkerTracker class, method extractPoints.
Identifying the perpendicular lines is possible by the angle examination because we know that the rectangle has two sets of two parallel lines. If you select any edge line, then the parallel line will always have the smallest angle in between. And two perpendicular lines are the remaining lines, which are not the parallel one. The angle between the lines is possible to calculate from the line equations. The same for the intersection. The ordering of the points just requires to use a little bit of vector algebra and messing around.
If everything is done, then you should be able to see the image like this one.

So, are we done? Not so fast…
RANSAC Problems
Remember, before I mentioned the word “ideally”? This part is all about that.
Let’s make a little experiment. Let’s take the example image from this chapter and make a 200 frames video out of it. In every frame, let’s perform the plane detection as described so far and follow up by estimating AR parameters and draw a 3D cube on top of the plane (don’t worry if you don’t know how to do this yet). This is what the result would look like:

The cube is shaking, although it should stay still. In addition, there are several frames which are completely wrong. This is caused by the nature of the RANSAC method. RANSAC is a probabilistic method which randomly selects points to create a model. This has two consequences.
- Every estimation is slightly different, although most of them are reasonably good. This is the reason for shaking. Especially because the errors are summing up on the way.
- There is a small chance that some model is wrong yet still fits enough points to be accepted. This is the reason for several frames being totally wrong.
To be more illustrative, let’s see how the current line detection looks like.

At this image, you can clearly see that two RANSAC detections of the same line might be both reasonably good, yet slightly different. This is the root cause of the shaking cube in the previous video. Also, time to time, you can see the miss-detection causing single edge being detected twice. This is the root cause of the cube being rendered in the wrong position.
How to improve that?
Stabilization With Tracking
Although simple RANSAC method isn’t good enough to produce a good result, it’s still a reasonable start. Therefore, let’s use the initial detection and enhance it.
There are two enhancements (both are implemented inside WhiteMarkerTracker class, method trackMarker).
- Track the previously detected shape
- Smooth the estimation by averaging
First, let’s discuss the tracking. Tracking is done frame-by-frame. In each frame, the algorithm knows the parameters of the old object (four corner points in this case) and the new observations (contour points in this case). The result is either an updated parameter set or report that the object has been lost.
This implementation works by tracking edges one by one and then putting them together. Assuming that edges move between two frames doesn’t change significantly. Corner points are used to define an area, where the edge is expected to be. This reduces the number of contour points and, therefore, allows us to require a higher percentage of inliers for the RANSAC estimation. Like in the image below.
![]()
Now regarding the smoothing. Smoothing is normally achieved by averaging. Therefore, for every tracked line, let RANSAC estimate M good fits for that line, rather than just one. Then take the set of points, where each is close enough to at least one of these good fits. Make the final line as a least-square fit from that set of points.
When you put everything together, then the result would look like this video.
Summary
This chapter explained to you how to track A4 marker paper in the video. The next chapter will use the outcome to build up a homography. Stay tuned!
Published at DZone with permission of Radek Hecl. See the original article here.
Opinions expressed by DZone contributors are their own.
Comments