Architect Data Analytics Engine for Your Business Using AWS and Serverless
This article shows the approach to architectural design that you can use at your organization to start the data journey and quickly get results.
Join the DZone community and get the full member experience.
Join For FreeThis article was authored by AWS Sr. Developer Advocate, Wojciech Gawronski, and AWS Sr. Solution Architect, Lukasz Panusz, published with permission.
According to the estimates, by 2030, humans will generate an ocean of data up to 572 zettabytes, which is equal to 572 million petabytes. This poses the question: How can you prepare IT infrastructures for that without inflating infrastructure costs and spending hours on maintenance? Secondly, how can organizations start producing insights from gathered information without worrying about capacity planning, infrastructure, and operational complexities? One of the answers is by using Serverless Data Analytics in AWS Cloud.
Hands-on exercise is available under “The Serverless Future of Cloud Data Analytics” workshop, while this article shows the approach to architectural design that you can use at your organization to start the data journey and quickly get results.
Start From a Business Case
Imagine that you are part of the technical team driving the growth of Serverlesspresso startup. It is a company that created an interactive and innovative way to deliver coffee at IT events (in fact it was introduced during AWS re:Invent 2021). Developers are well-known for their caffeine thirst, and the market size grows remarkably. To reflect the high dynamics of the business platform, it was built using purely serverless services from AWS.
The advantages of such an approach, among others, are:
- Ability to scale down to 0 between IT events, limiting the costs and required maintenance effort
- No infrastructure to manage - only configuration
- Applied evolutionary architecture, enabling rapid expandability of the platform with new features
It’s great, but as stated in the introduction – what about data? To grow the business, at some point you will have to implement a data strategy. An engine that will be able not only to produce tangible, actionable business insights, but also will be a solution to retain historical information about IT events, collect new data, dynamically adjust to the current traffic, and provide an automated way of pre-processing and analyzing information.
Break It Down Into Smaller Puzzles
Knowing the business context, you have to approach the design phase, which will lead to implementation. The act of architecting for solutions is a process: a process that focuses on making the best possible decisions to meet business expectations with the technology. To make the process efficient and less complex, it is worth breaking the Data Analytics Engine into smaller pieces. There are a few riddles that you have to solve.

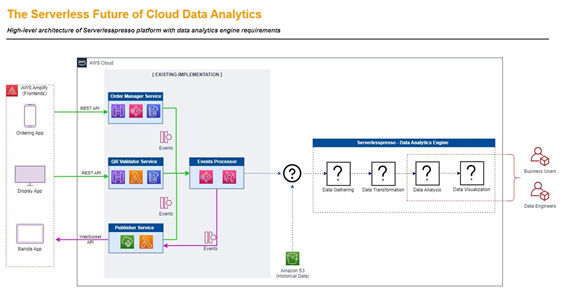
Look at the diagram above. On the left, you can see existing implementation - a system that generates events connected with coffee orders, preparation, and distribution. On the side, you have collected historical data, which is stored in Amazon S3. The new part that you have to design and implement is on the right. Inside you can quickly spot 4 question marks, which are:
- Data Gathering – How do you efficiently acquire the data from various data sources? Where do you save them?
- Data Transformation – How do you combine incoming information from various sources, in various formats into one, common schema? How do you enrich the data to increase their quality and usability?
- Data Analysis – Are the data collections self-explanatory? How do you build new aggregates that will build new perspective and put more light into trends or speed up reports’ generation?
- Data Visualization – What is the best way to present? What kind of data should be tracked in real-time versus data going into last month's activity reports?
The questions above are just examples to help you to design the best possible solution. One big thing that remains on the side is: what data storage should you use? Should it be a data lake, data warehouse, regular database, or NoSQL?
Building a Frame
When designing modern data solutions that have to work at scale, fueling different areas of business and technology, it is worth thinking about data lakes. In short, a data lake is a central location, where you can store data incoming from any number of channels, of any size and format. The difference compared to data warehouses is the lack of necessity for schema planning, as well as for the relations of the data. This loose approach without schema introduces flexibility.
Do you remember the stages we have to design in data analytics solutions? It is a good practice to create a few data layers that have named responsibilities and handle certain stages of data processing. For example:
- Data Gathering stage – This will upload unchanged, original data to the raw layer inside the data lake. It will give two main benefits: improved data quality control through separation, along with the ability to parallelize data processing to fuel different parts of the organization with a variety of data.
- Data Transformation stage – This is a one-way process that starts from a raw layer in the data lake and can perform several operations: cleanup, deduplication, enrichment, joins, etc. The output from the operation should be loaded to a cleaned or enriched layer in the data lake. This is the central source of information for the rest of the platform and other systems.
- Data Analysis & Visualisation stage – Depending on the technology and type of analysis, we can decide to further enrich the data, and load them to a data warehouse, relational database, or external tool. The entry point is always from the enriched layer of the data lake. The final destination depends on the use case.
Once you are clear with data strategy, including stages of processing, access rights for people and applications, steps in transformation, communication, and data flows, you are set to implement the actual solution.
Data Acquisition
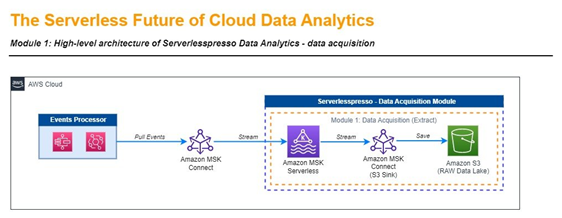
In the first step, you have to capture incoming coffee events as they appear and save them to a raw layer inside the data lake. To accelerate the setup you can use Amazon MSK Serverless service. It was designed to give an easy way to run Apache Kafka. MSK Serverless automatically provisions and scales compute and storage resources, so you can use it on demand and pay for the data you stream and retain.

To actually implement a fully automated process that will capture events from your system in near-real time and then save them to the data lake, you have to configure Kafka Connect. You can imagine a connector as an agent that works on your behalf, knowing how to connect to the data producers (your system) and send data to Kafka topics. On the other end of the topic (data pipe) is another connector (agent) knowing how to communicate with Amazon S3 – which is a foundation for our layered data lake.
You have 3 main ways to configure connectors and connect them to the existing Amazon MSK serverless cluster:
- Run Kafka Connect connectors via AWS Fargate service - You can push containerized connectors to the containers repository and run it using the serverless solution. It will be both an operational and cost-efficient solution.
- Run Kafka Connect connectors via Amazon MSK Connect - This is a native approach and wizard-driven configuration. It is serverless, managed, and straightforward. You could offload all operational and infrastructure-heavy lifting to AWS.
- Run Kafka Connect connectors via container on infrastructure managed by you - This may be a decent approach for testing and learning, but it is not sustainable for production use cases. The events' acquisition will stop if your instance terminates.
Data Transformation
When data acquisition is working and capturing coffee events in near-real time, you should look into the information they carry. Understanding data quality, correlations, and possible enrichment is a crucial part of designing the data transformation part of your data engine.
Imagine: raw data can contain only IDs and other alphanumeric values, from which would be very difficult to derive meaning. This is typical, as systems are designed to work on lightweight events, to serve thousands of requests per second without any delay. It means that a raw layer provides little to no value in terms of business insights at this moment.
One way to overcome such a challenge is to build metadata stores explaining the meaning of the fields as well as dictionaries giving you the opportunity to make data readable.

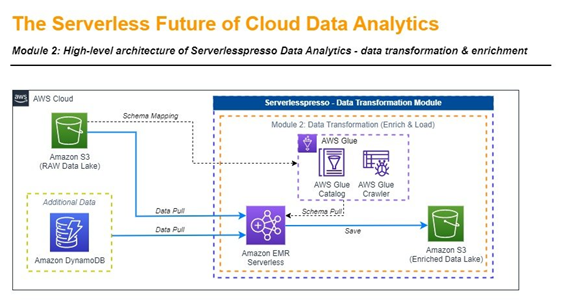
The diagram above is an example of such implementation. Amazon DynamoDB stores dictionaries and all additional data that can be used in the transformation. As you can see the data flow is straightforward. You start with pulling the data from the raw layer, process it with dedicated jobs that implement the logic, and then save it to a separate layer inside the data lake. How does this automation work under the hood?
- Automated schema discovery with AWS Glue – In the first step you have to be able to create mapping of existing information in your raw layer of the data lake. Although we said that data can be unstructured and in various formats, you need to know what fields are available across data sets to be able to perform any kind of operation. AWS Glue is a serverless data integration service that makes it easier to discover, prepare, move, and integrate data from multiple sources for analytics, machine learning (ML), and application development. In this case, the crawler is run automatically each 1h to catalog schemas.
- Enriching the data with Amazon EMR Serverless – This option in Amazon EMR enables data analysts and engineers to run open-source big data analytics frameworks without configuring, managing, and scaling clusters or servers. By taking Apache Spark (a distributed processing framework and programming model helping with ML, stream processing, or graph analytics) and implementing the logic for data joins, deduplication, replacement of IDs with meaningful dictionary values, and transforming the final data set to Apache Parquet (binary, column-based format designed to deliver the best performance for analytical operations), you will be able to create collection ready for the final stage: analysis.
Output from the job is saved to the enriched layer in the data lake. As the process is serverless, you don’t have to manage the underlying infrastructure. After configuring basic parameters and setting job triggers (frequency) the process will work on the information enrichment in a fully automated way.
Data Warehouse and Visualization
The data acquisition and transformation pipeline you’ve built provides a strong foundation for the final step, which is data analysis. Having all of the coffee events in the data lake in an enriched format, you have to find a way to efficiently query them and gain business insights. Among many possibilities, the use of flexible Cloud Data Warehouse seems to fit the purpose.

A data warehouse is a central repository of information that can be analyzed to make more informed decisions. Data flows into it on a regular cadence or on demand. Business users rely on reports, dashboards, and analytics tools to extract insights from their data, monitor business performance, and support decision-making.
A data warehouse architecture is made up of tiers. The top tier is the front-end client that presents reporting, the middle tier consists of the analytics engine used to access and analyze the data, and the bottom tier of the architecture is the database server, where data is loaded and stored. Within a data warehouse, we operate on facts and dimensions, where:
- Facts - These are measured events related to the business or functionality. It is quantitative information associated with time: e.g., people visiting Serverlesspresso booths at the event and ordering coffee are our business areas, therefore their coffee orders flowing into the system during the duration of the event are facts.
- Dimensions - These are collections of information about facts. They categorize and describe facts records, which allows them to provide descriptive answers to business questions. Dimensions act as lightweight dictionaries with a small number of rows, so their impact on performance is low. They have numerous attributes, which are mainly textual or temporal. Those attributes are used in the analysis phase to view the facts from various angles and to provide filtering criteria; e.g., IT event meta-data like event name, start time, date, number of attendees, etc.
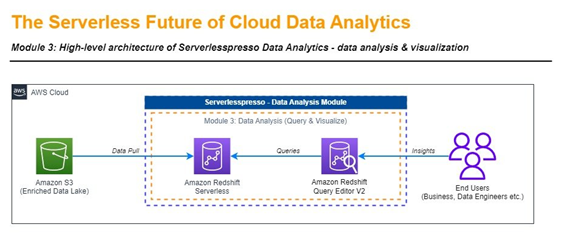
Amazon Redshift Serverless visible on the diagram makes it easy for you to run petabyte-scale analytics in seconds to get rapid insights without having to configure and manage your data warehouse clusters. Amazon Redshift Serverless automatically provisions and scales the data warehouse capacity to deliver high performance for demanding and unpredictable workloads, and you pay only for the resources you use.
Once you load the data from the enriched layer inside the data lake to your data warehouse, you have 3 basic options for how to quickly plug and work on the analysis:
- Connect via PostgreSQL client called psql (or any other JDBC-compatible client) from a terminal session connected to a data warehouse, and write relevant OLAP queries.
- Use Amazon Redshift Query Editor v2.0 to connect and write relevant queries.
- Connect Amazon QuickSight with the data warehouse as a data source, and explore and visualize the available data via Amazon QuickSight Analysis.
Successful implementation of the three stages described above automates the process of data acquisition, processing, and analysis to the point, where you can start answering business questions such as:
- How many coffee cups have been distributed so far and per event basis?
- What percentage of delivered, brewed, and not delivered, or completely lost orders has your business had so far?
- What is the average total lead time (order-to-delivery) and total brewing time (order-to-brew)?
Modern Data Analytics Insights
You don’t have to have massive volumes of data to start generating insights for your business. The presented approach is strongly based on the evolutionary approach - start small and grow, ensuring that each evolution brings additional business value. AWS Cloud and Serverless enable organizations in their data journeys: you don’t have to have an army of scientists and infrastructure support to start collecting, processing, and getting value out of data that your systems already have. Reduced effort in maintenance, configuration, and monitoring of the infrastructure, automated transformations, and processing, saves time allowing more experimentation.
The approach described in this article is one of the possibilities. The design of such solutions should always start from the actual business case. If you are curious and want to learn through hands-on exercise visit “The Serverless Future of Cloud Data Analytics” workshop.
Opinions expressed by DZone contributors are their own.

Comments