How to Document Your AWS Cloud Infrastructure Using Multicloud-Diagrams Framework
This article explores the importance of infrastructure diagrams, introduces the multicloud-diagrams framework, and explains the concept of Diagrams-as-code.
Join the DZone community and get the full member experience.
Join For FreeThe Importance of Infrastructure Diagrams in Architecture
In the world of cloud computing and complex distributed systems, creating infrastructure diagrams is vital for understanding, designing, and communicating the architecture of our applications. These diagrams serve as visual blueprints that help teams grasp the layout, connections, and workflows within their systems. They also play a crucial role in documentation, troubleshooting, and scaling operations.
This article explores the importance of infrastructure diagrams, introduces the multicloud-diagrams framework, and explains the concept of Diagrams as Code. We will use AWS cloud nodes and services, but on-prem nodes are also available for usage.
Missing Infra Architecture Diagrams on Multiple Projects
You have seen many projects where there is no documentation, no diagram of inter-service communication, or storage systems. As a result, the system is a snowball that runs from the mountain. New engineers that are onboarded can not see the end-to-end picture. This creates issues that some services are duplicated: functionality is very often duplicated or even contra-versional and is spread across multiple units and services.
All of these issues create a big pain to develop new features, plan, and optimize the system. There are multiple reasons why it can happen: a large contention of engineers, work in startup mode, too-long running PoC that became a production one day, etc.
Documenting Infrastructure Is the Same Activity as Coding
Let's take a look at the multicloud-diagrams framework that allows us to define our infrastructure as code, manage it under a version control system, generate diagrams in Draw.io vector editable format, and compile them into any type of images (PNG, jpg, etc.).
We will go through the needed steps to bootstrap and use multicloud-diagrams. This framework supports several modes: programmatic generation of AWS nodes, generating diagrams from Diagrams as Code declaration, and ingesting data from UML.
In this article, we will take a look at the multicloud-diagrams framework, explore how to set it up, define our infrastructure as code, and manage it.
Step 1: Project Bootstrap
In the following example we will use poetry (a more modern dependency management system) to onboard a new project with infra diagrams, but if you prefer using pip, similar actions and dependencies are available:
$ poetry init

This command will guide you through creating your pyproject.toml config.

Package name [diagrams]:  aws-infra
Version [0.1.0]:
Description []:
Author [Roman Tsypuk <[email protected]>, n to skip]:
License []:
Compatible Python versions [^3.11]:

Would you like to define your main dependencies interactively? (yes/no) [yes]
You can specify a package in the following forms:
  - A single name (requests): this will search for matches on PyPI
  - A name and a constraint (requests@^2.23.0)
  - A git url (git+https://github.com/python-poetry/poetry.git)
  - A git url with a revision (git+https://github.com/python-poetry/poetry.git#develop)
  - A file path (../my-package/my-package.whl)
  - A directory (../my-package/)
  - A url (https://example.com/packages/my-package-0.1.0.tar.gz)

Package to add or search for (leave blank to skip):

Would you like to define your development dependencies interactively? (yes/no) [yes]
Package to add or search for (leave blank to skip):

Generated file

[tool.poetry]
name = "aws-infra"
version = "0.1.0"
description = ""
authors = ["Roman Tsypuk <[email protected]>"]
readme = "README.md"
packages = [{include = "aws_infra"}]

[tool.poetry.dependencies]
python = "^3.11"


[build-system]
requires = ["poetry-core"]
build-backend = "poetry.core.masonry.api"$poetry add multicloud-diagrams
Creating virtualenv aws-infra-mfUpPtUH-py3.11 in /Users/rtsypuk/Library/Caches/pypoetry/virtualenvs
Using version ^0.3.91 for multicloud-diagrams
Updating dependencies
Resolving dependencies... (0.9s)
Writing lock file
Package operations: 7 installs, 0 updates, 0 removals
• Installing certifi (2024.7.4)
• Installing charset-normalizer (3.3.2)
• Installing idna (3.7)
• Installing urllib3 (2.2.2)
• Installing pyyaml (6.0.2)
• Installing requests (2.32.3)
• Installing multicloud-diagrams (0.3.91)Step 2: Declaring Service, Storage, and Streaming System
In multicloud-diagrams, all entities are divided into 2 categories:
- Nodes (vertex)
- Edges (connections)
Let's add a declaration of the first 3 AWS ECS services into the first YAML file l1-service.yml.
vertices:
  - name: service1
    type: ecs_service
    id: service1
  - name: service2
    type: ecs_service
    id: service2
  - name: service3
    type: ecs_service
    id: service3
edges:
  - { src: service1, dst: service2, label: http, link_type: uni }
First, we define services. Each should have a name (defined based on your context) and type (based on the type that will be rendered particular service node, a full list of supported types is on the official framework page).
Declaration of connections between services is done in the edges section. Each edge requires 2 vertex_ids and optional metainfo.
Let's define the storage level with 3 DynamoDB tables in the next YAML file, l2-data.yml:
vertices:
  - name: Table1
    type: dynamo
    id: Table1
  - name: Table2
    type: dynamo
    id: Table2
  - name: Table3
    type: dynamo
    id: Table3
edges:
  - { src: service1, dst: Table1, label: uses, link_type: uni }
  - { src: service2, dst: Table2, label: uses, link_type: uni }
  - { src: service2, dst: Table3, label: uses, link_type: uni }
In the last YAML file, we will move streaming components that are based on AWS SQS:
vertices:
  - name: sqs1
    type: sqs
    id: sqs1
edges:
  - { src: service3, dst: sqs1, label: sends, link_type: uni }
  - { src: sqs1, dst: service1, label: sends, link_type: uni }
Step 3: Build the Target Infrastructure Diagram
Now it is time to create a Python script that will build diagrams based on our definitions. Such a script can be invoked by any trigger, like GitHub Actions on infra code updates, pushed or on demand.
from multicloud_diagrams import MultiCloudDiagrams, Settings


def main():
    mcd = MultiCloudDiagrams(Settings(hide_id=True))

    prefix = 'prod'
    result_file = f'./output/output.{prefix}_layers.drawio'

    mcd.add_layer("services")
    mcd.augment_from_yaml('l1-services.yml')

    mcd.add_layer("data")
    mcd.augment_from_yaml('l2-data.yml')

    mcd.add_layer("streaming")
    mcd.augment_from_yaml('l3-stream.yml')

    mcd.export_to_file(result_file)


if __name__ == "__main__":
    main()
After running the script we will see newly generated output.prod_layers.drawio:
-rw-r--r--   aws_layers.py
-rw-r--r--   l1-services.yml
-rw-r--r--   l2-data.yml
-rw-r--r--   l3-stream.yml
-rw-r--r--   output.prod_layers.drawio
-rw-r--r--   poetry.lock
-rw-r--r--   pyproject.toml
Since this is a first generation, all elements are connected based on our edge declaration, but all nodes are positioned in the center of the pallet.
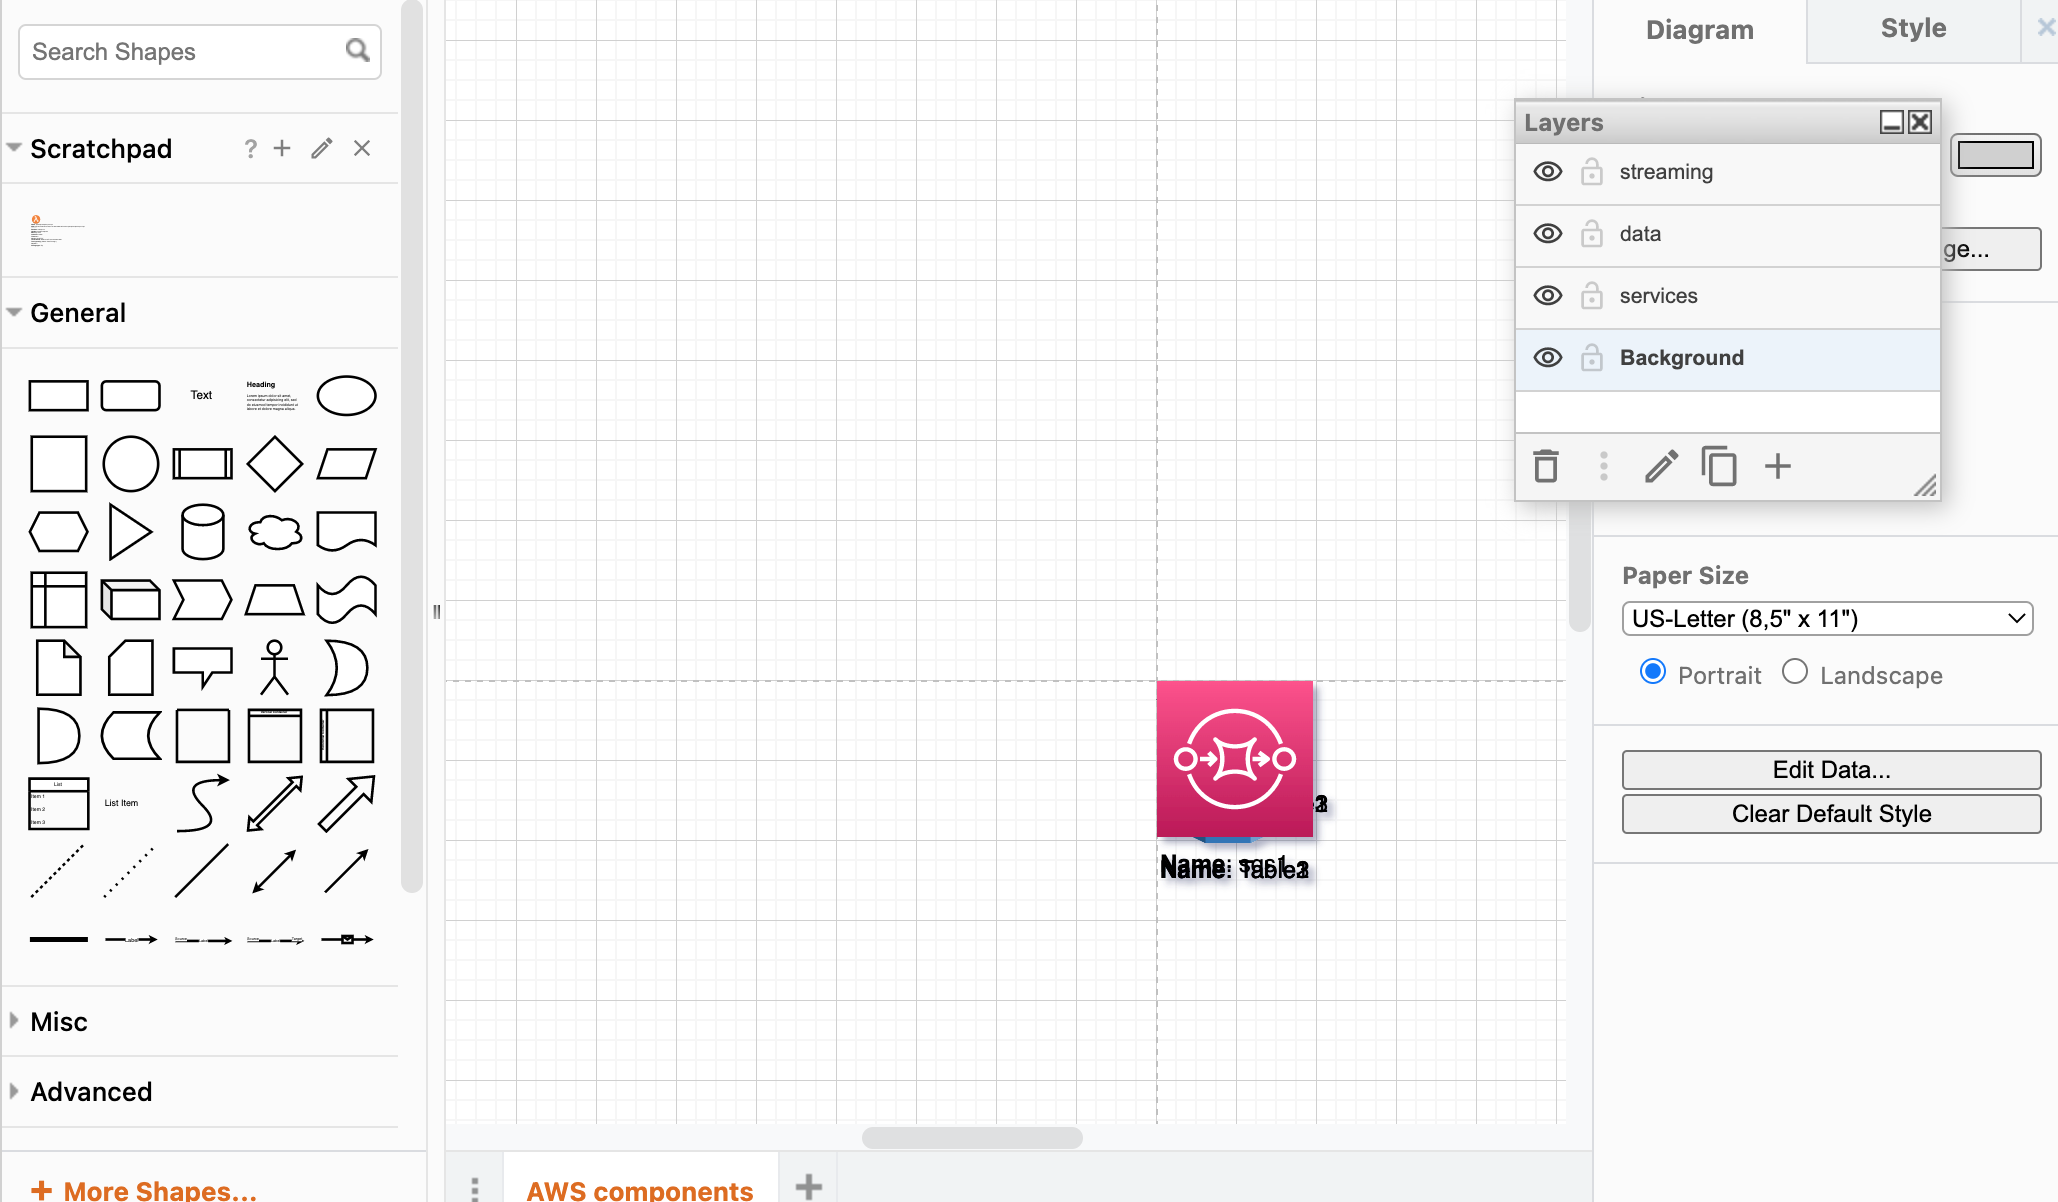
Image 1: All nodes are in the middle, Layers per each DaC-file.
Step 4: Adjust Components' Position on Layout
We need to drag-and-drop and position nodes based on our preferences or infra type. By the way, Draw.io has pre-built functions that allow group/position elements automatically.
This is a compiled Draw.io-compatible vector format based on our declarations. First of all, there are layers, and each layer has only its own components that we have split per each DaC YAML file. Such division can be based on domain, service types, part of your system (ingestion, processing, analytics), etc. Secondly, this is a Draw.io-compatible representation, where you can move elements, show/hide layers, and export to any other format. And the main advantage is that elements positioning is made by you as a system designer: "I am an artist, and I see it this way." :)
This is a great advantage of multicloud-diagrams, because other frameworks compile raster form (like JPG, etc.) and you can not change the positioning of elements.
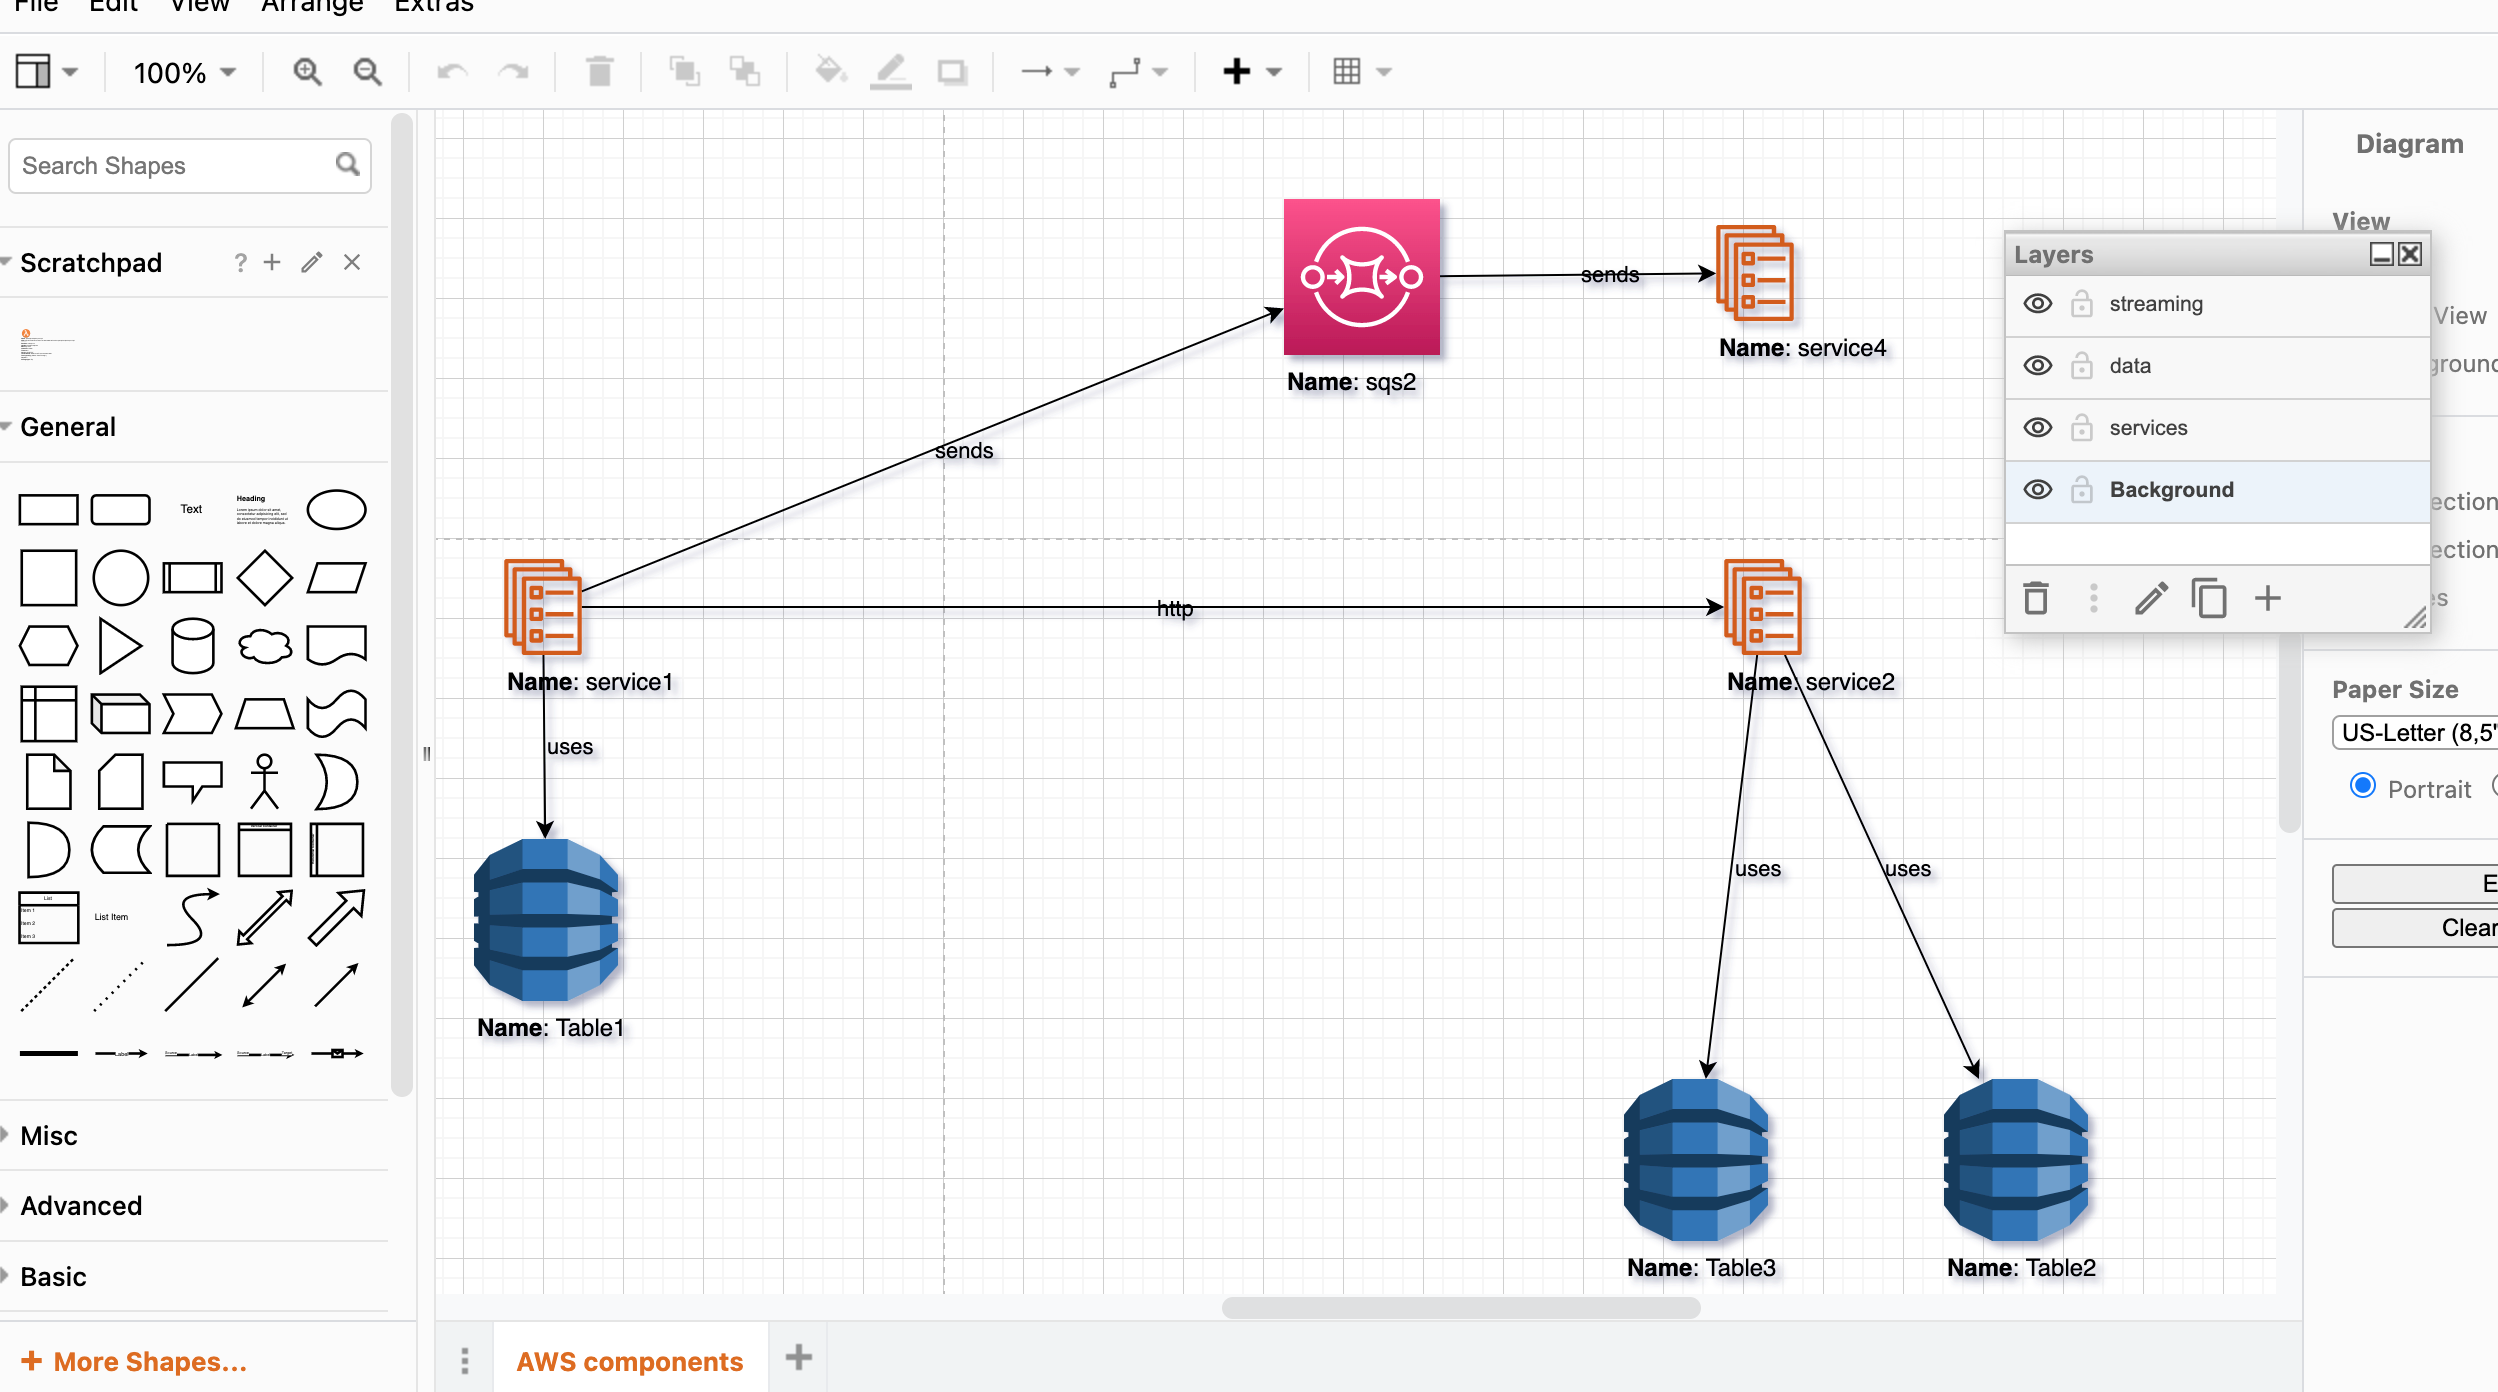
Image 2: Positioned Nodes, Diagram with Layers
Step 5: Reuse Nodes Positions From Previous Diagram Version
After reviewing and positioning the diagram, we have to add a few lines of code into our main script that will before invoked on every next generation: read coordinates from the previous version and reposition existing elements under the same coordinates.
result_file = f'./output.{prefix}_layers.drawio'
mcd.read_coords_from_file(result_file)
Both infrastructure declarations (layers) and the Draw.io diagram are now ready to be committed to a version control system. They should be reviewed and tracked as any code we manage. Also, by using history, it is easy to track system evolution or refactoring. Now any changes are persistent and reusable.
Step 6: Apply the History Repository
Adding one more instruction just before running the export operation will allow not only to update the latest version of the diagram but also to keep the history of all mutations of the diagram under the repository folder.
mcd.update_history_repo(result_file)
mcd.export_to_file(result_file)
Additional folder history now will contain all snapshots of dedicated versions. The main Draw.io file always contains the latest version.
tree -f
.
├── ./aws_layers.py
├── ./history
│   └── ./history/2024
│       └── ./history/2024/08
│           └── ./history/2024/08/output.prod_layers.20240811.125438.drawio
├── ./l1-services.yml
├── ./l2-data.yml
├── ./l3-stream.yml
├── ./output.prod_layers.drawio
├── ./poetry.lock
└── ./pyproject.toml
Step 7: Continue Adding More Nodes, Edges
A new service, service4, was added to our infra and we need to update the diagrams. service1 pushed messages to SQS and service4 is a consumer of this message.
Let's add one more service to list of services definition:
  - name: service4
    type: ecs_service
    id: service4
Also define new SQS and connections between services:
vertices:
  - name: sqs1
    type: sqs
    id: sqs1
  - name: sqs2
    type: sqs
    id: sqs2
edges:
  - { src: service3, dst: sqs1, label: sends, link_type: uni }
  - { src: service1, dst: sqs2, label: sends, link_type: uni }
  - { src: sqs2, dst: service4, label: sends, link_type: uni }
  - { src: sqs1, dst: service1, label: sends, link_type: uni }
And after running multicloud-diagram, we have updated the latest infra diagram.
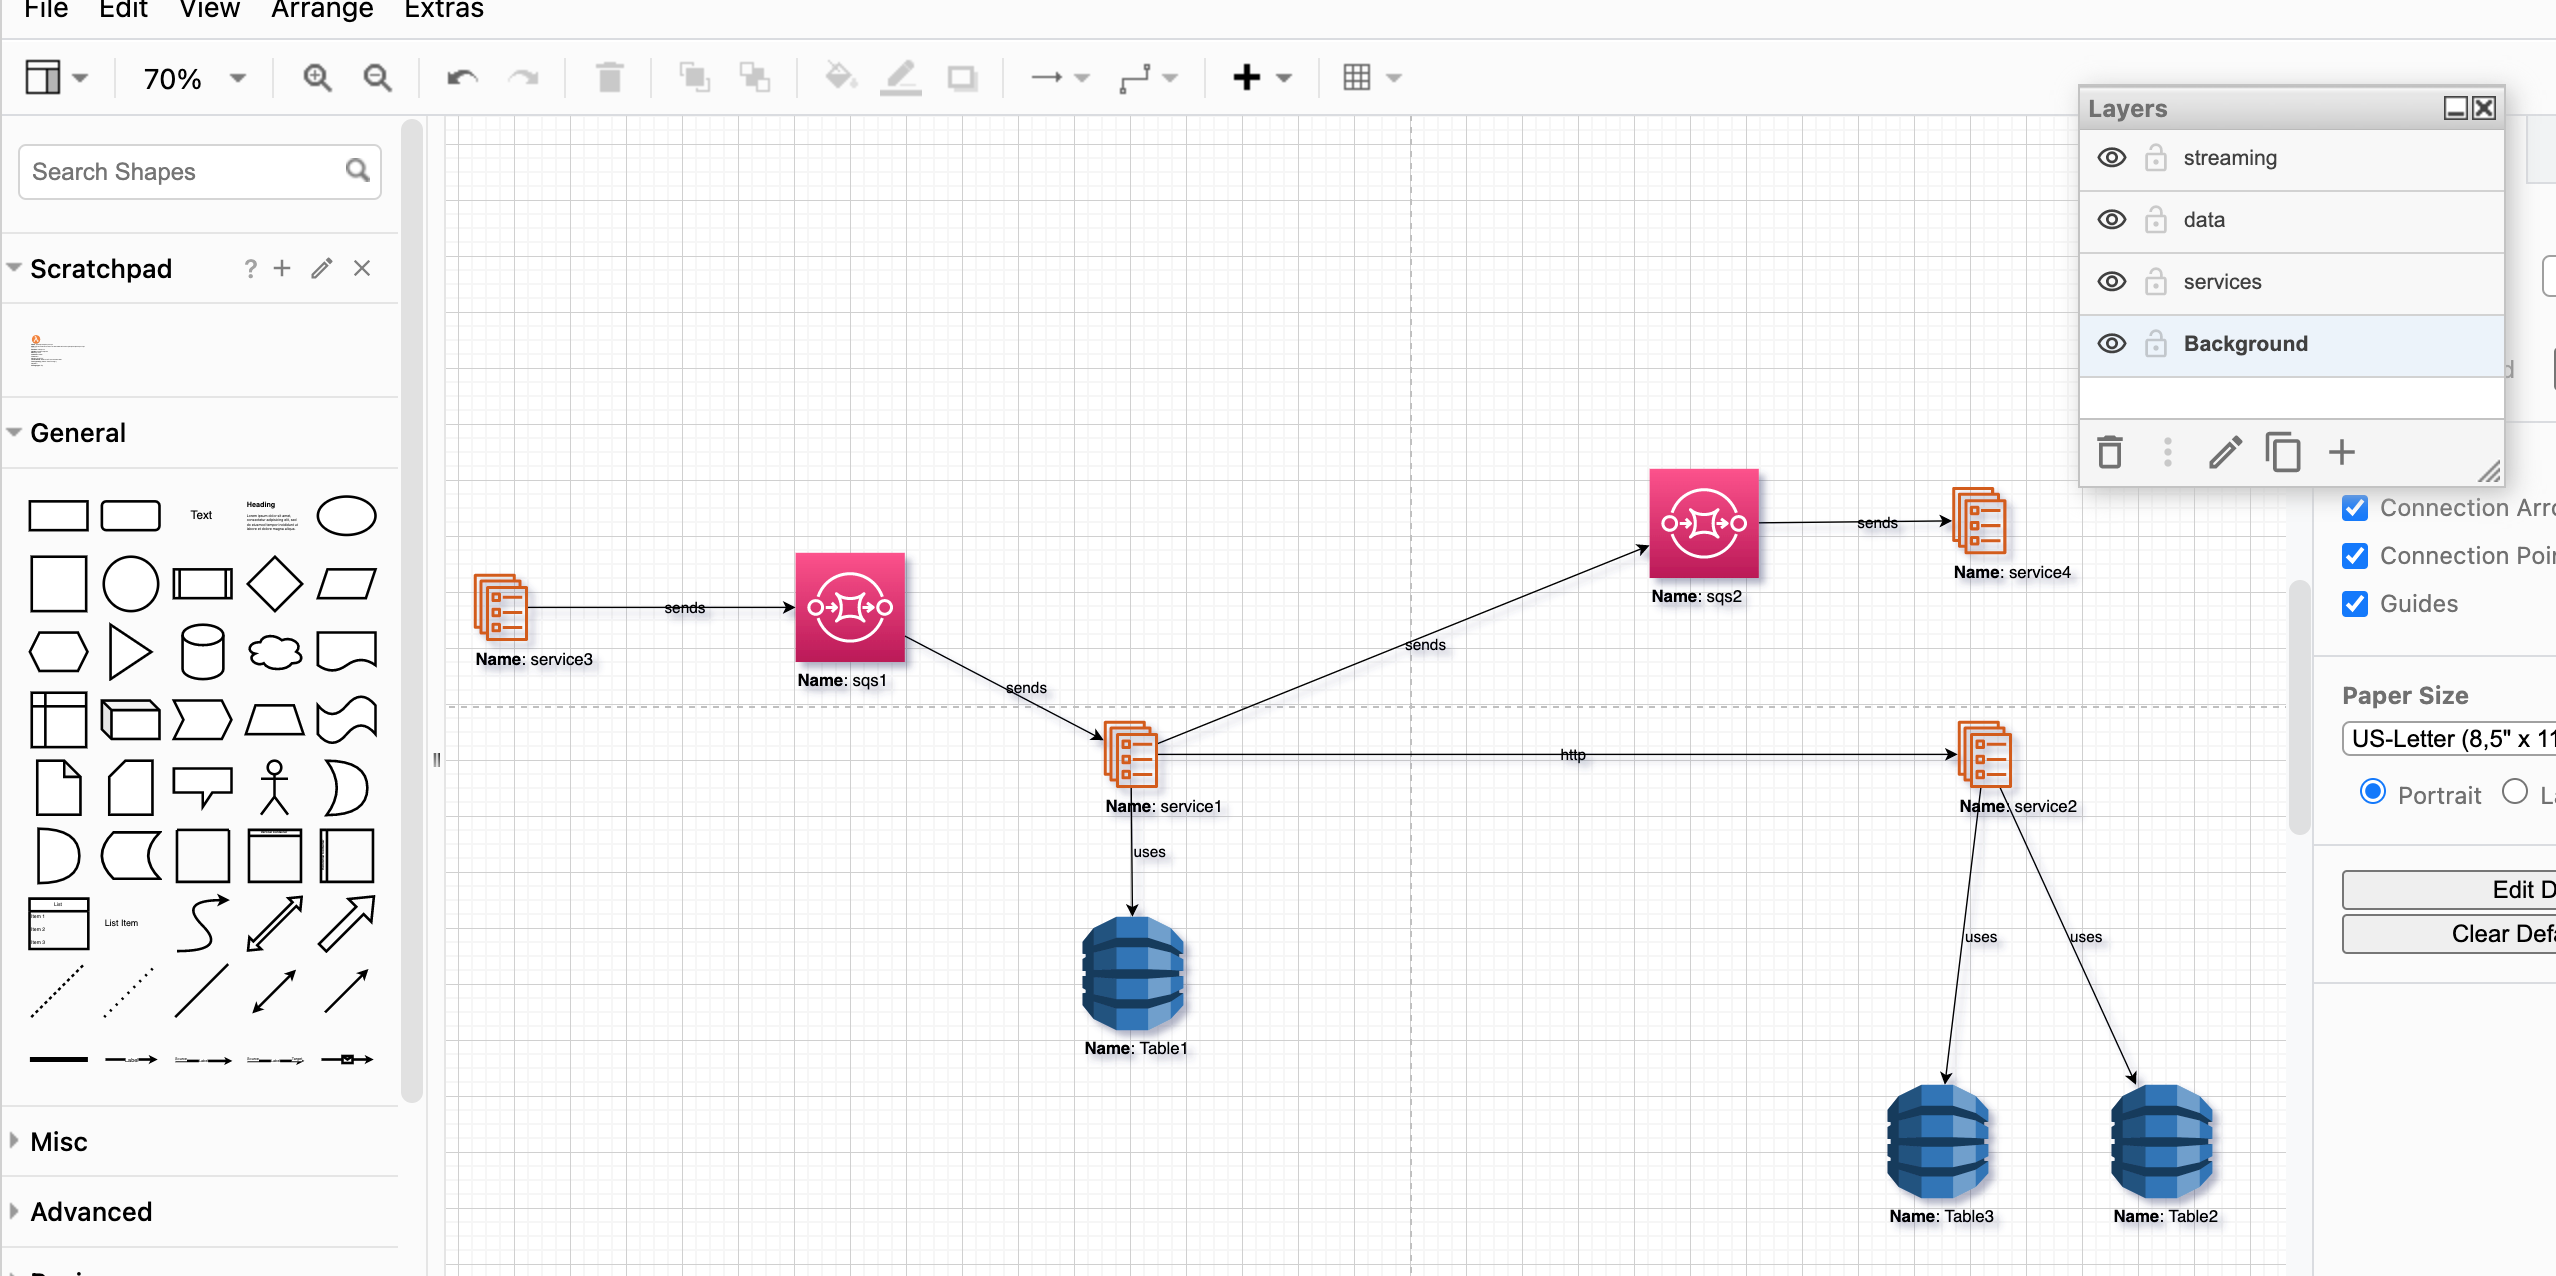
Image 3: Additional Nodes added to Diagram. Previous Nodes are in the same position.
Conclusions
Using the practices described in this article, with the multicloud-diagrams framework, we can document cloud infrastructure and incrementally update it when doing any refactoring, scaling, adoption of new system components, etc.
It is crucial to use documentation and diagrams and share them within a team with periodical updates. Having Diagrams as Code under version control allows us to review and track changes, run retros, perform design, onboard new engineers, etc.
multicloud-diagrams has many useful features that I will try to cover with future practical examples. Meanwhile, check its online documentation for more details: multicloud-diagrams.
Opinions expressed by DZone contributors are their own.
Comments