An Automated Inventory Pattern for Managing AWS EC2
Here is a practical automation pattern using Python, Boto3, and Pandas to visualize your AWS EC2 inventory without expensive SaaS tools.
Join the DZone community and get the full member experience.
Join For FreeIn the hybrid cloud era, managing infrastructure visibility is a constant battle. We spin up EC2 instances for testing, leave them running, and forget about them. Security groups become bloated, and cost management turns into a guessing game.
While high-end tools like Datadog or CloudHealth offer solutions, they often come with significant licensing costs and integration overhead. Sometimes, you just need a lightweight, customizable way to see exactly what is running in your environment.
Based on a case study involving hybrid infrastructure management, this article outlines a low-cost automation architecture to retrieve, visualize, and analyze EC2 parameters. While the original implementation relied on legacy Excel VBA, we have modernized the stack to use Python. By combining Boto3 (the AWS SDK) and Pandas, you can build a self-updating inventory system that reduces audit time by 98%.
The Problem: The Cloud “Black Box”
When you manage hundreds of instances across multiple regions, three critical issues arise:
- Over-Provisioning: Resources are sized for peak load but run idle 90% of the time.
- Zombie Resources: Development environments are abandoned but left running.
- Security Drift: Who opened port 22 on the database server? When was the last OS patch applied?
Manual audits are impossible at scale. You need an automated snapshot of your infrastructure’s health.
The Architecture: A Python Automation Pipeline
We replace the fragile CSV-to-VBA workflow with a robust Python script. This enables better error handling, type safety, and easier scheduling via Cron or Jenkins.
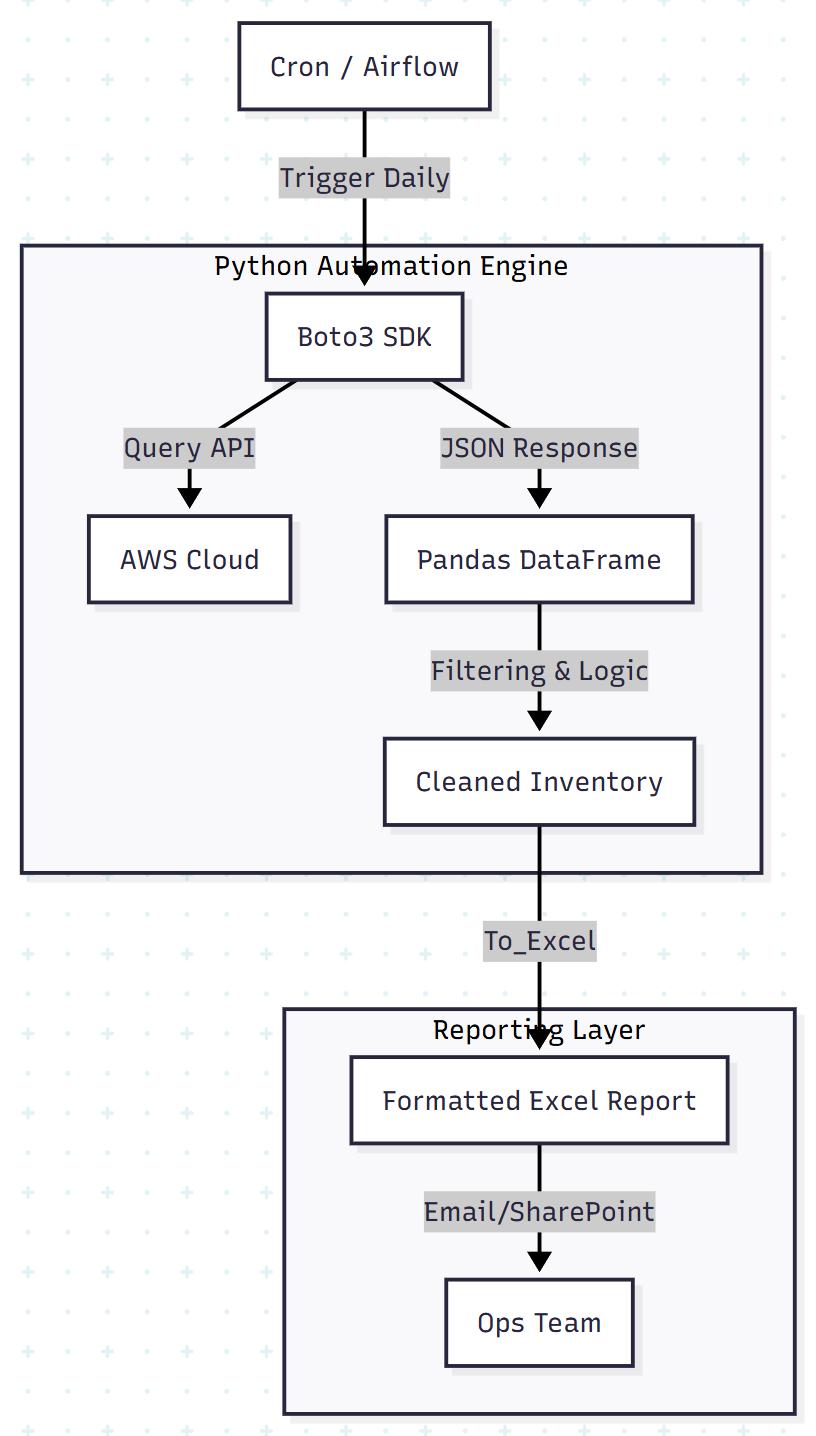
The Workflow:
- Data Extraction: Python (boto3) queries the AWS API across all target regions.
- Data Processing: Python (pandas) flattens the JSON response into a structured DataFrame and filters for anomalies.
- Visualization: Python (openpyxl / xlsxwriter) exports a formatted Excel dashboard for management reporting.
Step 1: The “VBA Killer” Python Script
In legacy workflows, engineers often used VBA to parse CSVs line by line to avoid Excel crashing on large datasets. Python’s Pandas library handles this natively using vectorized operations, processing hundreds of thousands of rows in milliseconds.
Below is the complete script to fetch EC2 data and generate a formatted report.
import boto3
import pandas as pd
from datetime import datetime

def get_ec2_inventory(regions):
    inventory_list = []

    for region in regions:
        print(f"Scanning region: {region}...")
        ec2 = boto3.client('ec2', region_name=region)

        # Paginator handles API limits automatically
        paginator = ec2.get_paginator('describe_instances')

        for page in paginator.paginate():
            for reservation in page['Reservations']:
                for instance in reservation['Instances']:
                    # Extract Tags safely
                    tags = {t['Key']: t['Value'] for t in instance.get('Tags', [])}

                    # Build the record
                    record = {
                        'Region': region,
                        'InstanceId': instance['InstanceId'],
                        'Name': tags.get('Name', 'N/A'),
                        'Type': instance['InstanceType'],
                        'State': instance['State']['Name'],
                        'PublicIP': instance.get('PublicIpAddress', 'N/A'),
                        'PrivateIP': instance.get('PrivateIpAddress', 'N/A'),
                        'LaunchTime': instance['LaunchTime'].replace(tzinfo=None), # Fix TZ for Excel
                        'CostCenter': tags.get('CostCenter', 'Unknown')
                    }
                    inventory_list.append(record)

    return pd.DataFrame(inventory_list)

def generate_excel_report(df, filename):
    """
    Replaces VBA formatting logic.
    Writes data to Excel and adds Conditional Formatting.
    """
    with pd.ExcelWriter(filename, engine='xlsxwriter') as writer:
        # Write raw data
        df.to_excel(writer, sheet_name='EC2_Inventory', index=False)

        workbook = writer.book
        worksheet = writer.sheets['EC2_Inventory']

        # Format 1: Header styling
        header_fmt = workbook.add_format({'bold': True, 'bg_color': '#4F81BD', 'font_color': 'white'})
        for col_num, value in enumerate(df.columns.values):
            worksheet.write(0, col_num, value, header_fmt)

        # Format 2: Highlight "Stopped" instances in Red
        red_fmt = workbook.add_format({'bg_color': '#FFC7CE', 'font_color': '#9C0006'})

        # Apply conditional formatting to the 'State' column (Column E)
        row_count = len(df) + 1
        worksheet.conditional_format(f'E2:E{row_count}', {
            'type': 'text',
            'criteria': 'containing',
            'value': 'stopped',
            'format': red_fmt
        })

        # Auto-adjust column widths
        worksheet.set_column(0, 8, 20)

    print(f" Report generated: {filename}")

if __name__ == "__main__":
    # Define scope
    target_regions = ['us-east-1', 'us-west-2']

    # 1. Fetch
    df_instances = get_ec2_inventory(target_regions)

    # 2. Analyze (Simple Pandas Logic)
    print(f"Total Instances Found: {len(df_instances)}")
    print(df_instances['State'].value_counts())

    # 3. Report
    timestamp = datetime.now().strftime("%Y%m%d")
    generate_excel_report(df_instances, f"aws_inventory_{timestamp}.xlsx")
Step 2: Why Python Beats VBA for Ops
The shift from Excel VBA to Python provides three architectural advantages:
- Maintainability: VBA is locked inside a
.xlsmbinary file. Python scripts are plain text, version-controlled in Git, and easily peer-reviewed. - API integration: VBA requires complex HTTP requests or external shell calls to interact with AWS. Python uses boto3, a native and well-maintained SDK.
- Speed: The VBA approach in the original study relied on memory arrays to speed up cell writing. Pandas abstracts this entirely, writing binary Excel files directly from memory without the overhead of the Excel GUI.
Step 3: Automated Analysis
Once the data is in a DataFrame, you can run logic checks before a human ever sees the report.
Example: Detecting Zombie Instances
# Identify instances running for > 30 days in 'Dev' environment
zombies = df[
    (df['State'] == 'running') &
    (df['CostCenter'] == 'Dev') &
    (df['LaunchTime'] < pd.Timestamp.now() - pd.Timedelta(days=30))
]

if not zombies.empty:
    print(f"WARNING: {len(zombies)} potential zombie instances detected.")
    # Optional: Send Slack alert
Results: The Impact of Automation
Implementing this automated inventory pattern yielded significant operational improvements:
- Cost reduction: Identified and removed unused storage volumes and zombie instances, saving thousands in monthly spend.
- Time savings: Reduced the monthly inventory audit from 288 hours (manual) to zero hours (fully automated).
- Data freshness: Moved from a monthly manual snapshot to a daily automated feed, allowing operations teams to react to security risks in near real time.
Conclusion
You don’t always need a SaaS subscription to solve cloud management problems. By chaining together standard administrative tools — Boto3, Pandas, and Excel — you can build a robust, no-cost inventory system that fits your exact needs.
Next Steps:
- Clone the script above.
- Schedule it to run every Monday morning via GitHub Actions or Jenkins.
- Email the report automatically to your FinOps team.
The best observability tool is the one you actually look at.
Opinions expressed by DZone contributors are their own.
Comments