Create Beautiful Java Visualizations With Tablesaw's Plot.ly Wrapper
Want to learn more about creating Java visualizations? Check out this post to learn more about Tablesaw's open source platform, plot.ly.
Join the DZone community and get the full member experience.
Join For FreeCreating visualizations is an essential part of data analysis — whether you're just "looking around" a new dataset or verifying the results of your machine learning algorithms. Unfortunately, Java has fallen behind what the best visualization tools offer. Tablesaw's new plotting framework provides a platform for creating visualizations in Java for the entire analysis process, from the earliest explorations to the final presentation.
The framework provides a Java wrapper around the Plot.ly open source JavaScript visualization library. Plot.ly is based on the extraordinary D3 (Data-Driven Documents) framework and is certainly among the best open-source visualization packages available in any language. Plot.ly is so good, in fact, it is widely used in languages other than JavaScript, such as Python and R, which already had solid options for visualization.
Like these other languages, we provide a wrapper that makes it easy to construct plots in pure Java and render them in HTML and JavaScript.
While you can create plots from standard Java objects and primitives, we've also ensured that you can build them directly from Tablesaw tables and columns. Tablesaw is an open source, high-performance Java "data frame," and a library for transforming data for analysis. The combination of Tablesaw's data munging tools and its new plotting facility make for a powerful combination. Here's a small taste of what you can do:
Heatmap |
OHLC plot |
Vertical Grouped Bar Chart |
We're taking this approach for many reasons. Here are some of the most important:
- Plot.ly provides a huge range of visualization types. You can see some examples here. Tablesaw's wrapper already supports time-series plots, histograms, 2D histograms, box plots, line charts, area charts, 2D and 3D scatterplots, bubble plots, heatmaps, OHLC plots, candlestick plots, Pareto charts, pie charts, and bar charts. We will continue to add others, including geographic maps, tree-plots, network diagrams, dedograms, 3D surfaces, 2D density plots, contour plots, tree-maps, violin plots, scatterplot matrices, etc.
- We use Java features like builders and type-safe enums to minimize the spelling and punctuation issues common when working directly with JavaScript.
- Each chart is interactive. They share a common family of interactive tools for saving, printing, panning, zooming, rotating, selecting points, etc.
- The range of supported customizations is enormous. It includes fonts, legends, custom axis, spikes, hover effects, and so on. You can almost always get the visualization you want.
- And, of course, you can use the output in a web page when you're ready to share your visualizations with the wider world.
While we don't support the entire plot.ly API, we support a large and growing portion and plan to provide very close to complete coverage.
How It Works
There are two ways to work with plotting. You can use the predefined "canned" plots in the API package, or you can roll-your-own custom visualizations.
Pre-defined ("Canned") Plots
The API package contains simplified interfaces for producing a number of common plot types. The goal for these plots is that they can be created and displayed in one or two lines of code. Here's an example bubble plot:
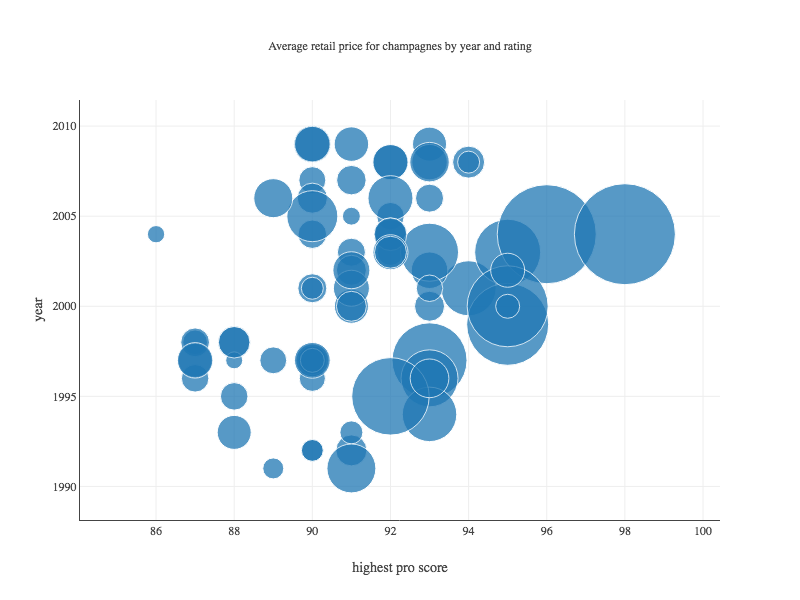
And, here's the code to create and display it. In the simple API, rendering a bubble plot requires two steps. First, a call to BubblePlot.create() returns a Figure object:
Figure fig = BubblePlot.create("Average retail price for champagnes by year and rating",
                champagne,// table name
                "highest pro score",// x variable column name
                "year",// y variable column name
                "Mean Retail"// bubble size
               ));
This figure is rendered by passing it to a Plot.show() method.
Plot.show(fig);This writes a generated HTML page containing the necessary JavaScript to a file on the local filesystem and opens it in a browser window.
Custom visualizations
The plot.ly package contains packages for creating "figures," "traces," and "layouts." Figures are Plot.ly-speak for plots, traces represent data series, and layouts control the appearance. Custom visualizations are assembled using these building blocks. The simple API classes are also built this way. You can use the source to jump-start your own creations. A forthcoming tutorial will explain in detail how to create custom visualizations. We will also provide some more elaborate examples down the road.
Ways of working
Visualizing Data While Working in Your IDE
When you're doing data analysis, it's important to be able to create plots easily in your IDE, so we provide a way to render plots without a servlet engine or web server. To do that, we write an output HTML file to disk and use the default browser on the desktop to load it. The effect is similar to testing web apps from within an IDE. This is what the call to Plot.show() in the example does.
Rendering Output to a Web Page
You can render plots to web pages easily by getting the JavaScript from the figure you want to display. All figures, traces, and layouts implement asJavaScript(), which returns a String. Figures have a second method that returns a String creating an HTML div element to hold your output. Another forthcoming tutorial will demonstrate how to use Tablesaw in Spark-Java with a relational database to create and display plots.
Rendering Output in a Java UI
Unfortunately, this isn't as easy as it should be. The JavaFX WebView component is not as robust as browsers like Chrome. We expect, however, to provide a component that lets you use plug Tablesaw visualizations into your Java client apps.
For more information
See Tablesaw and the Tablesaw User Guide for more information. As mentioned above, we're developing a series of tutorials to introduce and explain how to use the many features of Tablesaw's plotting library.
Meanwhile, there's a general introduction to Tablesaw here.
Opinions expressed by DZone contributors are their own.
Comments