Become an Elite Team With DORA Metrics
Software engineering is much more than coding skills.
Join the DZone community and get the full member experience.
Join For FreeOrganizations have been attempting to measure software development productivity for decades. Too often, attention has concentrated on easily-quantifiable metrics like person-hours, lines of code committed, function points, or features added per sprint. Sadly, none of these have proven adequate at predicting team productivity. It’s such a complex problem that some have declared it impossible to solve.
Despite these failed attempts, DORA set out to establish measures of development productivity.
What Is DORA?
DORA (DevOps Research and Assessment) is a research team founded in 2015 by Nicole Forsgren, Jez Humble, and Gene Kim. The group's aim is to find ways to improve software development. Over the course of seven years, they surveyed thousands of software professionals across hundreds of organizations in various industries.
The team's findings were first published in Accelerate: The Science of Lean Software and DevOps (2018). The book introduced four benchmarks that correlate to high-performing organizations: the DORA metrics.
In the same year that the aforementioned book was published, Google acquired the group and established the DORA research program, which is responsible for publishing the yearly State of DevOps Report.
What Are the DORA Metrics?
The groundbreaking insight obtained by DORA’s research was that, given a long-enough term, there is no tradeoff between speed and quality. In other words, reducing quality does not yield a quicker development cycle in the long run.
Both speed and stability are essential. Focusing on adding features at the expense of quality results in substandard code, unstable releases and technical debt, eventually stifling progress.
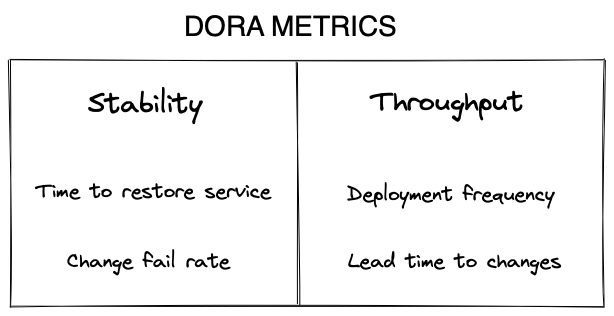
DORA identified two key aspects of software development:
Throughput: measures the time it takes new code to reach production.
Stability: measures how often a deployment fails and average time to fix.
DORA measures stability with two metrics:
Time to restore service (MTTR): how long it takes the organization (on average) to recover from a failure in production.
Change fail rate (CFR): the percentage of releases or deployments causing a failure in production.
On the throughput side, DORA adds two more metrics:
Deployment frequency (DF): how often the organization successfully releases the product to the users or deploys it to production.
- Lead time to changes (LT): the amount of time it takes a commit to reach production or release.
| Metric | Low | Medium | High | Elite |
|---|---|---|---|---|
| Deployment frequency | fewer than 1 per 6 months | 1 per month to 1 per 6 months | 1 per week to 1 per month | On demand (multiple deploys per day) |
| Lead time for changes | more than 6 months | 1 month to 6 months | 1 day to 1 week | Less than 1 hour |
| Time to restore service | more than 6 months | 1 day to 1 week | Less than a day | Less than 1 hour |
| Change fail rate | 16 to 30% | 16 to 30% | 16 to 30% | 0 to 15% |
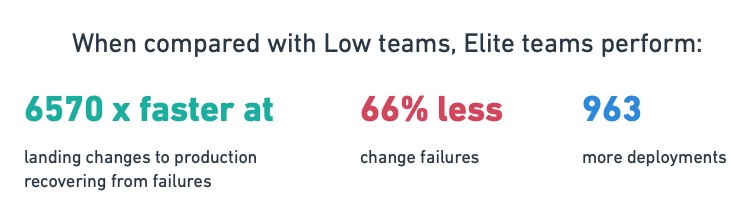
According to the State of DevOps Report 2021 (PDF), the performance across the different levels is dramatic.
Achieving Elite Level with DORA Metrics
Let me preface this section with a few warnings:
DORA metrics are only valid in tracking a team's progress in their DevOps journey. They cannot be used to compare teams or individuals.
Goals and metrics should not be confused. Since all metrics can be gamed, equating metrics to objectives leads to perverse incentives. If, for instance, management decides to optimize deployment frequency no matter the cost, it will be in the team’s best interest to deploy any tiny change they can think of, regardless if it adds value to the user or not.
Organizational culture has an enormous impact on team performance. We'll come back to this later in the post.
Okay, now that that’s out of the way, let’s carry on.
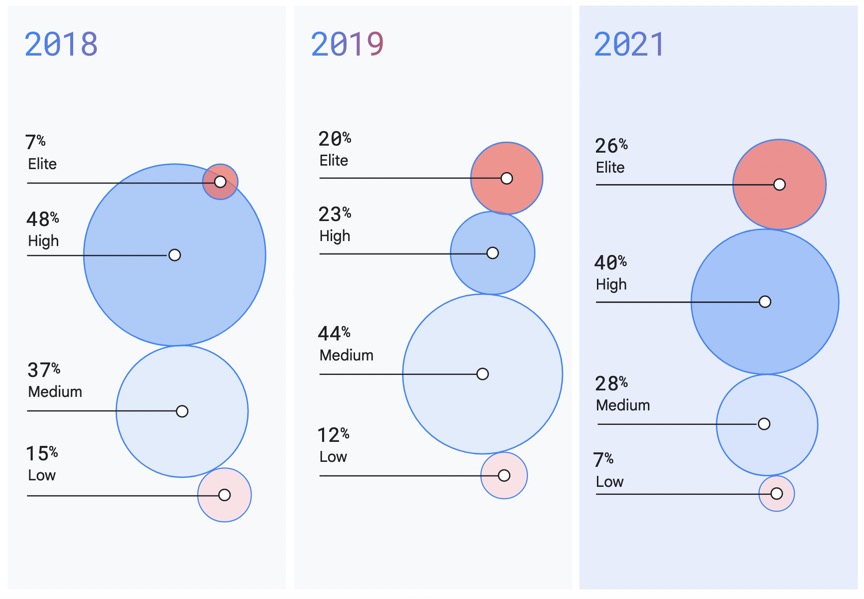
Elite teams have been growing in number in the last few years. In 2018, only 7% of teams or organizations were considered elite. In 2021, that number grew to 26%. So we know growth is achievable.
Improving Throughput
Organizations with slow production cycles have low deployment frequency and high lead time for changes. Often, we can improve throughput by optimizing continuous integration and continuous delivery (CI/CD), identifying organizational problems, speeding up test suites, and reducing deployment friction.
Ask yourself, “what’s preventing me from releasing right now?” The answer will reveal bottlenecks in the organization. For example, you may be wasting too much time in code reviews, waiting for QA to approve changes, or holding a release until other teams finish their features.
You can improve throughput in a number of ways:
Reduce the size of your releases. Ship small, safe changes frequently. If a feature is not ready for prime time, release it hidden behind a feature flag or with a dark launch.
Ensure that the entire deployment process is automated and can be done at the press of a button. That means no checklists and no manual interventions during deployment.
Adopt trunk-based development. It will reduce the chance of merge conflicts and encourage collaboration.
Optimize the speed of continuous integration by managing slow tests and removing flaky tests.
Track how long you spend on each step in the software delivery process. Examine the cycle time and figure out where you can save time.
Improving the Project’s Stability
Speed without stability ultimately leads to accruing technical debt and spending more time fixing bugs than shipping features. When the stability metrics don’t look good, users have a bad experience and developers spend most of their time extinguishing fires rather than coding.
Here are a few ideas you can follow to improve stability:
Implement code quality checks in the CI pipeline. Refuse to ship code that is not up to par.
Reinforce the code peer review process or experiment with pair programming.
When disaster strikes, focus on recovery over all other tasks.
Ensure you have enough monitoring and observability in your system to quickly determine the cause of a failure.
Run a “lessons learned” meeting every time a severe outage occurs.
Use smoke testing in your deployment pipelines to avoid deploying in a faulty environment.
Implement automated rollback to your deployment. Experiment with canary or blue-green deployments.
The Generative Culture
Perhaps unsurprisingly, the 2021 State of DevOps report found a high correlation between elite teams and a generative culture within the organization. The term "generative culture" was coined by Ron Westrum to describe a culture that's inclusive, highly cooperative, and that provides the psychological safety needed to take risks without fear of fallout.
The culture of the organization goes beyond a single team. It must be propped up by management, shared by the engineering team, and maintained throughout the company. A generative culture brings siloes down, encouraging collaboration beyond the engineering teams.
| Pathological (Power oriented) | Bureaucratic (Rule oriented) | Generative (Performance oriented) |
|---|---|---|
| Low cooperation | Modest cooperation | High cooperation |
| Messengers "shot" | Messengers neglected | Messengers trained |
| Responsibilities shirked | Narrow responsibilities | Risks are shared |
| Bridging discouraged | Bridging tolerated | Bridging encouraged |
| Failure leads to scapegoating | Failure leads to justice | Failure leads to inquiry |
| Novelty crushed | Novelty leads to problems | Novelty implemented |
Source: A typology of organizational cultures, Dr. Ron Westrum, 2004.
Conclusion
It would be a mistake to think that improving DORA metrics automatically makes for better teams. It's the other way around: an inclusive, generative culture naturally yields higher benchmarks. In other words, there is no chance of sustaining an elite team in a low-cooperation, risk-averse environment. Setting metrics as goals is not only near-sighted, but often an indicator that an organization has strayed into pathological or bureaucratic culture.
Would you like to know what your DORA score is? Take the DevOps Quick Check and find out!
Published at DZone with permission of Tomas Fernandez. See the original article here.
Opinions expressed by DZone contributors are their own.
Comments