A Beginner's Guide to Spark UI: Concepts and How to Use It
Understanding the fundamentals of Spark UI is essential for optimization and debugging. Although the UI is old, the information it contains is gold.
Join the DZone community and get the full member experience.
Join For FreeIf you have been working with petabytes of data, are a data engineer, or are looking to get into data engineering, I am sure you have heard about Apache Spark, a distributed data processing system. Apache Spark is a Unified computing engine, clubbed with a set of libraries for parallel data processing on compute clusters. It is not primarily designed as a storage system.
Apache Spark can run locally in your system or on the cloud — using AWS EMR, AWS Glue, Google Cloud Dataproc, Databricks, etc. However you may use it, one thing before you start is to understand the basics — Spark UI, RDDs, DataFrames, Transformations/Actions, Job, Stages, Tasks.
Without understanding the basics, there’s a very high chance that you would either over-provision or under-provision resources or not be able to optimize your jobs to withstand the data growth. In order to avoid all of these pitfalls, let’s first quickly glance through the basics and then dive into Apache Spark UI and how to use it to optimize your jobs.
Main Components of Apache Spark
- Spark session
- Cluster manager — Apache YARN, Mesos, Kubernetes, Spark
- Driver/Master node
- Executor/Worker node
- Stages, jobs, and tasks
Spark Session
This is the entry point for programming with Spark Dataset and DataFrame APIs. Spark Session was introduced to replace previous SQLContext and HiveContext, and become a single entry point.
from pyspark.sql import SparkSession

spark = SparkSession.builder \
    .appName("MyFirstApplication") \
    .getOrCreate()
If you would like to read more about SparkSession and how it is different from SparkContext, please refer to this article.
Cluster Manager
The primary function of the cluster manager is to make sure resources are divided across the application. It’s responsible for resource allocation, like CPU, memory, etc.
SparkContext can connect to different cluster managers like Spark’s own stand-alone cluster manager, Mesos, YARN (Yet another resource negotiator), or Kubernetes. Each of these cluster managers has its own distinct features and architecture. To read more about Mesos, Kubernetes, or YARN, check this article.
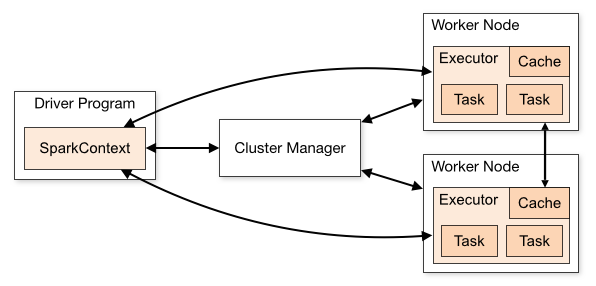
Driver/Master Node and Executor/Worker Nodes
The driver serves as the central coordinator, running the main program and managing the crucial SparkContext or SparkSession while converting complex operations into a directed acyclic graph (DAG) of tasks. It analyzes, distributes, and schedules work across the cluster, maintaining all essential information throughout the application’s lifetime. On the worker nodes, executors function as distributed processes that handle the actual computational heavy lifting.
These worker processes are launched when the application begins and typically remain active throughout its duration, each having specific cores for processing data and performing tasks in parallel. Once executors complete their assigned tasks, they report back to the driver with results, creating a continuous feedback loop of distributed processing.
The driver and each executor work separately on each virtual machine (VM) to avoid any conflicts in most cases. The application communicates with the driver via the Spark session. The driver takes the application and tries to understand what we need to do with the data and how to optimally do that. The cluster manager will split the work into multiple ‘tasks’ that will be executed by each executor node. Each executor can process multiple tasks in parallel, depending on how many vCPUs Cores the executor has. For example, an executor with four vCPU cores can process four tasks in parallel.
The Elephant in the Room: How to Use Spark UI
If you have used Spark, you have stumbled at least once on the Spark UI — a not-so-modern-looking UI that provides a lot of information. The UI provides data to monitor status, resource consumption, jobs, stages, and tasks, and it becomes critical to understand the nuances and the data provided by the UI if you want to start optimizing your Spark jobs.
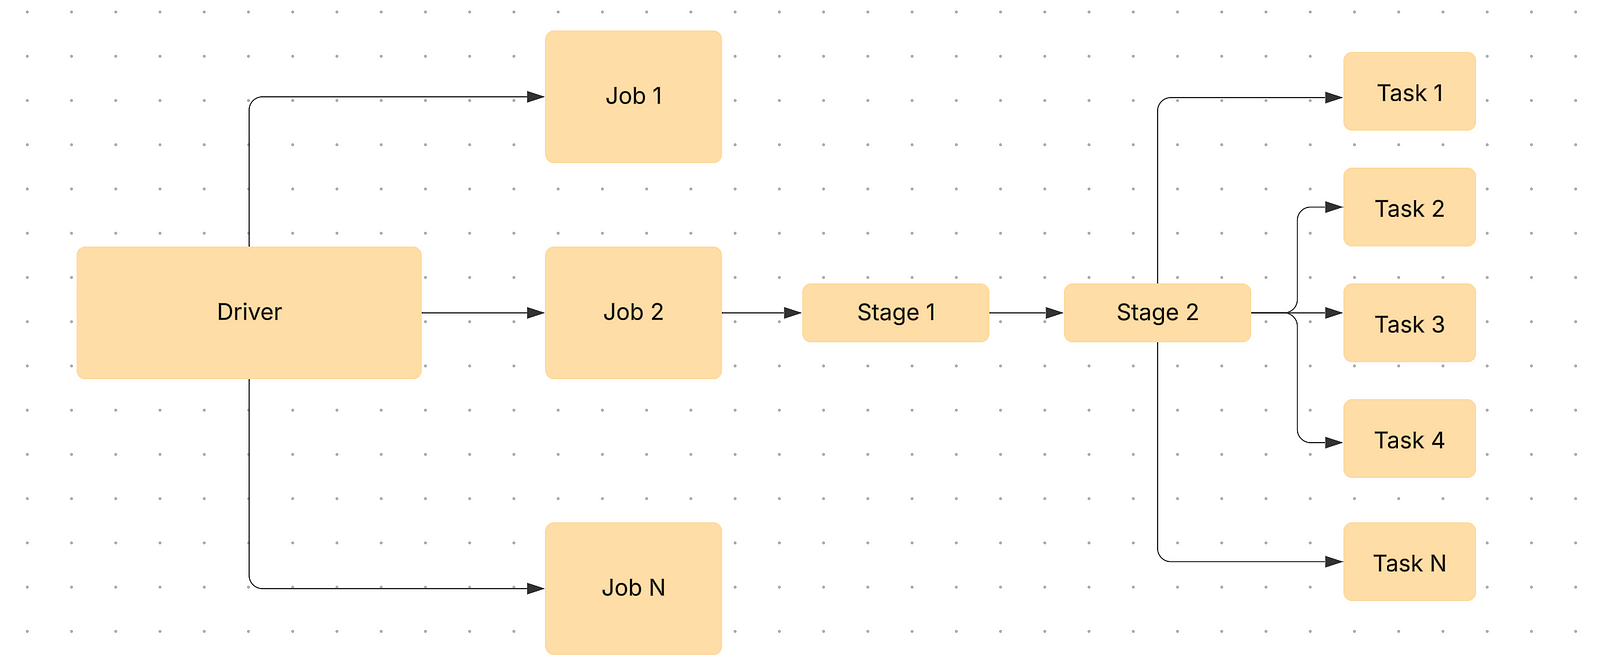
On the Spark UI, the main tabs that you would interact with the most are Jobs, Stages, and SQL/DataFrame for batch Spark jobs. The jobs, stages, and tasks are related to each other in the following way:
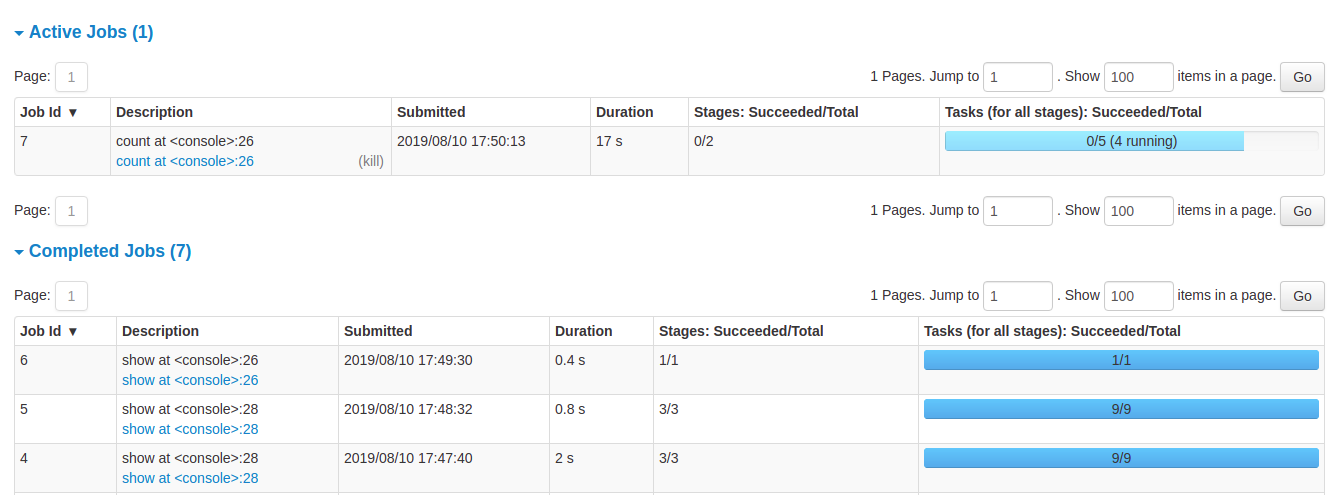
1. Jobs Tab
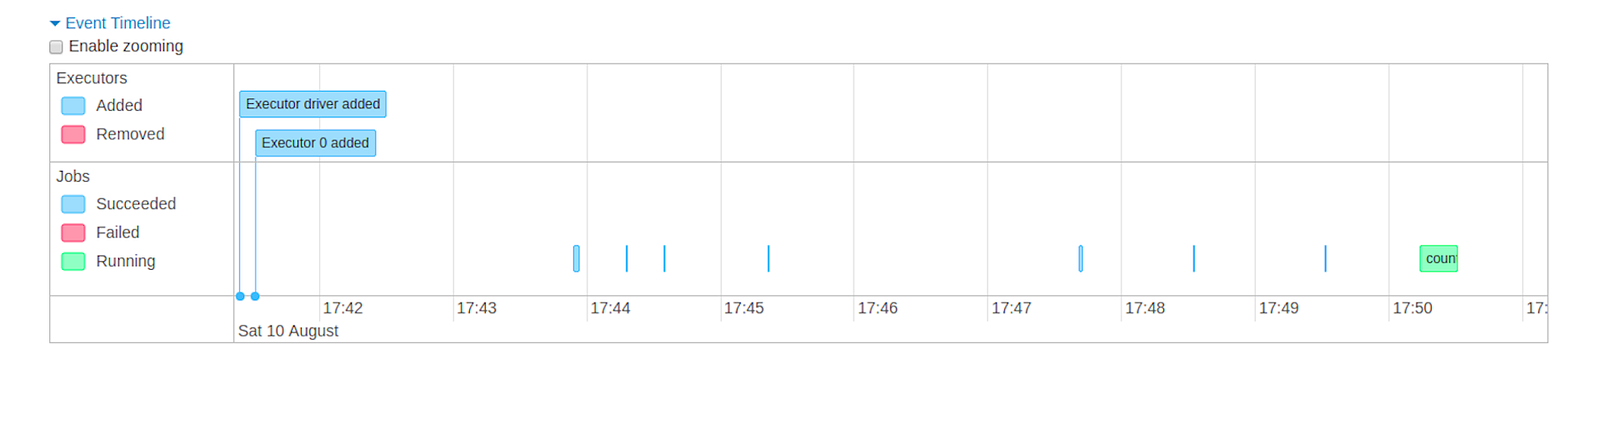
The Jobs tab displays the summary page of all jobs in the Spark application. The cluster manager would create N jobs based on the type of workload and query plan. On clicking the job, more details around timeline, DAG visualization, and stages of the jobs are provided.
For each job, there are stages. Once you click on the job, it would provide information about the stages its associated tasks. The Jobs tab provides high level information about time taken, so if you are looking to optimize your Spark query, the longest running job would be a good place to start. Once you click on the link in the Description, you would be taken to a job detail page.

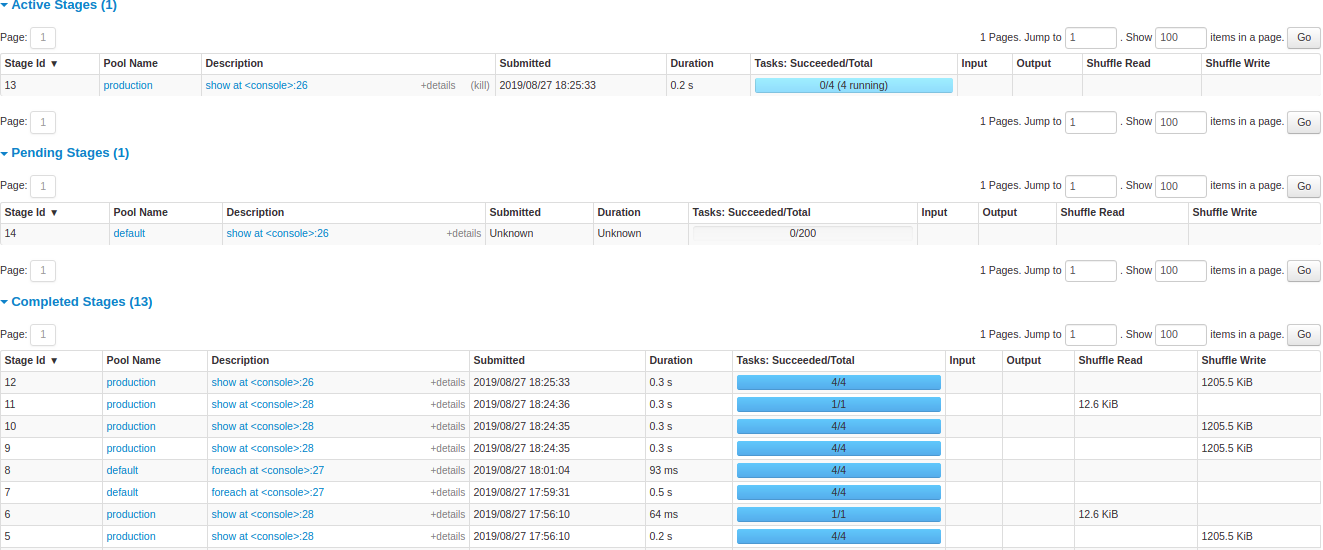
2. Stages Tab
The Stages tab represents a detailed summary of current state of all stages of all jobs. It presents information about time across all tasks, shuffles read/write size and records, and associated job IDs.
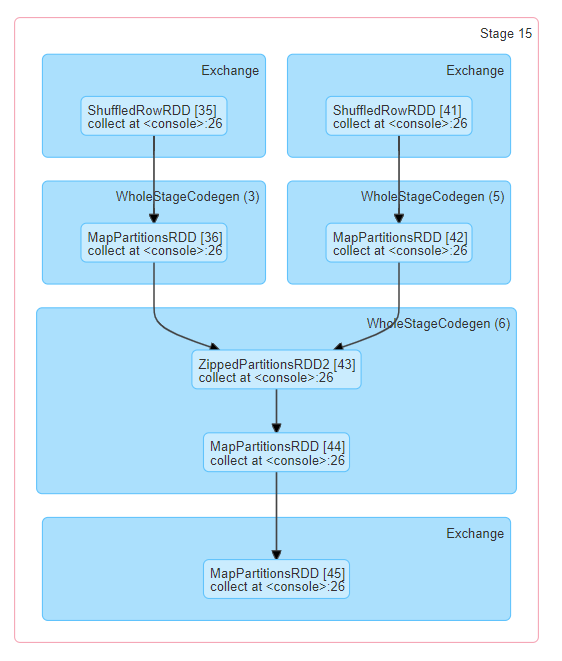
With the directed acyclic graph (DAG) representation, the nodes are grouped by operations performed and labelled with operation name — Exchange, BatchScan, Scan, WholeStageCodegen, etc. Stages that belong to Spark DataFrame/SQL, you can refer to the relevant SQL tab to know the SQL/DataFrame tab to know more about execution and query plan.
3. SQL/DataFrame Tab
If you are using Spark SQL (and not accessing the RDD directly), the SQL/DataFrame tab displays information, such as the duration, jobs, and physical and logical plans for the queries.
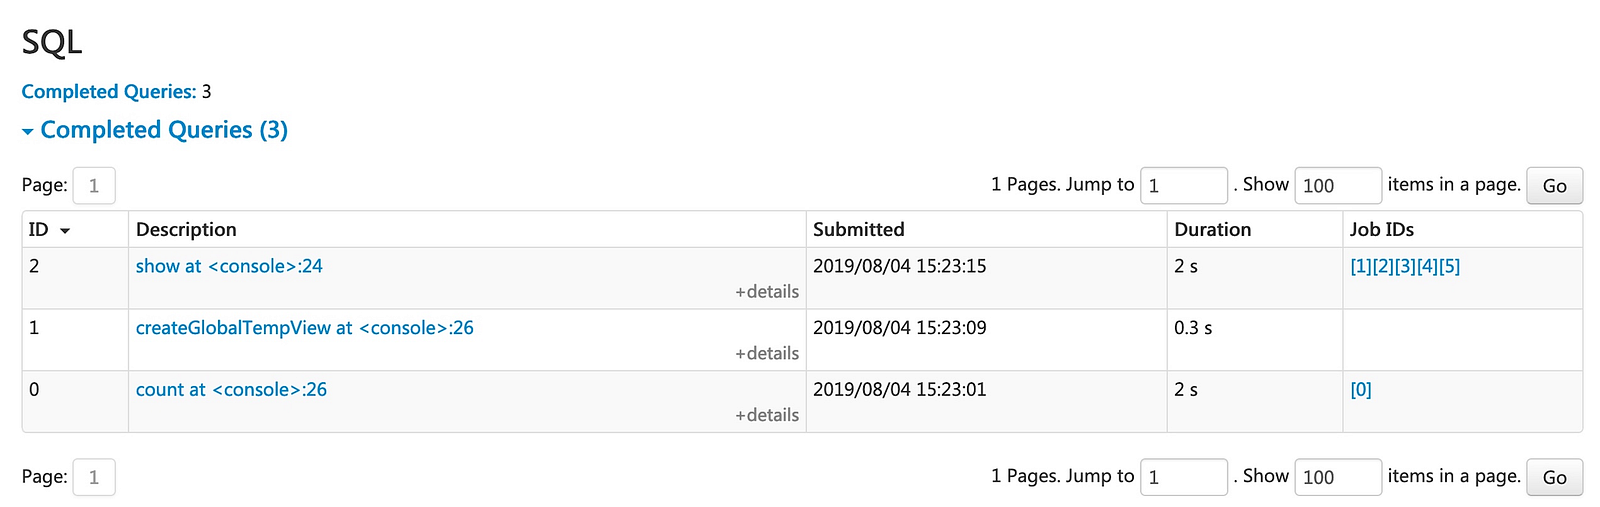
Once you click on the links in the description, you can see the DAGs associated with the query and the details of the query execution.
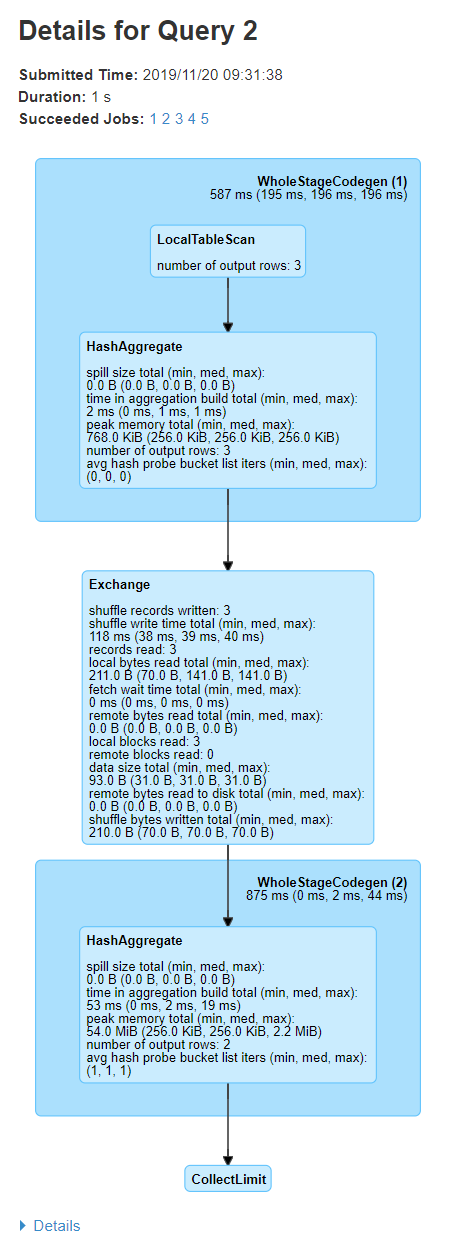
If you carefully notice, the first block has ‘WholeStageCodegen (1)’, which contains operators LocalTableScan and HashAggregate. The second block ‘Exchange’ represents metrics like number of rows and shuffling data size. Remember — shuffling is compute intensive, hence you should always look into these metrics to understand if there is scope for optimization here.
Once you click further on the details section, you can see how the cluster manager has parsed, analyzed, optimized, and performed the query.
Conclusion
After going through the above information, you should be able to understand and use Spark UI, when your job is running longer unexpectedly. You should be able to identify which job, stage and task to look into. There are a lot of ways to optimize Spark jobs, so we will talk about it further in our next blog.
Thank you for reading!
Opinions expressed by DZone contributors are their own.
Comments