Chart.js Line Chart Tutorial: Visualize Route Elevation Data
Learn how to create a Chart.js line chart on an example of a route elevations profile graph. This tutorial includes code samples and JSFiddle to start quickly.
Join the DZone community and get the full member experience.
Join For FreeChart.JS is a JavaScript library that helps you create beautiful charts in seconds. It's one of the best Javascript Charting Library available today. The library is open source and has a business-friendly MIT license, so you can use it in your commercial projects without worrying about licensing issues. In addition, chart.js doesn't rely on other libraries, which means you don't have to deal with any additional headaches when updating or maintaining your project.
This tutorial will show you how to create a line chart visualizing a route elevation profile using the Chart.js library. Therefore, we will use Geoapify Routing API to calculate a hiking route and get route elevation data. Additionally, we've created a sample on JSFiddle so you can play with the code and see how it works.
Install Chart.js
You can easily add Chart.js to your project with the npm command:
npm install chart.jsAfter that, you can import the Chart.js classes in your JS/TS files as an ES6 module. For example:
import { Chart, LineElement, Legend, Tooltip } from 'chart.js';Please see the detailed instructions on the Chart.js integration page of the documentation.
Alternatively, you can link to the library with a <script> tag in your HTML code:
<script type="text/javascript"
        src="https://cdnjs.cloudflare.com/ajax/libs/Chart.js/3.7.0/chart.min.js"
></script>
Take a look at the exact link provided on the CDNjs's page.
Create a Chart.js Line Chart
Chart.js offers lots of options for customization and flexibility. Let's start simple! Let's code up a simple line chart showing the predefined data. Here is a minimal code to create a line chart using Chart.js:
<canvas id="route-elevation-chart" style="width:100%;height:100%"></canvas>const ctx = document.getElementById("route-elevation-chart").getContext("2d");
const chartData = {
labels: [1, 3, 6, 8, 9, 10, 12],
datasets: [{
label: "Elevations",
data: [344, 555, 666, 777, 888, 999, 555]
}]
};
const config = {
type: 'line',
data: chartData
};
const chart = new Chart(ctx, config);Here's our pretty chart:
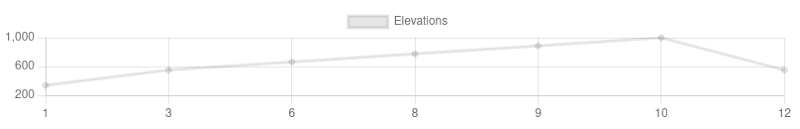
As you can see in the code above:
- Chart.js uses an <canvas> element to create a chart;
- The chart data or y-axis values are provided as a dataset;
- The corresponding x-axis values are provided as labels.
Calculate Route and Get Elevations With API
Let's get some real elevation data and display it on the chart. We use Geoapify Routing API to calculate a route which also returns the route elevations on request by setting details parameter: details=elevation.
The API can get directions and route information for a set of waypoints. You can get a route by sending an HTTP Get request to the API endpoint. For instance, this API request returns a hiking route through four waypoints in the Dolomite mountain region of Italy:
const waypoints = [{
    latlon: [46.428383306286264, 11.684786140273445],
    address: "Strada de Crojada, 2, 38036 Pozza di Fassa TN, Italy"
  },
  {
    latlon: [46.44722114730834, 11.739456591671797],
    address: "Col Bel, Mazzin, Trento, Italy"
  },
  {
    latlon: [46.43251900000138, 11.78245956868534],
    address: "Via de Contrin, 18, 38032 Canazei TN, Italy"
  },
  {
    latlon: [46.437803040855385, 11.848464138055533],
    address: "Ghiacciaio del Vernel, Canazei Trento, Italy"
  }
]

// You can get a free API Key on https://myprojects.geoapify.com
fetch(`https://api.geoapify.com/v1/routing?waypoints=${waypoints.map(waypoint => waypoint.latlon.join(',')).join('|')}&mode=hike&details=elevation&apiKey=YOUR_API_KEY`)
  .then(res => res.json())
  .then(routeData => {
  console.log(routeData);
}, err => console.log(err));
The API call result contains comprehensive route information for each pair of waypoints - route leg. Here is an example or route leg object:
{
   "distance":8737,
   "time":11700.115,
   "steps":[
      {
         "from_index":0,
         "to_index":11,
         "distance":152,
         "time":157.353,
         "instruction":{
            "text":"Walk northeast on the walkway."
         },
         "max_elevation":1309,
         "min_elevation":1303,
         "elevation_gain":5,
         "elevation":1305
      },
	  ...
   ],
   "elevation_range":[[ 0, 1304 ], [ 17, 1303 ], [ 19, 1303 ], [ 20, 1303 ], [ 22, 1303 ], ... ],
   "elevation":[ 1304, 1303, 1303, 1303, 1303, ...]
}
The elevation_range array contains exactly the data we want to show on a chart - distance-elevation pairs. You only need to compile elevation ranges for every route leg in two arrays - labels and data. Then, add them to the line chart configuration.
When you have more than one waypoints pair in your route, there are a few things to consider when displaying elevations on a chart:
- The elevation range's distance component starts at 0 for each waypoint. To get an uncut elevation line, you need to add previous route legs' distances to your current distance.
- Or the number of results could be too large; it could be hundreds or thousands. You need to reduce the size of the result array for performance reasons.
You can find a sample of how to compile Routing API results into Chart.js array data on JSFiddle. See the calculateElevationProfileData() function.
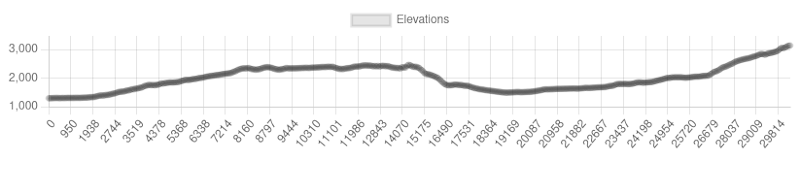
Here is a chart generated from the API call result above:
Tips and Tricks to Improve Your Elevation Chart
We have already learned how to create a line chart and add route elevation data there. Let's make this chart more valuable and attractive by adjusting the view and axis, adding titles, changing colors.
Chart.js allows you to add a wide range of plugins to customize the chart. Note that some plugins need to be registered in order to work:
Chart.register(
  Chart.LineElement,
  Chart.LineController,
  Chart.Legend,
  Chart.Tooltip,
  Chart.LinearScale,
  Chart.PointElement,
  Chart.Filler,
  Chart.Title
);
Customize Chart Line
Each data set has a default style, but you can create your unique style. The example below demonstrates how to make a line chart filled with color:
const chartData = {
  labels: elevationLabels,
  datasets: [{
    fill: true,
    borderColor: '#66ccff',
    backgroundColor: '#66ccff66',
    tension: 0.1,
    pointRadius: 0,
    spanGaps: true,
    data: elevationData
  }]
};
You can find descriptions of the chart properties on the documentation page.
Customize Chart.js Axes (Scales)
In our elevation profile chart example, there is an x-axis, two y-axes on the left and right sides of the chart. The second y-axis we've added for convenience, so both axes show the same value.
Chart.js has a plugin called beforeInit() which we use to set the scale's minimum and maximum properties. Here is an example of how to customize the axes or scales:
const config: any = {
	type: 'line',
    data: chartData,
    plugins: [{
    	beforeInit: (chart, args, options) => {
        	const maxHeight = Math.max(...chart.data.datasets[0].data);
        	chart.options.scales.x.min = Math.min(...chart.data.labels);
        	chart.options.scales.x.max = Math.max(...chart.data.labels);
        	chart.options.scales.y.max = maxHeight + Math.round(maxHeight * 0.2);
        	chart.options.scales.y1.max = maxHeight + Math.round(maxHeight * 0.2);
   		}
	}],
	options: {
		scales: {
        	x: {
            	type: 'linear'
          	},
          	y: {
            	type: 'linear',
            	beginAtZero: true
          	},
          	y1: {
            	type: 'linear',
            	display: true,
            	position: 'right',
            	beginAtZero: true,
            	grid: {
              	drawOnChartArea: false
			},
		},
	},
	...
}
Check out the documentation page for more options and parameters for axes customization.
Add Chart.js Text - Title, Tooltip, Legend
1. You can create a custom title for your chart using the title plugin:
const config = {
  type: 'line',
  data: chartData,
  options: {
	...
    plugins: {
      title: {
        align: "end",
        display: true,
        text: "Distance, m / Elevation, m"
      },
	  ...
    }
  },
  ...
};
2. You can control which information appears in the chart legend with the Legend plugin. The example below shows how to hide the legend, which can be helpful when your chart has only a single data set:
const config = {
  type: 'line',
  data: chartData,
  options: {
	...
    plugins: {
      legend: {
        display: false
      },
	  ...
    }
  },
  ...
};
3. The Tooltip plugin allows you to add customized tooltips to your chart. By default, the tooltip appears only when a user hovers a line, but you can change it by adding the "interaction" option. This way, the tooltip is shown when the chart has been hovered:
const config = {
  type: 'line',
  data: chartData,
  options: {
    interaction: {
      intersect: false,
      mode: 'index',
    },
    plugins: {
      tooltip: {
        displayColors: false,
        callbacks: {
          title: (tooltipItems) => {
            return "Distance: " + tooltipItems[0].label + 'm'
          },
          label: (tooltipItem) => {
            return "Elevation: " + tooltipItem.raw + 'm'
          },
        }
      }
	  ...
    }
  },
  ...
};
Other Useful Options
If you've been experimenting with the code from the tutorial and changing the window or container width, you may have noticed that the chart moves around when you do that. The reason is that chart.js tries to keep the initial aspect ratio by default. You can switch off this option and make your chart responsive by changing the maintainAspectRatio option to false:
const config = {
  type: 'line',
  data: chartData,
  options: {
    maintainAspectRatio: false,
    ...
  }
};
JSFiddle Live Demo
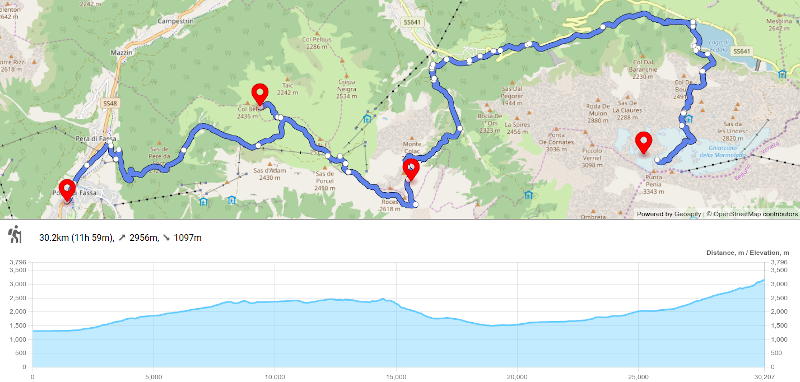
Here is a demo of the chart.js line chart. The chart illustrates the elevation profile for the 30km hiking route in Dolomitian Alps in Italy: Live Demo
Opinions expressed by DZone contributors are their own.
Comments