DZone
Thanks for visiting DZone today,
Edit Profile
  • Manage Email Subscriptions
  • How to Post to DZone
  • Article Submission Guidelines
Sign Out View Profile
  • Post an Article
  • Manage My Drafts
Over 2 million developers have joined DZone.
Log In / Join
Refcards Trend Reports
Events Video Library
Refcards
Trend Reports

Events

View Events Video Library

Related

  • Chart.js Line Chart Tutorial: Visualize Route Elevation Data
  • 9 Best Free and Open Source Tools for Reporting
  • Why Architecture Matters: Structuring Modern Web Apps
  • Boosting Similarity Search With Stream Processing

Trending

  • Using the Spring @RequestMapping Annotation
  • S3 Vectors: How to Build a RAG Without a Vector Database
  • LLM Integration in Enterprise Applications: A Practical Guide
  • Clean Code: Concurrency Patterns, Context Management, and Goroutine Safety, Part 5
  1. DZone
  2. Coding
  3. JavaScript
  4. Create Charts in ReactJS Using Chart.js

Create Charts in ReactJS Using Chart.js

By 
Sanwar Ranwa user avatar
Sanwar Ranwa
DZone Core CORE ·
Jan. 08, 20 · Tutorial
Likes (5)
Comment
Save
Tweet
Share
25.1K Views

Join the DZone community and get the full member experience.

Join For Free

In this article, we will learn how to create charts in a React application using the Chart.js library. Chart.js is an open-source JavaScript library for creating charts. Chart.js makes it easier to draw different types of charts like line, bar, doughnut, and area charts. In this article, we will create a line chart, bar chart, pie chart, and polar area using React and Web API. See chart.js' docs for more information.

Prerequisites

  • Basic knowledge of ReactJS and Web API.
  •  
  • Visual Studio and Visual Studio Code can be installed.
  • SQL Server Management Studio.

This article covers:

  • Creating a database and table.
  • Creating an ASP.NET Web API Project.
  • Creating a ReactJS Project.
  • Installing the Chart.js library
  • Installing Bootstrap and Axios.
  • Adding routes in ReactJS.

 Create a Table in the Database


Open SQL Server Management Studio, create a database named, "DemoTest," and in this database, create a table. Give that table a name like "Ipltopscorer."

SQL


x
10


1
CREATE TABLE [dbo].[Ipltopscorer](  
2
    [id] [int] IDENTITY(1,1) NOT NULL,  
3
    [Playername] [varchar](50) NULL,  
4
    [Runscore] [int] NULL,  
5
 CONSTRAINT [PK_Ipltopscorer] PRIMARY KEY CLUSTERED   
6
(  
7
    [id] ASC  
8
)WITH (PAD_INDEX = OFF, STATISTICS_NORECOMPUTE = OFF, IGNORE_DUP_KEY = OFF, ALLOW_ROW_LOCKS = ON, ALLOW_PAGE_LOCKS = ON) ON [PRIMARY]  
9
) ON [PRIMARY]  
10
GO  


Add some demo data into this table.


You may also like: Cube.js: Ultimate Guide to the Open-Source Dashboard Framework.

Create a New Asp.net Web API Project


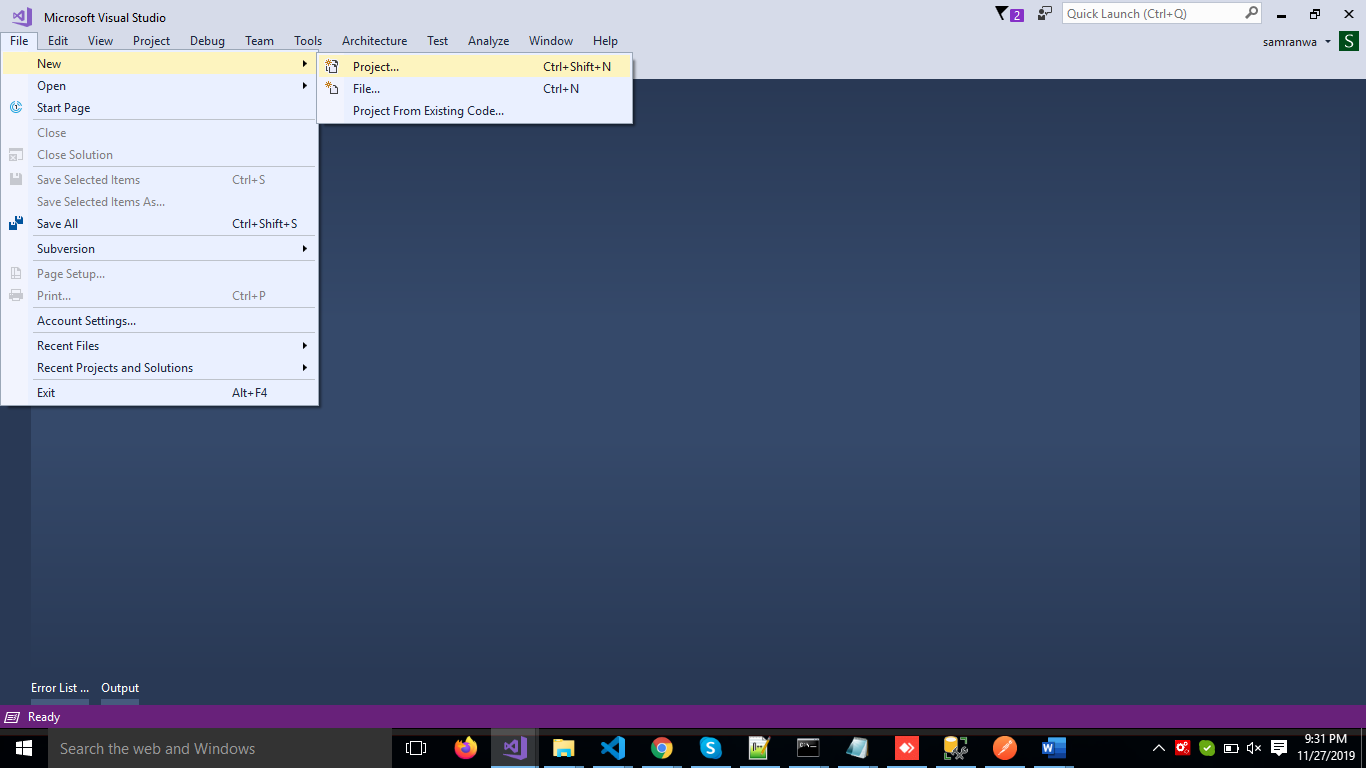
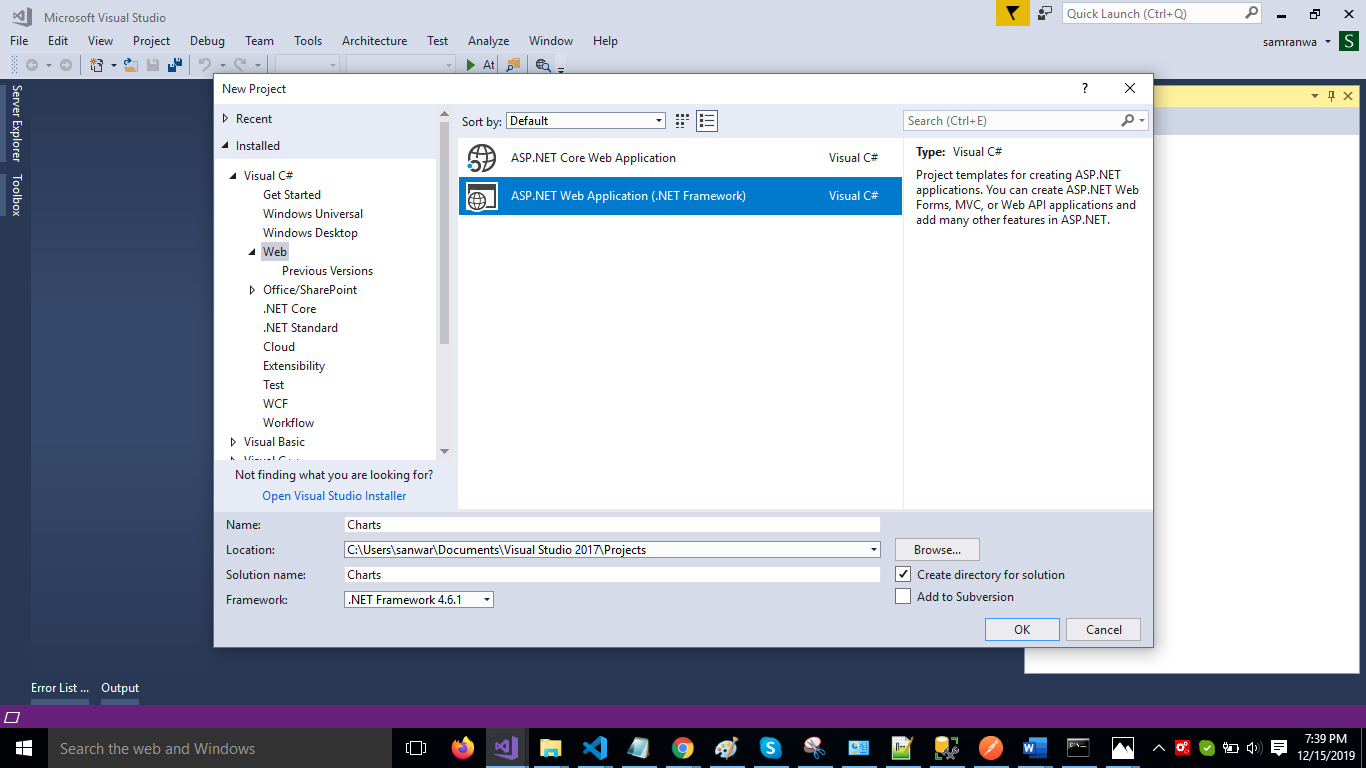
Open Visual Studio and create a new project.


Creating a new project


Change the name to "ChartDemo" and click on Ok.

Changing project name to "ChartDemo"


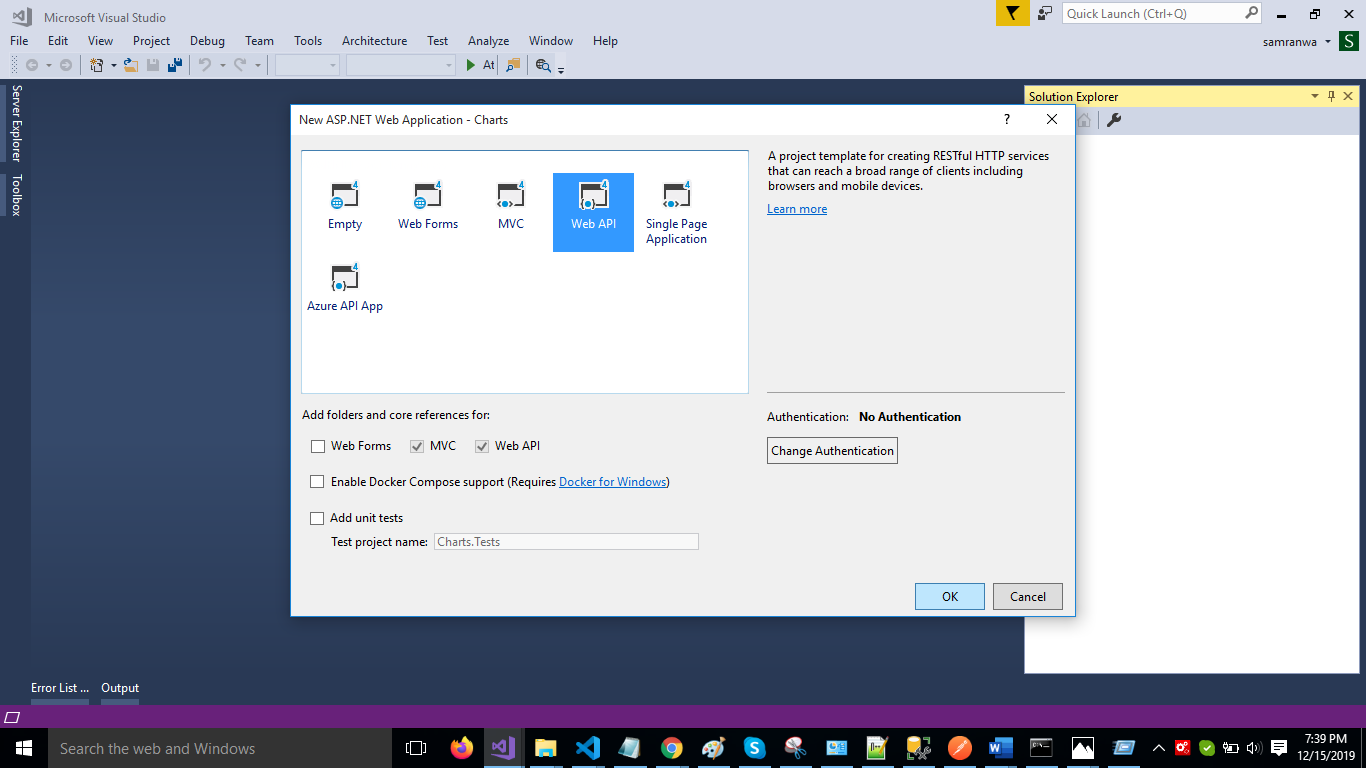
Select Web API as its template.


Selecting Web API as a template


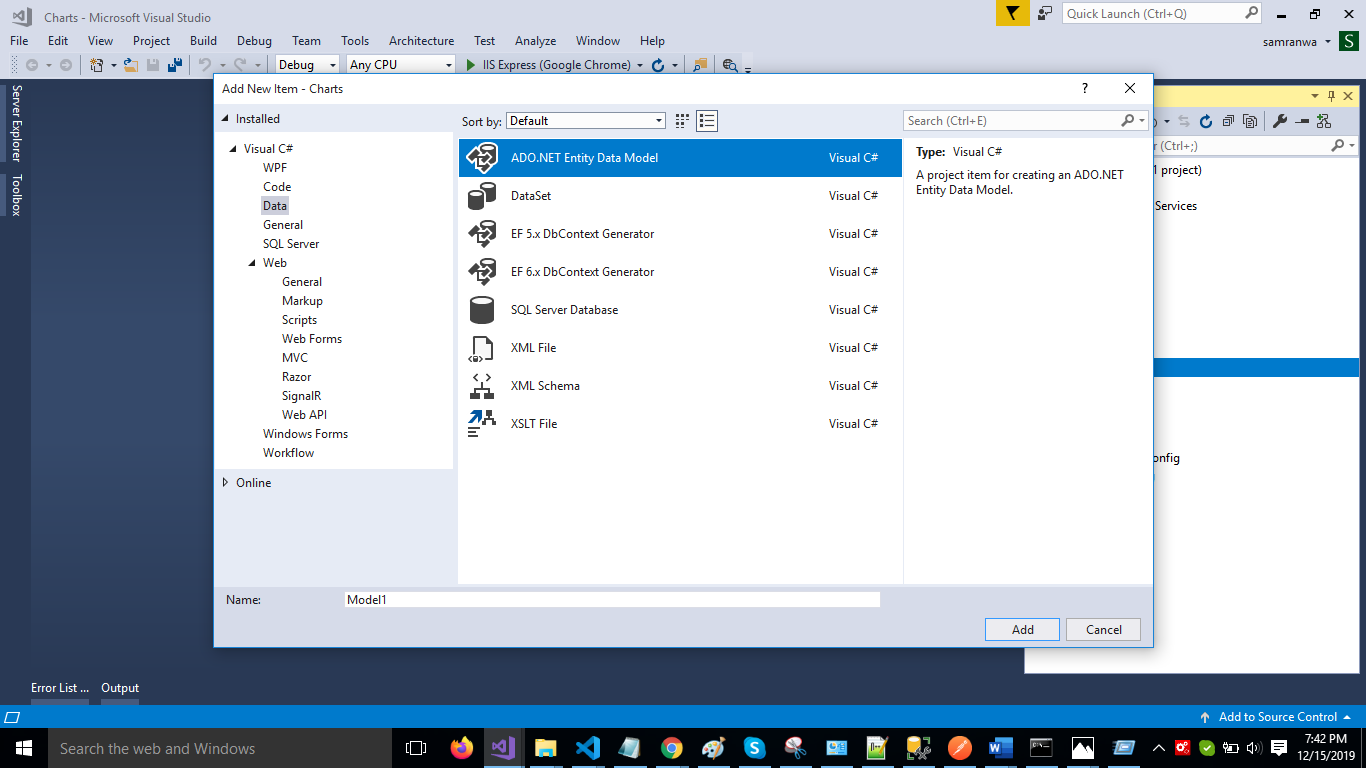
Right-click the Models folder from Solution Explorer and go to Add >> New Item >> data.


Adding new item


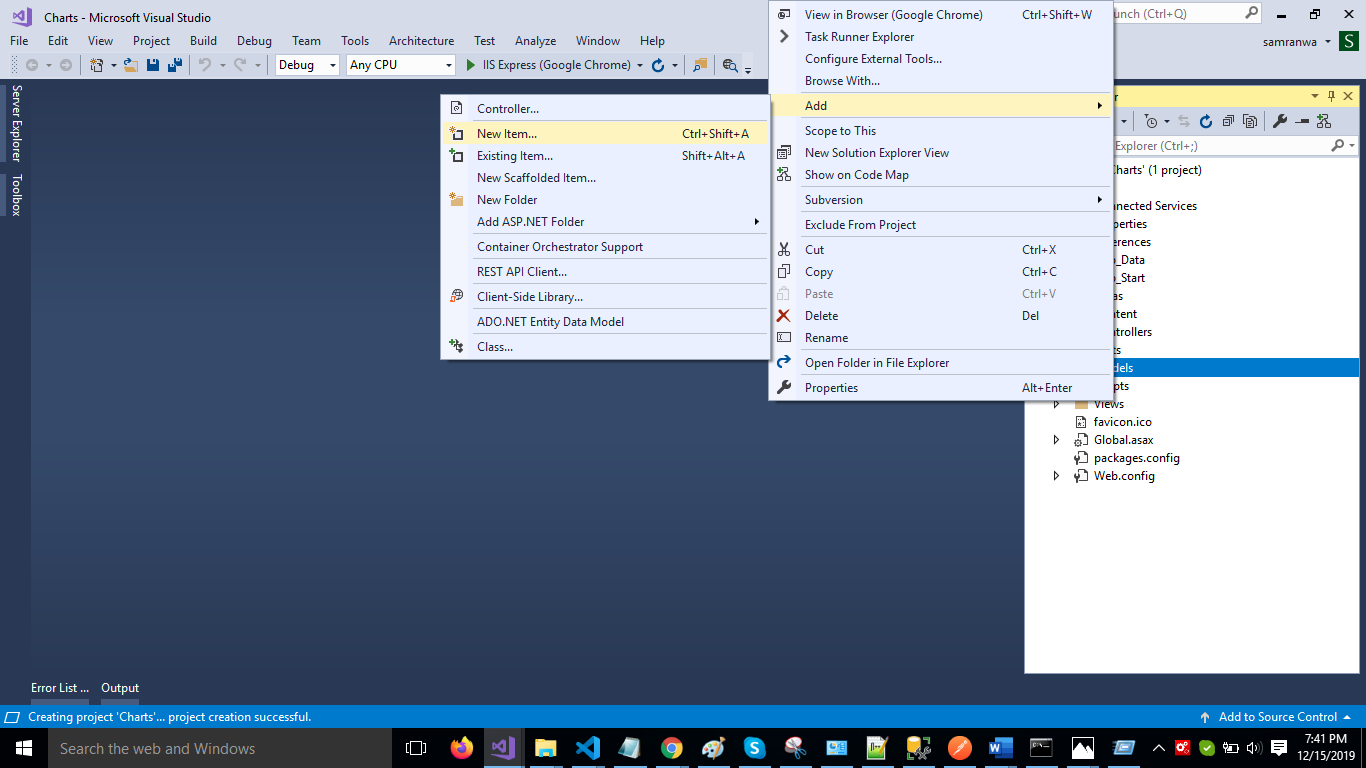
Click on the ADO.NET Entity Data Model option and click Add.


Selecting ADO.NET Entity Data Model


Select EF Designer from the database and click the Next button.

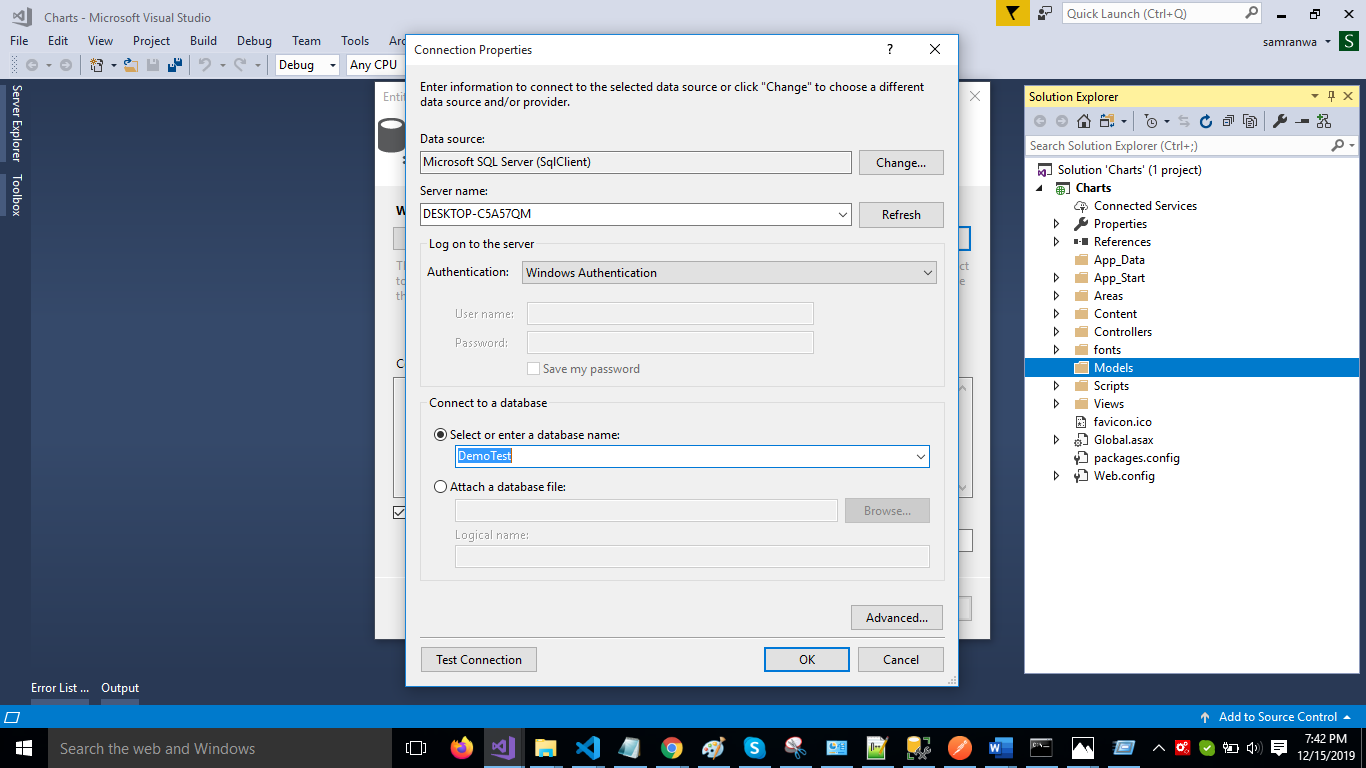
Add the connection properties and select the database name on the next page and click OK.


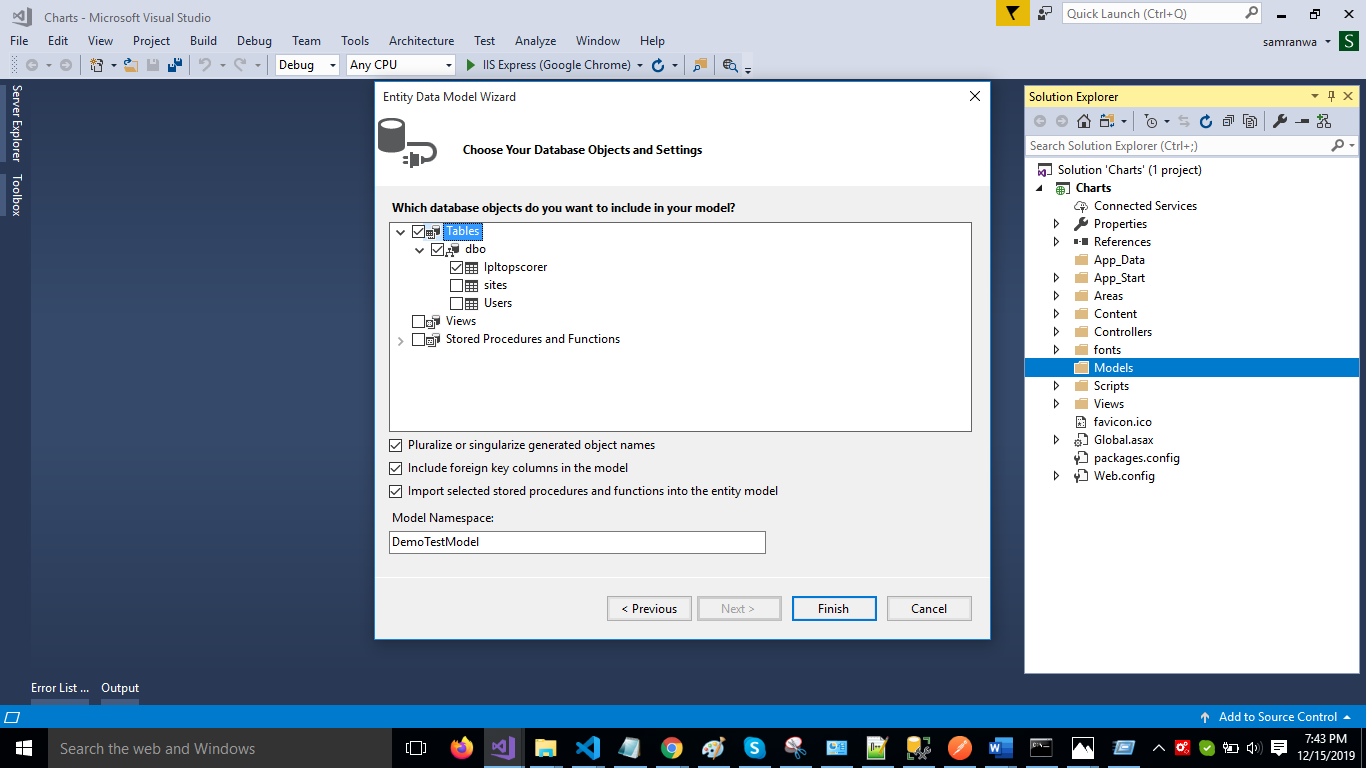
Check the Table checkbox. The internal options will be selected by default. Now, click the Finish button.


Selecting Table checkbox


Our data model is successfully created now. Right-click on the Controllers folder and add a new controller. Name it "Chartcontroller."


Add the following namespace in the Charts Controller.

C#


xxxxxxxxxx
1
 
1
using ChartDemo.Models;  


Add a new method to fetch data from the database.

C#


xxxxxxxxxx
1
 
1
public object Getrecord()  
2
       {  
3
           DemoTestEntities DB = new DemoTestEntities();  
4
           return Json(DB.Ipltopscorers.ToList());  
5
       }  


Complete the Chartcontroller code.

C#


xxxxxxxxxx
1
22
 
1
using System;  
2
using System.Collections.Generic;  
3
using System.Linq;  
4
using System.Net;  
5
using System.Net.Http;  
6
using System.Web.Http;  
7
using ChartDemo.Models;  
8
  
9
namespace ChartDemo.Controllers  
10
{  
11
    [RoutePrefix("API/Charts")]  
12
    public class ChartController : ApiController  
13
    {  
14
        [Route("Getrecord")]  
15
        [HttpGet]  
16
        public object Getrecord()  
17
        {  
18
            DemoTestEntities DB = new DemoTestEntities();  
19
            return Json(DB.Ipltopscorers.ToList());  
20
        }  
21
    }  
22
}  


Now, let's enable Cors. Go to Tools, open NuGet Package Manager, search for Cors, and install the Microsoft.Asp.Net.WebApi.Cors package.

C#


xxxxxxxxxx
1
 
1
EnableCorsAttribute cors = new EnableCorsAttribute("*", "*", "*");      
2
config.EnableCors(cors);  


Create a ReactJS Project


Now create a new React.js project by using the following command:

Shell


xxxxxxxxxx
1
 
1
npx create-react-app reactcharts  


Open the newly created project in Visual Studio code.


Install the Chart.js Library


Now, install the Chart.js library in the React project by typing the following command:

Shell


xxxxxxxxxx
1
 
1
npm install react-chartjs-2 chart.js  


Install Bootstrap in this project by using the following command:

Shell


xxxxxxxxxx
1
 
1
npm install --save bootstrap   


Now, open the index.js file and import Bootstrap.

JavaScript


xxxxxxxxxx
1
 
1
import 'bootstrap/dist/css/bootstrap.min.css';  


Now, install the Axios library by using the following command. Learn more about Axios fromt their docs.

  1. Shell


    xxxxxxxxxx
    1
     
    1
    npm install --save axios    


Now go to src folder and add 5 new components.

  1. Linechart.js.
  2. Barchart.js.
  3. Doughnut.js.
  4. Piechart.js.
  5. Polararea.js.


Now, open Linechart.js, import Line chart from the Chart.js library, and add the following code.

JavaScript


xxxxxxxxxx
1
56
 
1
import React, { Component } from 'react'  
2
import axios from 'axios';  
3
import { Line } from 'react-chartjs-2';  
4
export class Linecharts extends Component {  
5
        constructor(props) {  
6
                super(props);  
7
                this.state = { Data: {} };  
8
        }  
9
        componentDidMount() {  
10
                axios.get(`http://localhost:61022/Api/Charts/Getrecord`)  
11
                        .then(res => {  
12
                                console.log(res);  
13
                                const ipl = res.data;  
14
                                let playername = [];  
15
                                let runscore = [];  
16
                                ipl.forEach(record => {  
17
                                        playername.push(record.Playername);  
18
                                        runscore.push(record.Runscore);  
19
                                });  
20
                                this.setState({  
21
                                        Data: {  
22
                                                labels: playername,  
23
                                                datasets: [  
24
                                                        {  
25
                                                                label: 'IPL 2018/2019 Top Run Scorer',  
26
                                                                data: runscore,  
27
                                                                backgroundColor: [  
28
                                                                        "#3cb371",  
29
                                                                        "#0000FF",  
30
                                                                        "#9966FF",  
31
                                                                        "#4C4CFF",  
32
                                                                        "#00FFFF",  
33
                                                                        "#f990a7",  
34
                                                                        "#aad2ed",  
35
                                                                        "#FF00FF",  
36
                                                                        "Blue",  
37
                                                                        "Red"  
38
                                                                ]  
39
                                                        }  
40
                                                ]  
41
                                        }  
42
                                });  
43
                        })  
44
        }  
45
        render() {  
46
                return (  
47
                        <div>  
48
                                <Line  
49
                                        data={this.state.Data}  
50
                                        options={{ maintainAspectRatio: false }} />  
51
                        </div>  
52
                )  
53
        }  
54
}  
55
  
56
export default Linecharts  


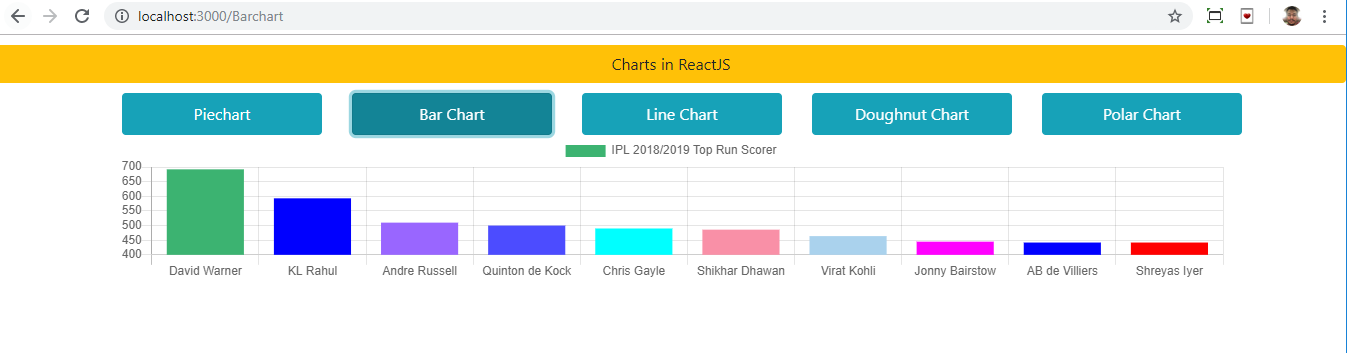
Now, open Barchart.js and add following code:

JavaScript


xxxxxxxxxx
1
55
 
1
import React, { Component } from 'react'  
2
import axios from 'axios';  
3
import { Bar } from 'react-chartjs-2';  
4
export class Barchart extends Component {  
5
        constructor(props) {  
6
                super(props);  
7
                this.state = { Data: {} };  
8
        }  
9
        componentDidMount() {  
10
                axios.get(`http://localhost:61022/Api/Charts/Getrecord`)  
11
                        .then(res => {  
12
                                console.log(res);  
13
                                const ipl = res.data;  
14
                                let playername = [];  
15
                                let runscore = [];  
16
                                ipl.forEach(record => {  
17
                                        playername.push(record.Playername);  
18
                                        runscore.push(record.Runscore);  
19
                                });  
20
                                this.setState({  
21
                                        Data: {  
22
                                                labels: playername,  
23
                                                datasets: [  
24
                                                        {  
25
                                                                label: 'IPL 2018/2019 Top Run Scorer',  
26
                                                                data: runscore,  
27
                                                                backgroundColor: [  
28
                                                                        "#3cb371",  
29
                                                                        "#0000FF",  
30
                                                                        "#9966FF",  
31
                                                                        "#4C4CFF",  
32
                                                                        "#00FFFF",  
33
                                                                        "#f990a7",  
34
                                                                        "#aad2ed",  
35
                                                                        "#FF00FF",  
36
                                                                        "Blue",  
37
                                                                        "Red"  
38
                                                                ]  
39
                                                        }  
40
                                                ]  
41
                                        }  
42
                                });  
43
                        })  
44
        }  
45
        render() {  
46
                return (  
47
                        <div>  
48
                                <Bar data={this.state.Data}  
49
                                        options={{ maintainAspectRatio: false }} ></Bar>  
50
                        </div>  
51
                )  
52
        }  
53
}  
54
  
55
export default Barchart  


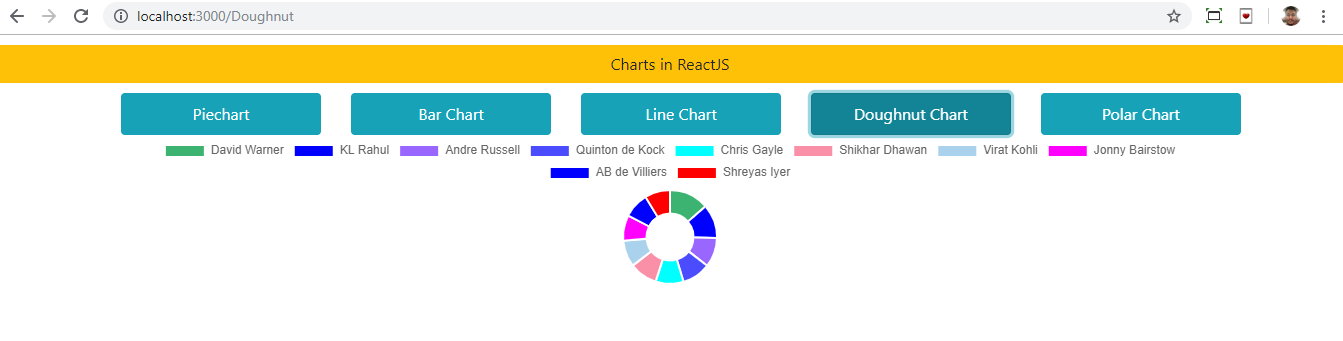
Now, open Doughnut.js and add the following code:

JavaScript


xxxxxxxxxx
1
61
 
1
import React, { Component } from 'react'  
2
import axios from 'axios';  
3
import {Doughnut} from 'react-chartjs-2';  
4
export class Doughnutchart extends Component {  
5
        render() {  
6
                return (  
7
                        <div>  
8
                                  
9
                        </div>  
10
                )  
11
        }  constructor(props) {  
12
                super(props);  
13
                this.state = { Data: {} };  
14
        }  
15
        componentDidMount() {  
16
                axios.get(`http://localhost:61022/Api/Charts/Getrecord`)  
17
                        .then(res => {  
18
                                console.log(res);  
19
                                const ipl = res.data;  
20
                                let playername = [];  
21
                                let runscore = [];  
22
                                ipl.forEach(record => {  
23
                                        playername.push(record.Playername);  
24
                                        runscore.push(record.Runscore);  
25
                                });  
26
                                this.setState({  
27
                                        Data: {  
28
                                                labels: playername,  
29
                                                datasets: [  
30
                                                        {  
31
                                                                label: 'IPL 2018/2019 Top Run Scorer',  
32
                                                                data: runscore,  
33
                                                                backgroundColor: [  
34
                                                                        "#3cb371",  
35
                                                                        "#0000FF",  
36
                                                                        "#9966FF",  
37
                                                                        "#4C4CFF",  
38
                                                                        "#00FFFF",  
39
                                                                        "#f990a7",  
40
                                                                        "#aad2ed",  
41
                                                                        "#FF00FF",  
42
                                                                        "Blue",  
43
                                                                        "Red"  
44
                                                                ]  
45
                                                        }  
46
                                                ]  
47
                                        }  
48
                                });  
49
                        })  
50
        }  
51
        render() {  
52
                return (  
53
                        <div>  
54
                      <Doughnut data={this.state.Data}  
55
                                        options={{ maintainAspectRatio: false }} ></Doughnut>  
56
                        </div>  
57
                )  
58
        }  
59
}  
60
  
61
export default Doughnutchart  


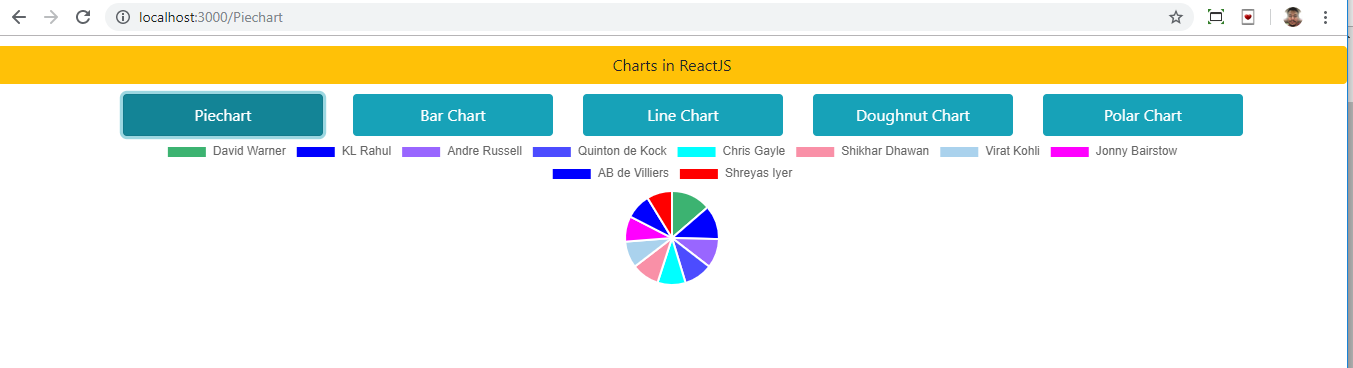
Now, open Piechart.js and add the following code:

JavaScript


xxxxxxxxxx
1
56
 
1
import React, { Component } from 'react'  
2
import axios from 'axios';  
3
import { Pie } from 'react-chartjs-2';  
4
export class Piechart extends Component {  
5
        constructor(props) {  
6
                super(props);  
7
                this.state = { Data: {} };  
8
        }  
9
        componentDidMount() {  
10
                axios.get(`http://localhost:61022/Api/Charts/Getrecord`)  
11
                        .then(res => {  
12
                                console.log(res);  
13
                                const ipl = res.data;  
14
                                let playername = [];  
15
                                let runscore = [];  
16
                                ipl.forEach(record => {  
17
                                        playername.push(record.Playername);  
18
                                        runscore.push(record.Runscore);  
19
                                });  
20
                                this.setState({  
21
                                        Data: {  
22
                                                labels: playername,  
23
                                                datasets: [  
24
                                                        {  
25
                                                                label: 'IPL 2018/2019 Top Run Scorer',  
26
                                                                data: runscore,  
27
                                                                backgroundColor: [  
28
                                                                        "#3cb371",  
29
                                                                        "#0000FF",  
30
                                                                        "#9966FF",  
31
                                                                        "#4C4CFF",  
32
                                                                        "#00FFFF",  
33
                                                                        "#f990a7",  
34
                                                                        "#aad2ed",  
35
                                                                        "#FF00FF",  
36
                                                                        "Blue",  
37
                                                                        "Red"  
38
                                                                ]  
39
                                                        }  
40
                                                ]  
41
                                        }  
42
                                });  
43
                        })  
44
        }  
45
        render() {  
46
                return (  
47
                        <div>  
48
                                <Pie  
49
                                        data={this.state.Data}  
50
                                        options={{ maintainAspectRatio: false }} />  
51
                        </div>  
52
                )  
53
        }  
54
}  
55
  
56
export default Piechart 


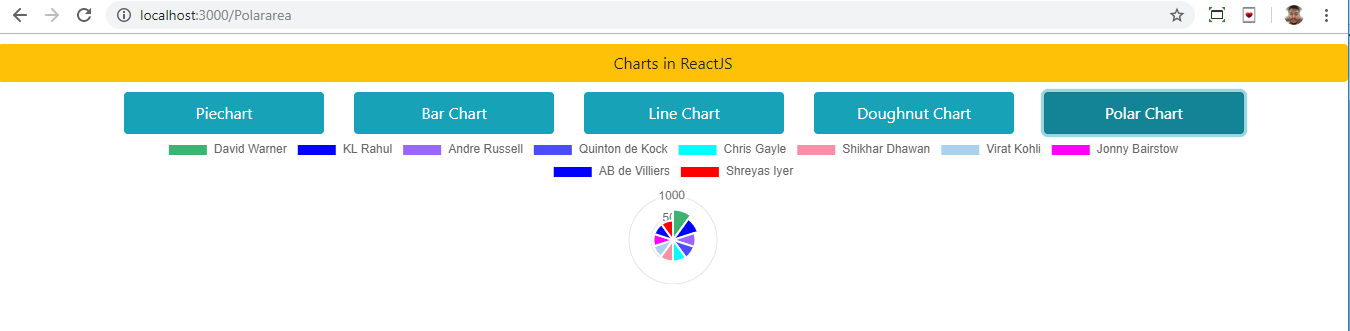
Now, open Polararea.js and add the following code:

JavaScript


xxxxxxxxxx
1
56
 
1
import React, { Component } from 'react'  
2
import { Polar } from 'react-chartjs-2';  
3
import axios from 'axios';  
4
  
5
export class Polararea extends Component {  
6
        constructor(props) {  
7
                super(props);  
8
                this.state = { Data: {} };  
9
        }  
10
        componentDidMount() {  
11
                axios.get(`http://localhost:61022/Api/Charts/Getrecord`)  
12
                        .then(res => {  
13
                                console.log(res);  
14
                                const ipl = res.data;  
15
                                let playername = [];  
16
                                let runscore = [];  
17
                                ipl.forEach(record => {  
18
                                        playername.push(record.Playername);  
19
                                        runscore.push(record.Runscore);  
20
                                });  
21
                                this.setState({  
22
                                        Data: {  
23
                                                labels: playername,  
24
                                                datasets: [  
25
                                                        {  
26
                                                                label: 'IPL 2018/2019 Top Run Scorer',  
27
                                                                data: runscore,  
28
                                                                backgroundColor: [  
29
                                                                        "#3cb371",  
30
                                                                        "#0000FF",  
31
                                                                        "#9966FF",  
32
                                                                        "#4C4CFF",  
33
                                                                        "#00FFFF",  
34
                                                                        "#f990a7",  
35
                                                                        "#aad2ed",  
36
                                                                        "#FF00FF",  
37
                                                                        "Blue",  
38
                                                                        "Red"  
39
                                                                ]  
40
                                                        }  
41
                                                ]  
42
                                        }  
43
                                });  
44
                        })  
45
        }  
46
        render() {  
47
                return (  
48
                        <div>  
49
                      <Polar data={this.state.Data}  
50
                   options={{ maintainAspectRatio: false }} />  
51
                        </div>  
52
                )  
53
        }  
54
}  
55
  
56
export default Polararea  


Add Routing in ReactJS


Install the react-router-dom package by using the following command:

TypeScript


xxxxxxxxxx
1
 
1
npm install react-router-dom --save   


Now, open app.js file and import all five components and the React router component. Add the following code in the app.js file:

JavaScript


xxxxxxxxxx
1
54
 
1
import React from 'react';  
2
import './App.css';  
3
import Piechart from './piechart'  
4
import Doughnutchart from './Doughnutchart'  
5
import Barchart from './Barchart'  
6
import Linecharts from './linecharts'  
7
import Polararea from './Polararea'  
8
import { BrowserRouter as Router, Switch, Route, Link } from 'react-router-dom';  
9
function App() {  
10
  return (  
11
    <div className="App">  
12
      <Router>  
13
        <div>  
14
          <div class="row" className="hdr">  
15
            <div class="col-sm-12 btn btn-warning">  
16
              Charts in ReactJS  
17
          </div>  
18
          </div>  
19
          <div class="row"> >  
20
           <div class="col-sm-1">  
21
            </div>  
22
            <div class="col-sm-2">  
23
              <Link to={'/Piechart'} className="nav-link btn btn-info">Piechart</Link>  
24
            </div>  
25
            <div class="col-sm-2">  
26
              <Link to={'/Barchart'} className="nav-link btn btn-info">Bar Chart</Link>  
27
            </div>  
28
            <div class="col-sm-2">  
29
              <Link to={'/Linecharts'} className="nav-link btn btn-info">Line Chart</Link>  
30
            </div>  
31
            <div class="col-sm-2">  
32
              <Link to={'/Doughnut'} className="nav-link btn btn-info">Doughnut Chart</Link>  
33
            </div>  
34
            <div class="col-sm-2">  
35
              <Link to={'/Polararea'} className="nav-link btn btn-info">Polar Chart</Link>  
36
            </div>  
37
            <div class="col-sm-1">  
38
            </div>  
39
          </div>  
40
        </div>  
41
        <div className="container">  
42
          <Switch>  
43
            <Route exact path='/Piechart' component={Piechart} />  
44
            <Route path='/Barchart' component={Barchart} />  
45
            <Route path='/Polararea' component={Polararea} />  
46
            <Route path='/Doughnut' component={Doughnutchart} />  
47
            <Route path='/Linecharts' component={Linecharts} />  
48
          </Switch>  
49
        </div>  
50
      </Router>  
51
    </div>  
52
  );  
53
}  
54
export default App;  


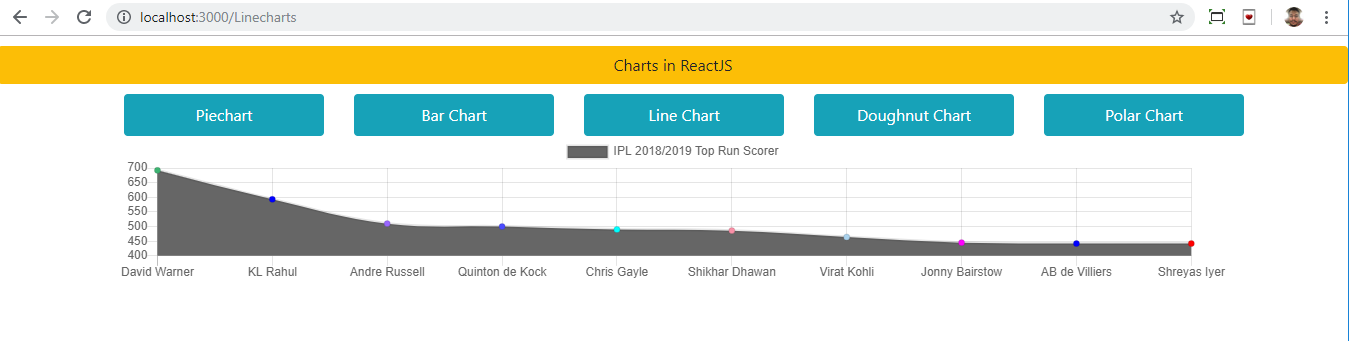
Now, run the project by using npm start command and check the result. Click on the buttons to see each chart.

Line chart

Pie chart

Doughnut chart

Bar graph

Polar chart

Summary


In this article, we learned about Chart.js and how to add it in a ReactJS applications to create charts. In this article, we discussed the line chart, bar chart, pie chart, doughnut chart, and polar area chart. We can also use other Chart libraries in ReactJS to create more visualizations. 


Further Reading

  • How to Learn React.js, Part 1: The React Road Map for Modern Web Developers.
Chart Chart.js Database JavaScript library Web API Open source

Opinions expressed by DZone contributors are their own.

Related

  • Chart.js Line Chart Tutorial: Visualize Route Elevation Data
  • 9 Best Free and Open Source Tools for Reporting
  • Why Architecture Matters: Structuring Modern Web Apps
  • Boosting Similarity Search With Stream Processing

Partner Resources

×

Comments

The likes didn't load as expected. Please refresh the page and try again.

  • RSS
  • X
  • Facebook

ABOUT US

  • About DZone
  • Support and feedback
  • Community research

ADVERTISE

  • Advertise with DZone

CONTRIBUTE ON DZONE

  • Article Submission Guidelines
  • Become a Contributor
  • Core Program
  • Visit the Writers' Zone

LEGAL

  • Terms of Service
  • Privacy Policy

CONTACT US

  • 3343 Perimeter Hill Drive
  • Suite 215
  • Nashville, TN 37211
  • [email protected]

Let's be friends:

  • RSS
  • X
  • Facebook