Create Charts in an Angular 7 Application Using Chart.js
Join the DZone community and get the full member experience.
Join For Free
Chart.js is a powerful open source data visualization library. This helps to visualize or represent a data inside a web application using JavaScipt. It helps to plot the data into 8 different types of chart like bars, lines, pies, etc. This Chart.js graphs are highly customizable and used in web application development to build a responsive and beautiful graph.
Prerequisites
- We should have a basic knowledge of Angular and Web API.
- Visual Studio Code can be installed.
- Visual Studio.
- SQL Server Management Studio.
Project Implementation Steps
- Database.
- Web API to fetch data from the database.
- Angular 7 project.
You may also like: Cube.js and Chart.js Example With Dynamic Dataset.
Step 1
Open SQL Server Management Studio and create a table Tblplayer and add some demo data into this table.
CREATE TABLE [dbo].[Tblplayer](
    [Id] [int] IDENTITY(1,1) NOT NULL,
    [PlayerName] [varchar](50) NULL,
    [Run] [varchar](50) NULL,
PRIMARY KEY CLUSTERED
(
    [Id] ASC
)WITH (PAD_INDEX = OFF, STATISTICS_NORECOMPUTE = OFF, IGNORE_DUP_KEY = OFF, ALLOW_ROW_LOCKS = ON, ALLOW_PAGE_LOCKS = ON) ON [PRIMARY]
) ON [PRIMARY]

GO
SET ANSI_PADDING OFF
GO
SET IDENTITY_INSERT [dbo].[Tblplayer] ON

GO
INSERT [dbo].[Tblplayer] ([Id], [PlayerName], [Run]) VALUES (1, N'Rohit Sharma', N'59')
GO
INSERT [dbo].[Tblplayer] ([Id], [PlayerName], [Run]) VALUES (2, N'Sikar Dhwan', N'19')
GO
INSERT [dbo].[Tblplayer] ([Id], [PlayerName], [Run]) VALUES (3, N'Virat Kholi', N'79')
GO
INSERT [dbo].[Tblplayer] ([Id], [PlayerName], [Run]) VALUES (4, N'Rishabh Panth', N'99')
GO
INSERT [dbo].[Tblplayer] ([Id], [PlayerName], [Run]) VALUES (5, N'Ms Dhoni', N'119')
GO
INSERT [dbo].[Tblplayer] ([Id], [PlayerName], [Run]) VALUES (6, N'H Pandya', N'9')
GO
INSERT [dbo].[Tblplayer] ([Id], [PlayerName], [Run]) VALUES (7, N'B kumar', N'51')
GO
INSERT [dbo].[Tblplayer] ([Id], [PlayerName], [Run]) VALUES (8, N'K Yadav', N'11')
GO
INSERT [dbo].[Tblplayer] ([Id], [PlayerName], [Run]) VALUES (9, N'Chahal', N'4')
GO
INSERT [dbo].[Tblplayer] ([Id], [PlayerName], [Run]) VALUES (10, N'Bumrah', N'9')
GO
INSERT [dbo].[Tblplayer] ([Id], [PlayerName], [Run]) VALUES (11, N'Shami', N'5')
GO
SET IDENTITY_INSERT [dbo].[Tblplayer] OFF
GO
Step 2
Open Visual Studio and create a new project.
Go to File > New > Project.

Select Web API as a Template and click on the OK button.

Step 3
Right-click on the Models folder from Solution Explorer and go to Add >> New Item >> Data. 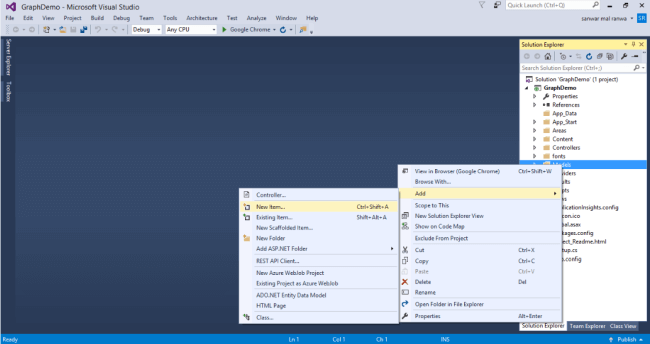 Click on the ADO.NET Entity Data Model option and click Add.
 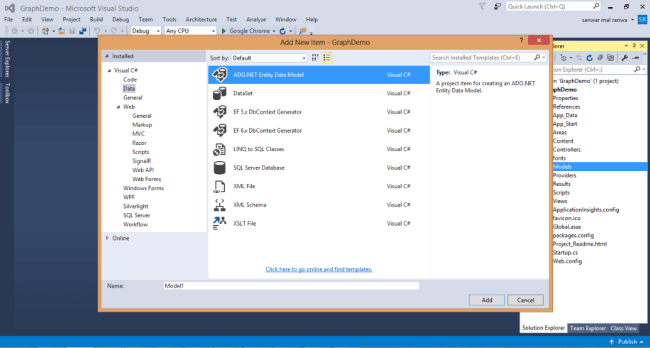 Select EF designer from the database and click the Next button.
 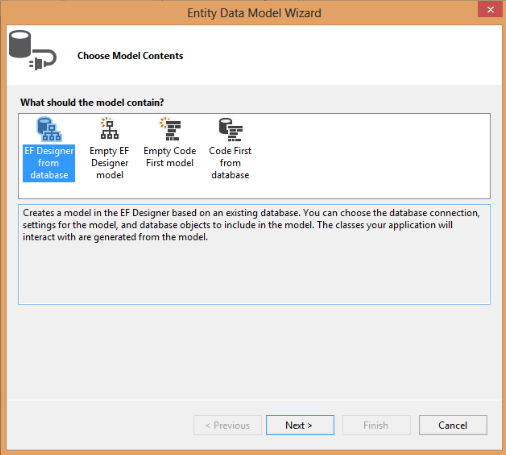 Add the connection properties and select the database name on the next page. Then, click OK.
 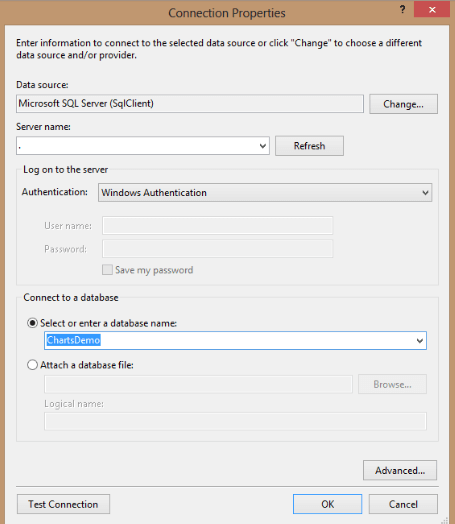 Check Table checkboxes. The internal options will be selected by default. Now, click the Finish button.
 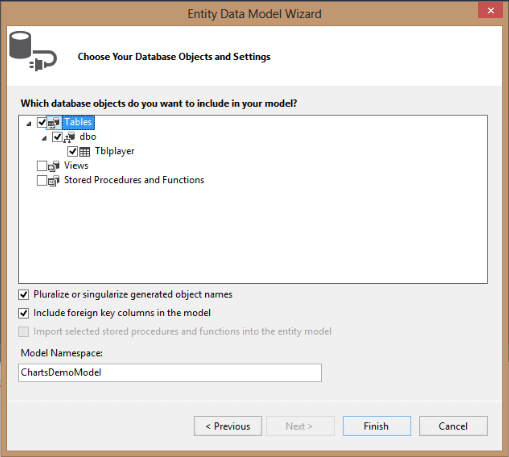 Our data model is created now.
Step 4
Right-click on the Controllers folder and add a new controller. Name it as "Chartscontroller."
Add the following namespace in the Charts Controller.
using GraphDemo.ModelsAdd a new method to fetch data from the database.
[Route("GetCharts")]
        [HttpGet]
        public object GetChartsData()
        {
            ChartsDemoEntities DB = new ChartsDemoEntities();
            return Json(DB.Tblplayers.ToList());
        }
Complete the Chartscontroller code.
using System;
using System.Collections.Generic;
using System.Linq;
using System.Net;
using System.Net.Http;
using System.Web.Http;
using GraphDemo.Models;

namespace GraphDemo.Controllers
{
    [RoutePrefix("API/Charts")]

    public class ChartsController : ApiController
    {
        [Route("GetCharts")]
        [HttpGet]
        public object GetChartsData()
        {
            ChartsDemoEntities DB = new ChartsDemoEntities();
            return Json(DB.Tblplayers.ToList());
        }
    }
}
Step 5
Now, let's enable Cors. Go to Tools, open NuGet Package Manager, search for Cors, and install the Microsoft.Asp.Net.WebApi.Cors package.
Open Webapiconfig.cs and add the following lines.
EnableCorsAttribute cors = new EnableCorsAttribute("*", "*", "*");
config.EnableCors(cors);
Angular 7 Project
Step 1
Create an Angular 7 project with the name "chartjsdemo" by using the following command.
ng new chartjsdemoStep 2
Open Visual Studio Code, open the newly created project, and add Chart.js to this project by using the following command.
npm install chart.js --saveStep 3
Now, create 5 components for the bar chart, line chart, doughnut chart, pie Chart respectively. To create the components, open terminal and use the following commands.
-
ng g c linechart -
ng g c barchart -
ng g c doughnut -
ng g c piechart -
ng g c polararea

Step 4
Create a class named "Data" by using the following command.
ng g class DataAdd the following properties in the Data class.
export class Data {
    PlayerName :string;
    Run:string;
  }
Step 5 - Line Chart
Open the linechart.component.ts file and add the required chart.js module, class, and other required modules.
import { Chart } from 'chart.js';
import { HttpClient } from '@angular/common/http';
import { Data } from '../../app/Data';
linechart.component.ts file
import { Component, OnInit } from '@angular/core';
import { Chart } from 'chart.js';
import { HttpClient } from '@angular/common/http';
import { Data } from '../../app/Data';
@Component({
  selector: 'app-linechart',
  templateUrl: './linechart.component.html',
  styleUrls: ['./linechart.component.css']
})
export class LinechartComponent implements OnInit {

  url = 'http://localhost:58617/API/Charts/GetCharts';
  data: Data[];
  Player = [];
  Run = [];
  Linechart = [];
  constructor(private httpClient: HttpClient) { }

  ngOnInit() {
    this.httpClient.get(this.url).subscribe((result: Data[]) => {
      result.forEach(x => {
        this.Player.push(x.PlayerName);
        this.Run.push(x.Run);
      });
      this
      this.Linechart = new Chart('canvas', {
        type: 'line',
        data: {
          labels: this.Player,

          datasets: [
            {
              data: this.Run,
              borderColor: '#3cb371',
              backgroundColor: "#0000FF",
            }
          ]
        },
        options: {
          legend: {
            display: false
          },
          scales: {
            xAxes: [{
              display: true
            }],
            yAxes: [{
              display: true
            }],
          }
        }
      });
    });
  }
} 
Now, open linechart.component.html file and add the following HTML.
<div class="chart-container" style="position: relative; height:40vh; width:70vw">
  <canvas id="canvas">{{ Linechart }}</canvas>
</div>
Step 6 - Bar Chart
Open barchart.component.ts file and add the following code.
import { Component, OnInit } from '@angular/core';
import { Chart } from 'chart.js';
import { HttpClient } from '@angular/common/http';
import { Data } from '../../app/Data';
@Component({
  selector: 'app-barchart',
  templateUrl: './barchart.component.html',
  styleUrls: ['./barchart.component.css']
})
export class BarchartComponent implements OnInit {
  data: Data[];
  url = 'http://localhost:58617/API/Charts/GetCharts';
  Player = [];
  Run = [];
  barchart = [];
  constructor(private http: HttpClient) { }

  ngOnInit() {
    this.http.get(this.url).subscribe((result: Data[]) => {
      result.forEach(x => {
        this.Player.push(x.PlayerName);
        this.Run.push(x.Run);
      });
      this
      this.barchart = new Chart('canvas', {
        type: 'bar',
        data: {
          labels: this.Player,
          datasets: [
            {
              data: this.Run,
              borderColor: '#3cba9f',
              backgroundColor: [
                "#3cb371",
                "#0000FF",
                "#9966FF",
                "#4C4CFF",
                "#00FFFF",
                "#f990a7",
                "#aad2ed",
                "#FF00FF",
                "Blue",
                "Red",
                "Blue"
              ],
              fill: true
            }
          ]
        },
        options: {
          legend: {
            display: false
          },
          scales: {
            xAxes: [{
              display: true
            }],
            yAxes: [{
              display: true
            }],
          }
        }
      });
    });
  }
}
Open the barchart.component.html file and add the following HTML.
<div class="chart-container" style="position: relative; height:40vh; width:70vw">
  <canvas id="canvas"></canvas>
</div>
Step 7 - Pie Chart
Open the piechart.component.ts file and add the following code.
import { Component, OnInit } from '@angular/core';
import { Chart } from 'chart.js';
import { HttpClient } from '@angular/common/http';
import { Data } from '../../app/Data';
@Component({
  selector: 'app-piechart',
  templateUrl: './piechart.component.html',
  styleUrls: ['./piechart.component.css']
})
export class PiechartComponent implements OnInit {
    title = 'app';
    data: Data[];
    url = 'http://localhost:58617/API/Charts/GetCharts';
    Player = [];
    Run = [];
    chart = [];
    constructor(private httpClient: HttpClient) { }

    ngOnInit() {
      this.httpClient.get(this.url).subscribe((result: Data[]) => {
        result.forEach(x => {
          this.Player.push(x.PlayerName);
          this.Run.push(x.Run);
        });
        this
        this.chart = new Chart('canvas', {
          type: 'pie',
          data: {
            labels: this.Player,
            datasets: [
              {
                data: this.Run,
                borderColor: '#3cba9f',
                backgroundColor: [
                  "#3cb371",
                  "#0000FF",
                  "#9966FF",
                  "#4C4CFF",
                  "#00FFFF",
                  "#f990a7",
                  "#aad2ed",
                  "#FF00FF",
                  "Blue",
                  "Red",
                  "Blue"
                ],
                fill: true
              }
            ]
          },
          options: {
            legend: {
              display: true
            },
            scales: {
              xAxes: [{
                display: true
              }],
              yAxes: [{
                display: true
              }],
            }
          }
        });
      });
    }
  }
Open the piechart.component.html file and add the following HTML.
<div class="chart-container" style="position: relative; height:40vh; width:70vw">
  <canvas id="canvas"></canvas>
</div>
Step 8 - Doughnut Chart
Open the doughnut.component.ts file and add the following code.
import { Component, OnInit } from '@angular/core';
import { Chart } from 'chart.js';
import { HttpClient } from '@angular/common/http';
import { Data } from '../../app/Data';
@Component({
  selector: 'app-doughnut',
  templateUrl: './doughnut.component.html',
  styleUrls: ['./doughnut.component.css']
})
export class DoughnutComponent implements OnInit {
    data: Data[];
    url = 'http://localhost:58617/API/Charts/GetCharts';
    Player = [];
    Run = [];
    chart = [];
    constructor(private httpClient: HttpClient) { }
    ngOnInit() {
      this.httpClient.get(this.url).subscribe((result: Data[]) => {
        result.forEach(x => {
          this.Player.push(x.PlayerName);
          this.Run.push(x.Run);
        });
        this
        this.chart = new Chart('canvas', {
          type: 'doughnut',
          data: {
            labels: this.Player,
            datasets: [
              {
                data: this.Run,
                borderColor: '#3cba9f',
                backgroundColor: [
                  "#3cb371",
                  "#0000FF",
                  "#9966FF",
                  "#4C4CFF",
                  "#00FFFF",
                  "#f990a7",
                  "#aad2ed",
                  "#FF00FF",
                  "Blue",
                  "Red",
                  "Blue"
                ],
                fill: true
              }
            ]
          },
          options: {
            legend: {
              display: true
            },
            scales: {
              xAxes: [{
                display: false
              }],
              yAxes: [{
                display: true
              }],
            }
          }
        });
      });
    }
  }
Open the doughnut.component.html file and add the following HTML.
<div class="chart-container" style="position: relative; height:40vh; width:70vw">
  <canvas id="canvas"></canvas>
</div>
Step 9 - Polararea Chart
Open the polararea.component.ts file and add the following code.
import { Component, OnInit } from '@angular/core';
import { Chart } from 'chart.js';
import { HttpClient } from '@angular/common/http';
import { Data } from '../../app/Data';
@Component({
  selector: 'app-polararea',
  templateUrl: './polararea.component.html',
  styleUrls: ['./polararea.component.css']
})
export class PolarareaComponent implements OnInit {

    url = 'http://localhost:58617/API/Charts/GetCharts';
    data: Data[];
    Player = [];
    Run = [];
    Linechart = [];
    constructor(private httpClient: HttpClient) { }

    ngOnInit() {
      this.httpClient.get(this.url).subscribe((result: Data[]) => {
        result.forEach(x => {
          this.Player.push(x.PlayerName);
          this.Run.push(x.Run);
        });
        this
        this.Linechart = new Chart('canvas', {
          type: 'polarArea',
          data: {
            labels: this.Player,

            datasets: [
              {
                data: this.Run,
                borderColor: '#3cb371',
                backgroundColor: [
                  "#3cb371",
                  "#0000FF",
                  "#9966FF",
                  "#4C4CFF",
                  "#00FFFF",
                  "#f990a7",
                  "#aad2ed",
                  "#FF00FF",
                  "Blue",
                  "Red",
                  "Blue"
                ],
              }
            ],
          },
          options: {
            legend: {
              display: false
            },
            scales: {
              xAxes: [{
                display: false
              }],
              yAxes: [{
                display: true
              }],
            }
          }
        });
      });
    }
  }
Open the polararea.component.html file and add the following HTML.
<div class="chart-container" style="position: relative; height:40vh; width:70vw">
    <canvas id="canvas"></canvas>
  </div>
Step 10
Now, open the app-routing.module.ts file and add the following lines to create routing.
import { NgModule } from '@angular/core';
import { Routes, RouterModule } from '@angular/router';
import { BarchartComponent } from "./barchart/barchart.component";
import { LinechartComponent } from "./linechart/linechart.component";
import { PiechartComponent } from "./piechart/piechart.component";
import { DoughnutComponent } from "./doughnut/doughnut.component";
const routes: Routes = [
  {
    path: 'LineChart', component: LinechartComponent

  },
  {
    path: 'BarChart', component: BarchartComponent
  },
  {
    path: 'PieChart', component: PiechartComponent
  },
  {
    path: 'DoughnutChart', component: DoughnutComponent
  },
   { path:'Polarchart',component:PolarareaComponent }

];

@NgModule({
  imports: [RouterModule.forRoot(routes)],
  exports: [RouterModule]
})
export class AppRoutingModule { }
Step 11
Open the app.component.html file and add the following HTML.
<div>
  <div class="row">
    <div class="col-sm-12 btn btn-primary">
      Batsman Performance Analysis
    </div>
  </div>
  <div class="row" style="margin-top:10px;margin-bottom: 10px;">
    <div class="col-sm-2">
      <button class="btn btn-success" routerLink="/LineChart">Line Chart</button>
    </div>
    <div class="col-sm-2">
      <button class="btn btn-success" routerLink="/BarChart">Bar Chart</button>
    </div>
    <div class="col-sm-2">
      <button class="btn btn-success" routerLink="/PieChart">Pie Chart</button>
    </div>
    <div class="col-sm-2">
      <button class="btn btn-success" routerLink="/DoughnutChart">Doughnut Chart</button>
    </div>
    <div class="col-sm-2">
      <button class="btn btn-success" routerLink="/Polarchart">Polar Area</button>
    </div>
    <div class="col-sm-2">
    </div>

  </div>
</div>
<hr style="background-color:black" />

<router-outlet></router-outlet>
Step 12
Now, open the app.module.ts file and add the following code.
import { BrowserModule } from '@angular/platform-browser';
import { NgModule } from '@angular/core';
import { HttpClientModule } from '@angular/common/http';
import { AppRoutingModule } from './app-routing.module';
import { AppComponent } from './app.component';
import { LinechartComponent } from './linechart/linechart.component';
import { BarchartComponent } from './barchart/barchart.component';
import { PiechartComponent } from './piechart/piechart.component';
import { DoughnutComponent } from './doughnut/doughnut.component';
import { PolarareaComponent } from './polararea/polararea.component';
@NgModule({
  declarations: [
    AppComponent,
    LinechartComponent,
    BarchartComponent,
    PiechartComponent,
    DoughnutComponent,
    PolarareaComponent,
  ],
  imports: [
    BrowserModule,
    AppRoutingModule,
    AppRoutingModule,
    HttpClientModule
  ],
  providers: [],
  bootstrap: [AppComponent]
})
export class AppModule { }
Step 13
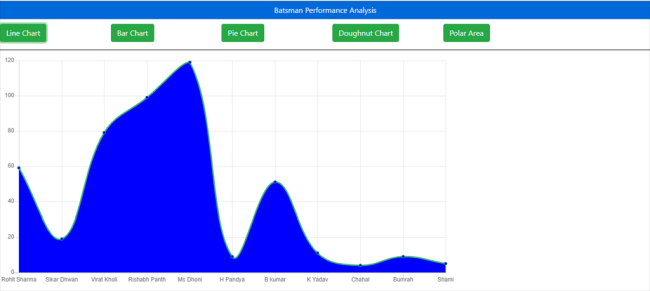
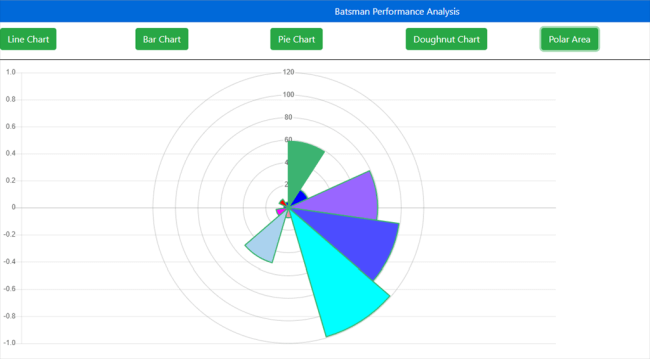
Now, run the project, click on the buttons and check the result.
Line Chart
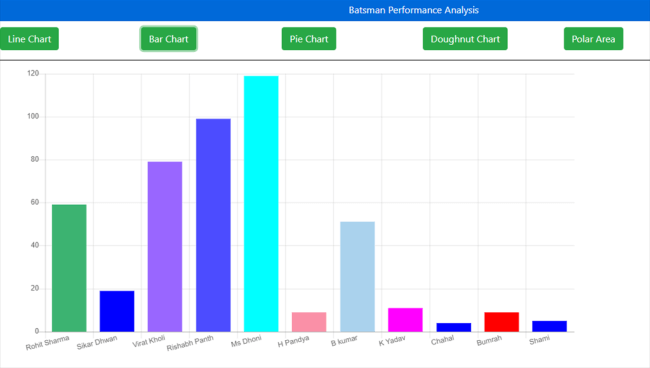
Bar Chart
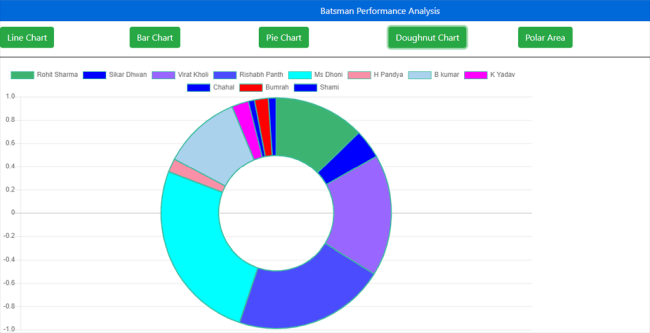
Doughnut Chart
Polararea Chart
Summary
In this article, we learned about Chart.js and how we add chart.js in an Angular application to create Charts. In this article, we discussed the line chart, bar chart, pie chart, doughnut chart, and polar area chart.
Further Reading
Opinions expressed by DZone contributors are their own.
Comments