Snowflake New Web Interface — Snowsight
Snowsight is open for all accounts running on Amazon Web Services and Microsoft Azure, while Google Cloud Platform is planned to be supported.
Join the DZone community and get the full member experience.
Join For FreeIntroduction
Snowflake has recently introduced a new, desktop-quality web user interface for ad-hoc data analysis and verification that supports fast querying, SQL auto-completion, automatic stats, and various charts for data visualization. The application is still in preview mode, meaning the account admins need to click on the Preview App menu and enable Snowsight. As of writing the article, Snowsight is open for all accounts running on Amazon Web Services and Microsoft Azure, while Google Cloud Platform is planned to be supported.

Using Snowsight
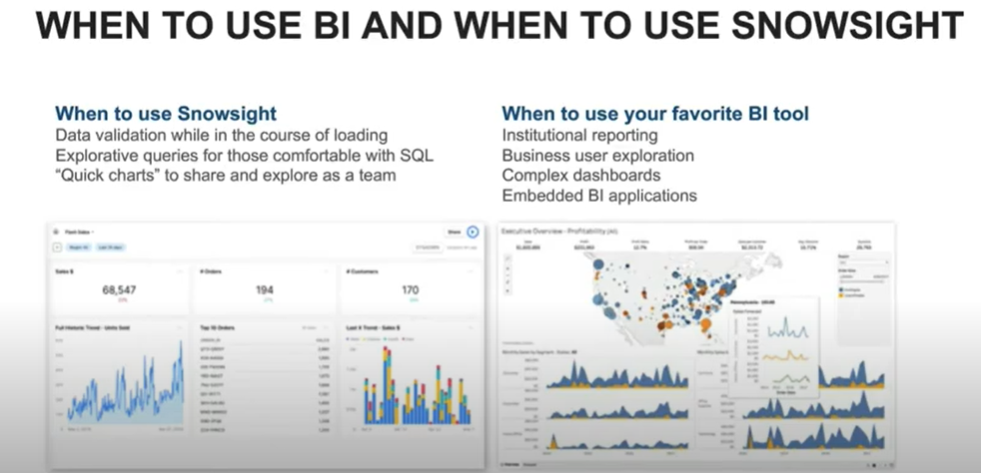
According to Snowflake, the main use cases for Snowsight are data validation, explorative SQL queries, and "quick charts" to share with team members, while the classic BI tools such as Tableau, Qlik, or Power BI are more geared towards corporate reporting needs, business users and complex dashboards
SQL Auto-Completion
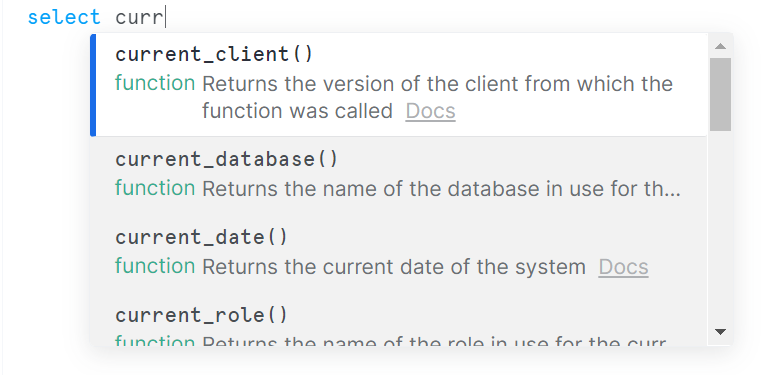
One of the most attractive features of Snowsight compared to the classic Worksheet is that it supports context-sensitive auto-completion.
For instance, if you are typing a SELECT statement and start entering curr, Snowsight will recommend matching SQL functions that can be used in that place.
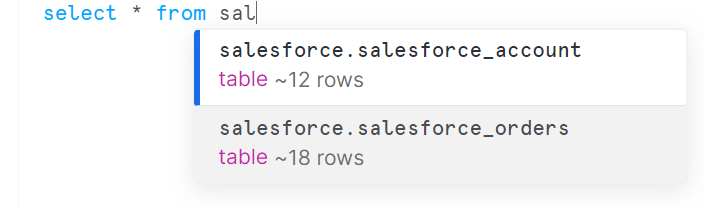
Or, in the FROM section of the SQL statement, you can choose the names of the available tables offered by auto-completion:
Automatic Statistics
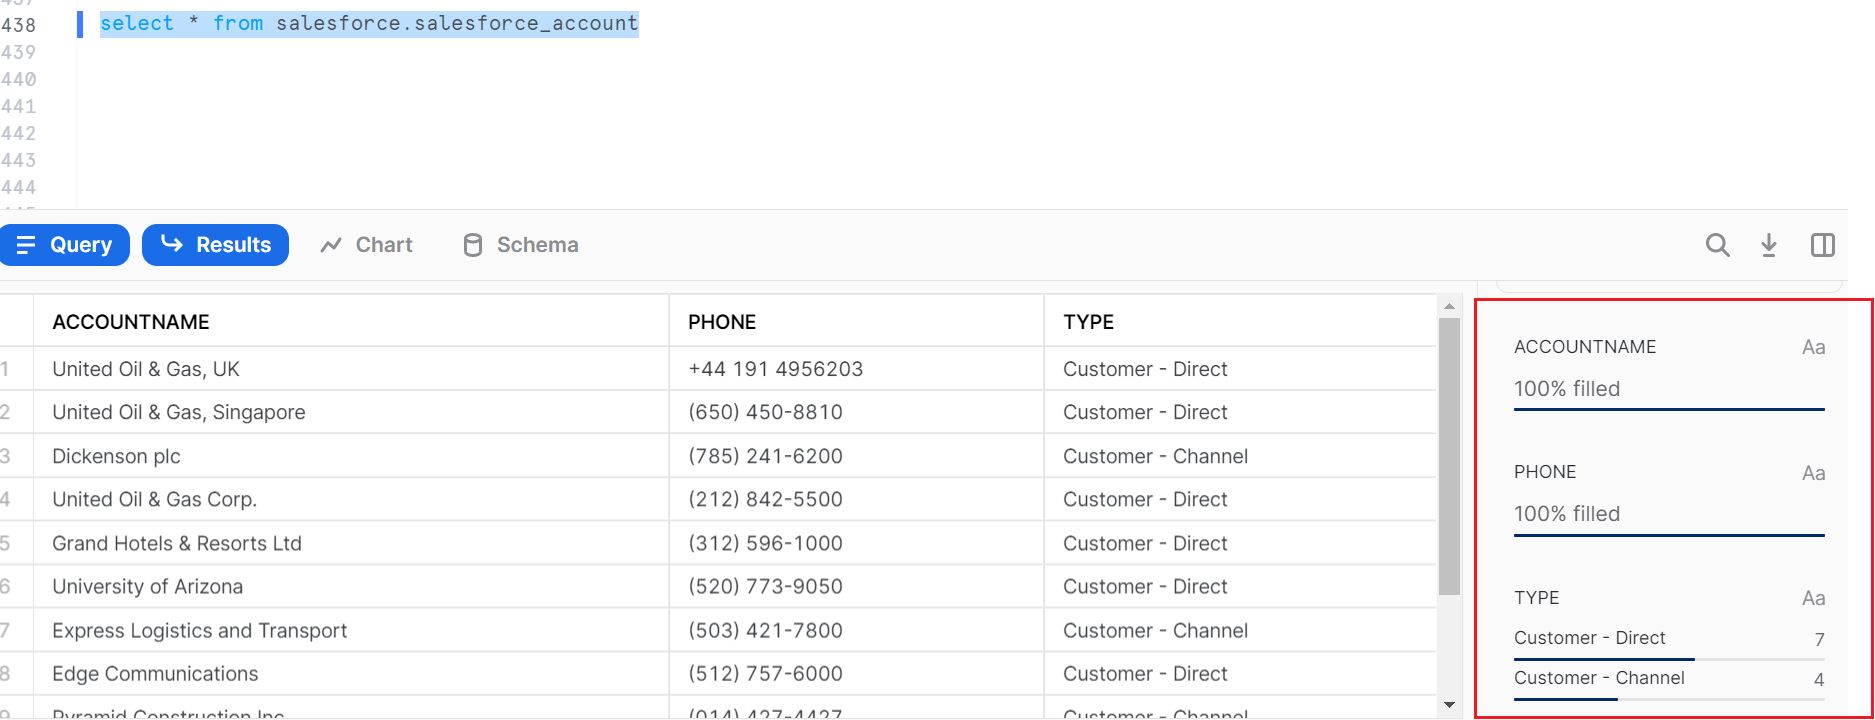
When the SQL queries are executed, the Results section contains the data retrieved by the query and in addition to that, Snowsight will also provide statistics such as how many rows have been retuned, how long running the query took, how well the columns in the table are populated, etc. This can help system admins or data analysts to quickly identify potential data quality issues.
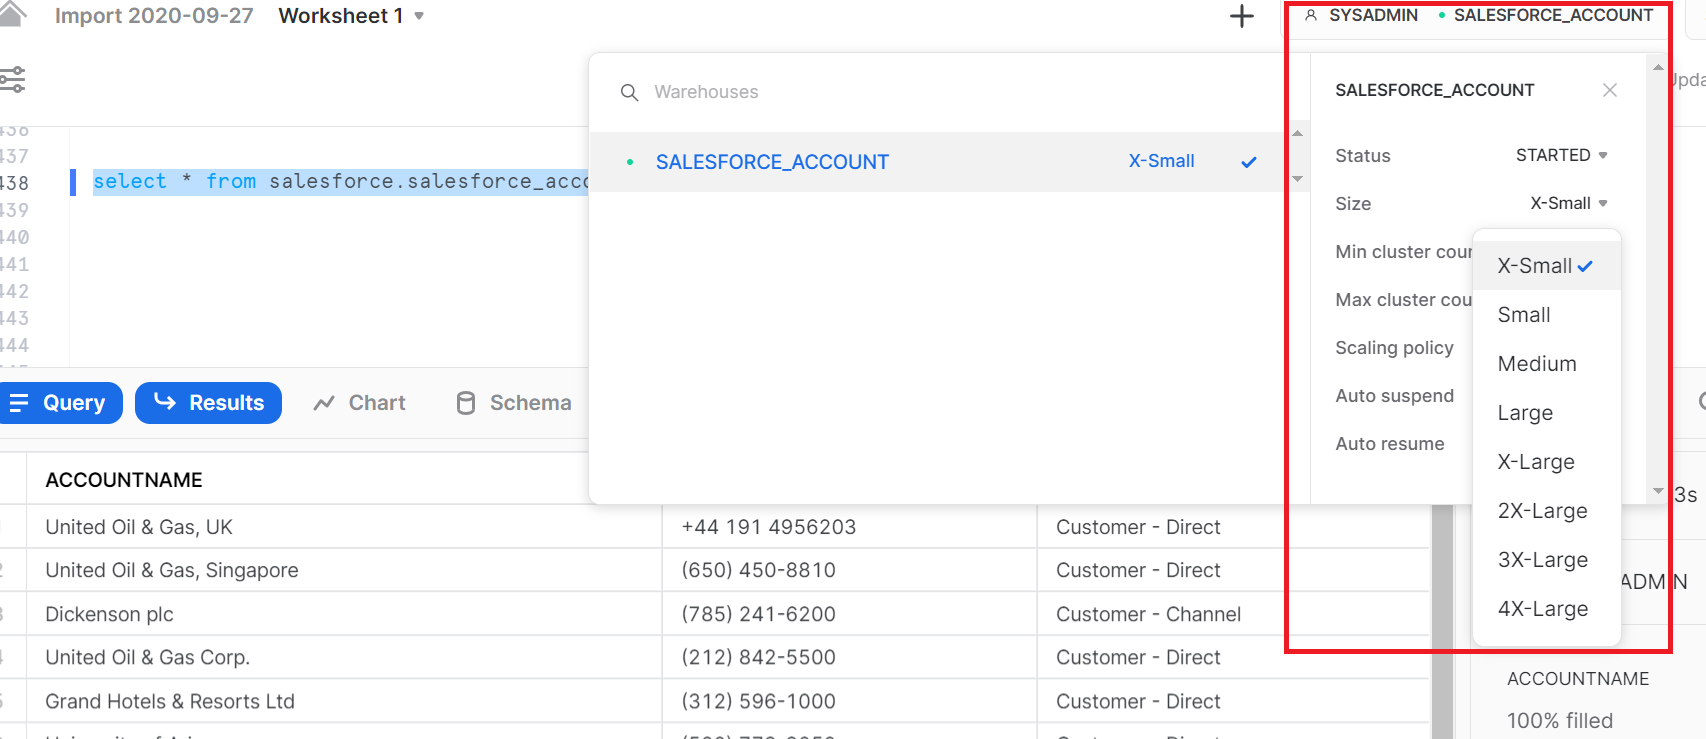
Resizing or Suspending Virtual Warehouses
Another great feature is the ability to resize or suspend the virtual data warehouses from within Snowsight.
Date Range Selection
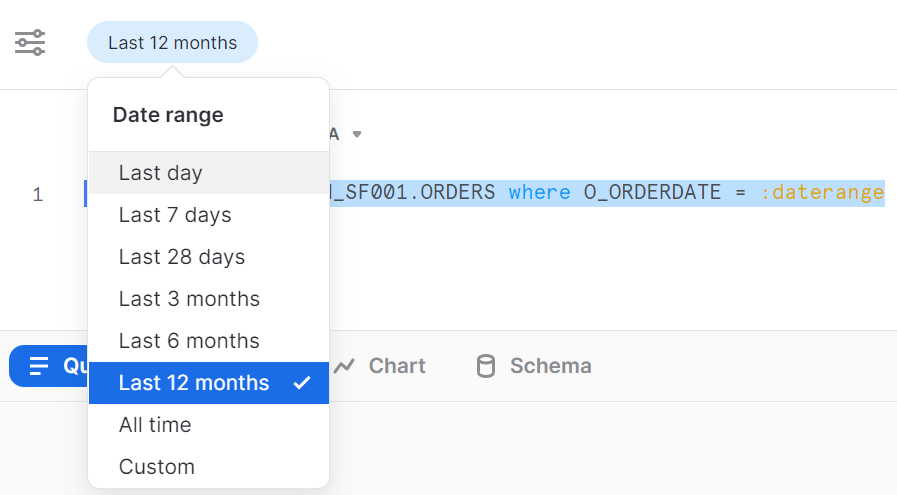
Snowsigth also supports out-of-the-box date range filters to allow users to simplify date selection.
For instance, the following query will generate a filter with multiple options:
select * from TPCH_SF001.ORDERS where O_ORDERDATE = :daterange
The date range filter will let data analysts pick update ranges like Lasy Day, Last 7 Days, Last 28 Days, Last 3 Months, Last 6 Monts, Last 12 Months, All Time, and Custom.
In addition, Account Admins can grant permission for users to create their own custom filters and use them in their subsequent queries.
Charts for Data Visualization
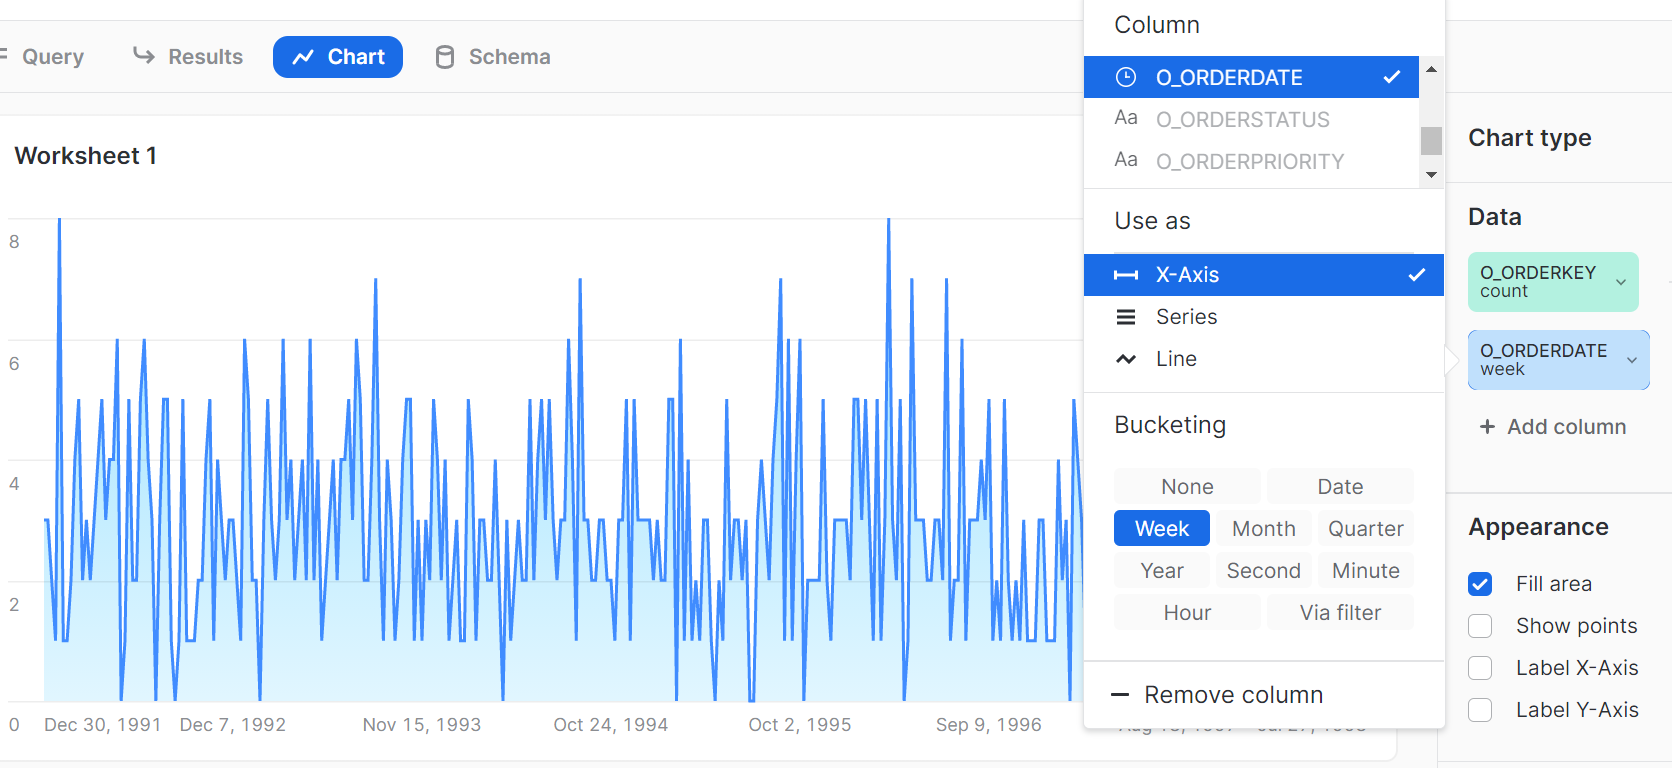
Snowsight supports various charts (line chart, bar chart, scatterplot, etc) to visualoze data.
Below is an example line chart with order data (X-axis displays dates bucketed by weeks, whereas Y-axis displays the order total price)
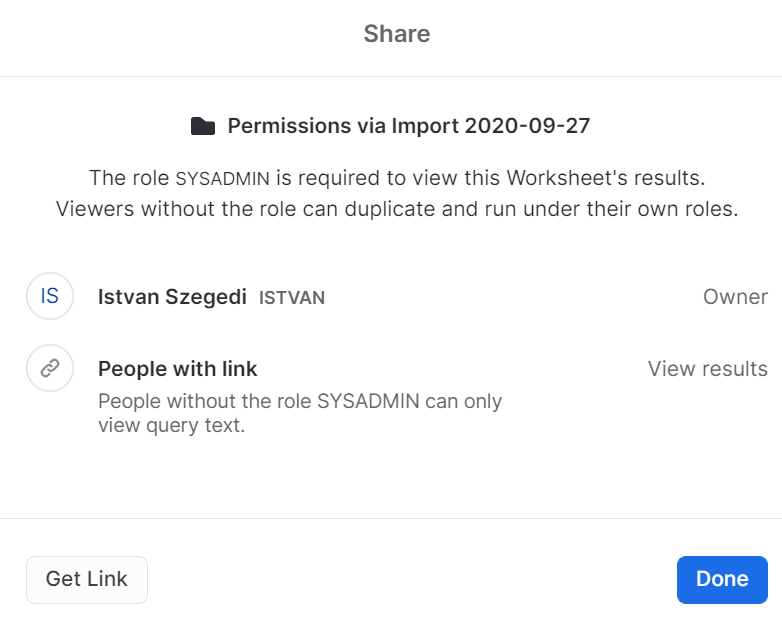
Sharing Your Work With Colleagues
Snowsight enables users to send colleagues links to view worksheets, folders, and dashboards that they own:
Conclusion
Snowsight has become part of Snowflake's web user interface as a result of Snowflake's acquisition of Numeracy. It provides a unique user experience with SQL auto-completion, visual charts, and sharing worksheets and dashboards thus offers a great tool to boost the productivity of the data analyst teams.
Opinions expressed by DZone contributors are their own.
Comments