10 Best JavaScript Charting Libraries for Any Data Visualization Need
If you're interested in learning how to visualize your findings, read on for a list of great data viz libraries to help get you started.
Join the DZone community and get the full member experience.
Join For FreeThere is magic in graphs. The profile of a curve reveals in a flash a whole situation — the life history of an epidemic, a panic, or an era of prosperity. The curve informs the mind, awakens the imagination, convinces.
― Henry D. Hubbard
Nowadays, the amount of data grows exponentially, and the more information we see, the harder it gets to process it. That’s why we need data visualization — in charts and dashboards, preferably interactive one. It helps us humans save a lot of time and effort to view, analyze, and understand data, and make the right, informed decisions based on that data.
There are numerous JavaScript charting libraries out there, each with their specific pros and cons as with any tools. To make your life easier, I decided to tell you about my favorite ones. I think these ten are the best JS libraries for creating charts and can be really helpful in solving one or another particular data visualization task, whether it be basic or advanced. Follow along with me and check them out to make sure you know the basics about them and have not missed out a good one for your project.
Without further ado, let's go.
amCharts

amCharts is one of the JavaScript charting libraries that are helpful when you need a simple, and at the same time, flexible data visualization solution.
Key Features
A pretty big number of chart types including maps and Gantt charts.
A drill down feature along with other great interactivity options.
Documentation containing all the needed methods is quite well-written, but from my point of view, it's not really convenient to use.
Awesome chart animation.
Can be integrated with React, Angular, Vue, and Ember.
A WordPress plugin is available.
Export as an image or PDF.
Live charts, full customization, and W3C-approved accessibility functions.
Full support with priority support for licensed customers.
Customers: Microsoft, Amazon, eBay, NASA, Samsung, Yandex, AT&T, etc.
Pricing
Free for any use, but all charts will include a small, branded link. To remove the link, you need to purchase a paid license (from $180) which also gives you access to priority support.
Learn More About amCharts
AnyChart

AnyChart is a robust, lightweight, and feature-rich JS chart library with rendering in SVG/VML. It actually gives web developers a great opportunity to create different charts that will help them conduct data analysis and make data-driven decisions. Last year, DZone reported AnyChart as one of the best data libraries for JavaScript.
Key Features
More than 80 JS chart types, including basic charts, stock charts, maps, as well as Gantt and PERT charts.
Many ways to set data: XML, JSON, CSV, JS API, Google Sheets, and HTML Table.
Drill down into chart data.
Stock technical analysis indicators and drawing tools (annotations) out-of-the-box.
Rich documentation, API, and friendly support.
Can be integrated with Angular, Qlik, Oracle APEX, React, Elasticsearch, Vue.js, Android, iOS, etc.
A lot of samples and dashboards and a dedicated playground with code autocompletion.
Old browser support.
Exporting charts to various formats including PDF, JPG, PNG, or SVG images, chart data in XSLX or CSV files.
Customers: Oracle, Microsoft, Citi, Samsung, Nokia, AT&T, Ford, Volkswagen, Lockheed Martin, etc.
Pricing
The watermarked version is free. To get rid of the branding, as well as to use AnyChart for any commercial purpose, it's necessary to buy a license (from $49).
Learn More About AnyChart
Chart.js

Chart.js is a simple yet quite flexible JavaScript library for data viz, popular among web designers and developers. It’s a great basic solution for those who don’t need lots of chart types and customization features but want their charts to look neat, clear, and informative at a glance.
Key Features
8 chart types: line, area, bar, pie, radar, polar, bubble, and scatter.
All chart types can be customized and animated, and when used online, all charts are responsive.
Functionality can be extended through the use of plugins.
Documentation is good.
Support via Stack Overflow.
Browsers support IE9+.
Pricing
A free open-source JS charts library. Released under the MIT license.
Learn More About Chart.js
Chartist.js

Chartist is an open-source, unintrusive JS library which can also be used to create nice responsive charts. Generally, it's good for those who need a very simple chart — line, bar, or pie — and who do not require much in terms of data visualization. Good appearance, no need to have many great features in this case.
Key Features
Only three chart types: line, bar, and pie charts.
Great animation.
API documentation contains all the necessary information, but it’s not the easiest to use, requiring long scrolls to navigate.
Allows using plugins to extend the functionality.
Uses SVG to draw the charts (future compatible).
Old browsers support.
Pricing
Open source, free for all kinds of use.
Learn More About Chartist.js
D3.js

D3.js is a powerful open source JavaScript library for data visualization. It has been forked more than 20,000 times on GitHub so far. Basically, D3 is more like a framework than a library. It can be difficult to work with, but there are a lot of helpful resources available out there. And, in the end, you can get so awesome visualizations and graphics of any kind from scratch, making D3 totally worth it.
Key Features
Supports numerous chart types, much more than the vast majority of the other JavaScript charting libraries (e.g. Voronoi diagrams).
Steep learning curve. Less clear and obvious than some commercial libraries on the list (e.g. AnyChart). But there are many tutorials, and the API is truly awesome.
Combines powerful visualization components and a data-driven approach to DOM manipulation.
Easy to debug using the in-browser element inspector.Hundreds of examples.
Curve generating functions.
Drag and drop.
Pricing
D3 is an open source JavaScript library for charts, which is free for all kinds of use.
Learn More About D3.js
FusionCharts

FusionCharts is another good interactive charting library with hundreds of charts ready for use out of the box. The charts accept both JSON and XML data formats and are being rendered via HTML5/SVG or VML.
Key Features
Dozens of chart types, in both 2D and 3D, and 950+ maps covering all continents.
Animated and fully interactive charts and maps.
Server-side APIs for ASP.NET, PHP, and Ruby on Rails.
Compatible with jQuery, Angular, PHP, ASP.NET, React Native, Django, React, Ruby on Rails, Java, etc.
Quite detailed user’s guide and API reference.
A lot of samples and dashboards to check out.
Old browsers support.
Export to PNG, JPG or PDF format.
Support via the knowledge base and community forum.
Unlimited priority support for license holders.
Customers: Apple, IBM, Google, Intel, Microsoft, PayPal, Oracle, Adobe, etc.
Pricing
Free for non-commercial, paid for commercial use (from $497).
Learn More About FusionCharts
Google Charts

Google Charts is an excellent choice for projects that do not require complicated customization and prefer simplicity and stability.
Key Features
The charts are based on HTML5/SVG and VML.
A lot of samples and dashboards to check out.
All charts are interactive, and some are pannable/zoomable as well.
Comprehensive documentation.
Old browser support.
Support via FAQ, GitHub, and forum.
Pricing
The license is free, but the library is not open source. It does not allow you to host Google’s JS files on your server, so it may not suit you if you have some sensitive data.
Learn More About Google Charts
Highcharts

Highcharts is one of the most comprehensive and popular JavaScript charting libraries based on HTML5, rendering in SVG/VML. It’s lightweight, supports a wide range of chart types, and ensures high performance.
Key Features
Uses pure JavaScript, and data can be loaded externally.
Robust documentation, API reference, and community showcase.
Drill down into chart data and other interactivity options.
Can be used with React, Angular, Meteor, .NET, iOS, etc.
Export to PNG, JPG, PDF, or SVG format.
Supports free version users via forum and Stack Overflow, with premium email and Skype support only available for commercial users with the appropriate license.
Customers: Visa, Yahoo!, Facebook, Twitter, Groupon, Nokia, Ericsson, Mastercard, Yandex, etc.
Pricing
Free for use by nonprofits. Paid for commercial use (from $50).
Learn More About Highcharts
Plotly.js
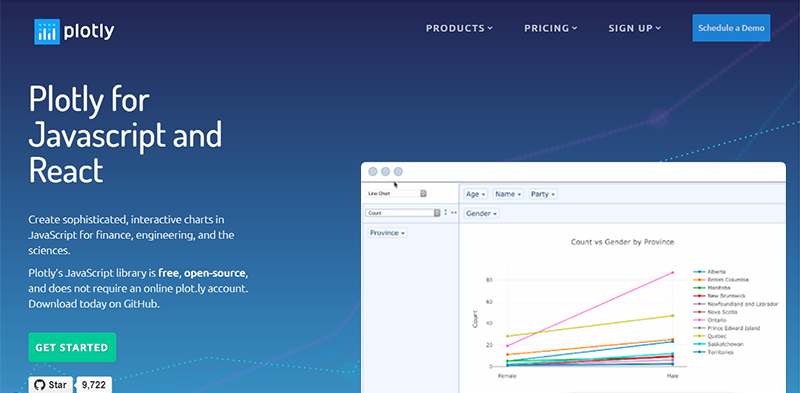
Plotly.js is a high-level JavaScript library, and is free and open-source. It is built on D3.js and WebGL, so can be used to create many different chart types including 3D charts to statistical graphs.
Key Features
20 chart types that can be embedded in websites or used to create dynamic presentations.
Used as a browser-based charting library for Python, R, and MATLAB by abstracting charts to a declarative JSON structure.
Extensive API documentation.
Good animation.
Uses React.
Exporting charts to PNG and JPG; EPS, SVG, and PDF are available on subscription.
A lot of different samples to check out.
Allows using Excel spreadsheets, or connect to your database.
Support forum.
Pricing
Open-source, free library.
Learn More About Plotly.js
ZingChart

ZingChart is a helpful tool for making interactive and responsive charts. This library is fast and flexible, and allows managing big data and generating charts with large amounts of data with ease.
Key Features
- Supports more than 30 chart types.
- Fully customizable with CSS inspired styling.
- Compatible with jQuery, Angular, Node.js, PHP, etc.
- Real-time data, fast rendering of data sets of any size.
- Data can be loaded via JS objects, JSON, CSV, PHP, AJAX, or MySQL.
- Full yet quite easy-to-read API.
- Free and premium support via ZingChart help center, Stack Overflow, email, and chat.
- Customers: Microsoft, Boeing, Adobe, Apple, Cisco, Google, Alcatel, etc.
Pricing
The branded license provides full access to the ZingChart library for free. Commercial usage requires a paid license (from $199).
Learn More About ZingChart
Conclusion
I have listed the best JavaScript charting libraries out there, at least those I consider the top ones. It would be hard to compare all of them comprehensively. Each one of them has its own pros and cons depending on who is going to use it and for what purpose.
Of course, there are some features that make one library faster, more beautiful or flexible than the other. But in the end, no matter what libraries this list contains, the overall winner is always the one that meets your specific requirements. For different people and companies, the choice of the best JS chart library can also be different.
My advice is — check out these libraries as whenever you need JS charts and for whatever project, chances are extremely high that you will find one or several of them to be the best fit. For a longer list, look at a comparison on Wikipedia.
If you need to visualize data in interactive maps, focusing on geographic trends, relationships, connections, flows, and so on — you are welcome to read my earlier article about the best JavaScript libraries for creating map charts.
Have a great day and wonderful data visualizations using JavaScript!
Opinions expressed by DZone contributors are their own.
Comments