Choosing a JavaScript Gantt Chart: Bryntum Gantt, Google Gantt, and DHTMLX Gantt
In this article, we’ll take a look at three tools that you can use for creating online Gantt chart applications. Each of them has its own features and can better suit different developers according to their intentions and requirements of the final product.
Join the DZone community and get the full member experience.
Join For FreeIn this article, we’ll take a look at three tools that you can use for creating online Gantt chart applications. Each of them has its own features and can better suit different developers according to their intentions and requirements of the final product.
Here’s the list of our Gantt charts:
Bryntum Gantt a tool that allows adding the Gantt chart to your Ext JS project. It was made by the Bryntum company that is also known for another Ext JS plug-in, Bryntum Scheduler
DHTMLX Gantt, a stand-alone JavaScript component for creating full-featured Gantt chart apps for cross-browser and cross-platform applications
Google Gantt chart, a Gantt chart from the famous web giant. Google Gantt chart currently is in beta according to the documentation, but there are no reasons not to check what features it can offer
Now, let’s check them in action. We’ll see how the basic charts look and behave, and look into what advanced features we can use to extend functionality.
Bryntum Gantt
Let’s start with the list of the main features:
Critical Path calculation
Lead and Lag
Zooming
Built in customizable context menu
Drag and drop support
Filter tasks on any condition
Different types of dependencies between the tasks (FF/FS/SF/SS)
Integration with any server technology such as PHP, Java, ASP.NET, etc.
Easy localization
Export to PDF/PNG, import from MS Project
And many others. Looks impressive. The getting started guide doesn’t look very detailed and well explained. Seems like it was designed for the advanced users who have a general understanding of how everything works.
After you include the required JavaScript and CSS files, you have to initialize the Gantt chart:
Ext.onReady(function(){

   var taskStore = Ext.create('Gnt.data.TaskStore', {
       autoLoad    :true,
       proxy       : {
           type    :'memory',
           reader  : {
               type :'json'
           },

           data    : [
               {
                   /* define the required tasks here */
               }
           ]
           // eof data
       }
       // eof proxy
   });

   /* panel definition */
});
The TaskStore that we’ve created here will contain the tree of tasks to display. Then we’ve defined that we want to autoload some data in JSON format. The tasks definition looks like this:
"StartDate"  : "2017-01-18",
"EndDate"   : "2017-02-02",
"Id"        : 1,
"Name"      : "Planning",
"expanded"  : true,
Each task has the starting and ending date, the ID, and a name. You can also define if it will be expanded or not. You can create the nested tasks as well.
After that, don’t forget to define and render the panel:
var ganttPanel = Ext.create('Gnt.panel.Gantt', {
       height     :400,
       width      :1000,
       viewPreset :'weekAndDayLetter',
       startDate  :newDate(2017, 0, 15),
       endDate    : Sch.util.Date.add(newDate(2017, 0, 15), Sch.util.Date.WEEK, 3),

       columns    : [
           {
               xtype       :'treecolumn',
               header      :'Tasks',
               sortable    :false,
               dataIndex   :'Name',
               width       :200
           }
       ],

       taskStore       : taskStore
   });

ganttPanel.render(Ext.getBody());
You have to define the size of the panel, the default view preset and date, columns to display, and the source of the data. As a result, you should get something like this:
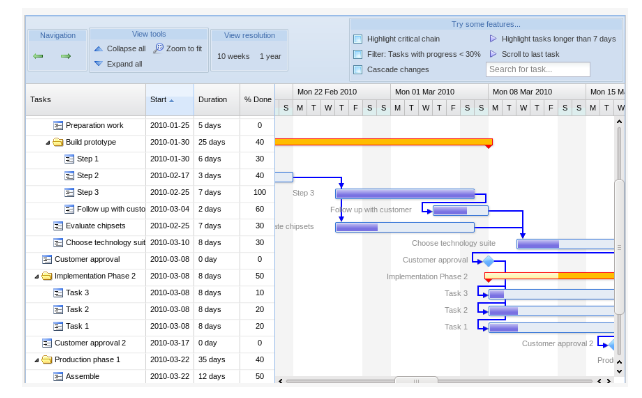
The basic app looks pretty well and full-featured but is there a faster way of creating a Gantt chart. Let’s see.
DHTMLX Gantt
By tradition, we’ll start from the main features:
Cross-browser Gantt chart with support of mobile platforms
Accessibility and keyboard navigation support
Export/import from MS Project
Critical path calculation
Backward planning
Baselines, deadlines, and other custom elements
Auto scheduling
Simple API for hiding/showing columns of the grid
Dynamic loading
Support of custom types
We haven’t mentioned the trivial features like drag-and-drop support or different types of dependencies between the tasks since they repeat similar features of the Ext Gantt. What’s more interesting is features like auto scheduling. It is worth noting that not every Gantt chart allows you to use this feature.
According to the documentation, all you need to do to create a basic Gantt chart is to include the required JavaScript and CSS files to the page, define the DIV container that will contain the chart and use the gantt.init() command to initialize the chart:
<!DOCTYPE html>
<html>
<head>
  <title>How to Start with dhtmlxGantt</title>
  <script src="codebase/dhtmlxgantt.js"></script>
  <link href="codebase/dhtmlxgantt.css" rel="stylesheet">
</head>
<body>
   <div id="gantt_here" style='width:1000px; height:400px;'></div>
   <script type="text/javascript">
       gantt.init("gantt_here");
   </script>
</body>
</html>
You can create a couple of tasks and links between them for the testing needs:
var tasks = {
   data:[
       {id:1, text:"Project #1",start_date:"01-04-2013", duration:11,
       progress:0.6, open: true},
       {/* more tasks */ }
   ],
   links:[
       {id:1, source:1, target:2, type:"1"},
       {/* more links */}
   ]
};
And then render them on the chart:
gantt.init("gantt_here");
gantt.parse (tasks);
That’s all you need to do to get the following result:
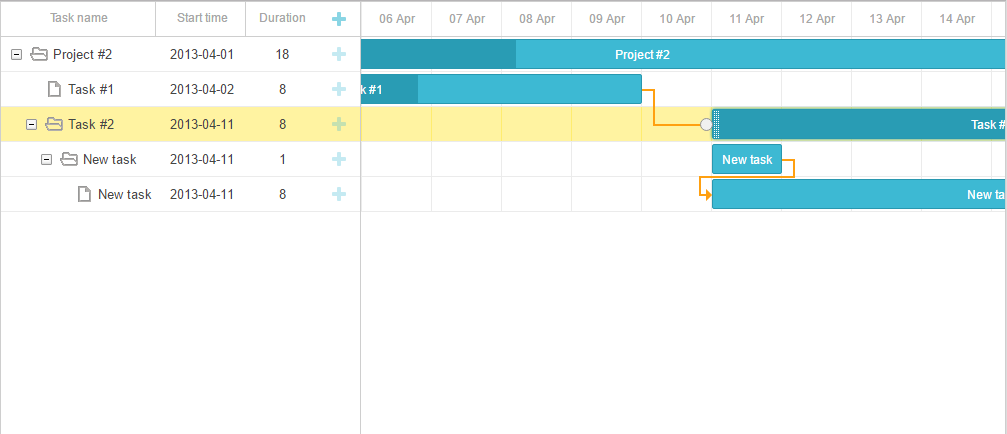
You can add and delete the tasks, move and resize them as you want, define dependencies, and change the task completion percentage. Shortly speaking you can get the working app with the very basic set of features by a couple of lines of code. Adding further improvements like the possibility to work with the database, or calculate the critical path surely require some time, but the detailed documentation page with a lot of step-by-step guides will be a good helper.
Google Gantt Chart
Gantt chart is a new addition to the family of Google charts, and it gathers more and more popularity at the time. Not surprising. It’s Google’s creation after all. At the time of this writing, this chart had the status of beta with the possibility of undergoing substantial revisions. Thus, unlike the other tools from this article this one might not be the best choice for developing the enterprise software.
Google Gantt charts illustrate the start, end, and duration of tasks within a project, and dependencies between the tasks. When the user hovers over the data, the tooltip appears.
For creating a simple chart we have to use the DataTable object that is a basic two-dimensional table. Then we should fill this table with the info that will describe our tasks. Using the addColumn() methods we can define from which data our ask will consist (ID, name, duration, etc), and then, with the addRows() method add as many tasks as we want:
vardata = new google.visualization.DataTable();
data.addColumn('string', 'Task ID');
data.addColumn('string', 'Task Name');
/* more columns */
data.addColumn('string', 'Dependencies');

data.addRows([
 ['Research', 'Find sources',
  newDate(2015, 0, 1), newDate(2015, 0, 5), null,  100,  null],
 ['Write', 'Write paper',
  null, newDate(2015, 0, 9), daysToMilliseconds(3), 25, 'Research,Outline'],
  <...more rows...>
 ['Outline', 'Outline paper',
  null, newDate(2015, 0, 6), daysToMilliseconds(1), 100, 'Research']
]);
Then we have to create a new Gantt object that is related to the particular DIV container of the page and make it to draw our tasks:
var chart = new google.visualization.Gantt(document.getElementById('chart_div'));
chart.draw(data, options);
And we’ll get this neat and accurate Gantt chart:
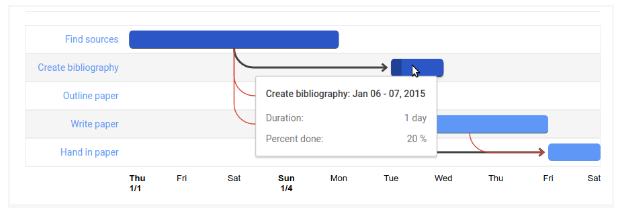
You can see the full example here.
Besides this basic functionality, you can also disable the dependencies between the tasks, calculate the critical path, style the chart and configure its appearance. Pretty much everything that you may need for creating a lightweight, neat, and good-looking chart. But to be honest, Google Gantt Chart loses in functionality to the other two.
Conclusion
Bryntum Gantt looks like a great and powerful tool with tons of handful features. Comprehensive documentation, API reference, a bunch of guides and demos will help you understand what you want and how to get it. But Bryntum Gantt is not for everyone. Since it’s an Ext JS component, it’s probably not a good choice to use it you don't already use the Ext JS framework as one of your main technologies.
DHTMLX Gantt, on the other hand, is a stand-alone JavaScript Gantt chart with no extra dependencies. Want to create a high-performance and configurable online project management app? You should think of DHTMLX Gantt. Rich API, detailed documentation with step-by-step guides will help you. Advanced features like auto-scheduling make this option even more attractive.
Google Gantt Chart in its current state can not compete with the more advanced alternatives. Lightweight and fast charts with the basic features like the critical path and well-written documentary are the main advantages of this tool. But if you’re looking for a library that is full of advanced features, try something else.
Opinions expressed by DZone contributors are their own.
Comments