Core Machine Learning Metrics
All in one comprehensive guide through core machine learning model metrics—a few lessons learned from working with machine learning models.
Join the DZone community and get the full member experience.
Join For FreeCorrectly evaluating model performance is a crucial task while working with machine learning. There are quite a few metrics that we may use to do so. That can be problematic for someone who just started the journey in this field — at least, it was for me.
I will start with describing concepts like true/false negatives/positives as they are the base for more complex metrics. Then I will mention and explain metrics like accuracy, precision, recall, or calibration error. I will also explain the basics behind the confusion matrix and a short code snippet on how to build one.
Why?
Finding resources online and reading them is simple. Everyone can do it, and I did it as well, but I missed an all-in-one glossary for all the stuff. This is my main motivation behind writing this text. First, I will describe all the metrics I came into contact with while working on my previous project.
I think that such a metrics glossary will be useful for all the people new to working with machine learning models.
Metrics
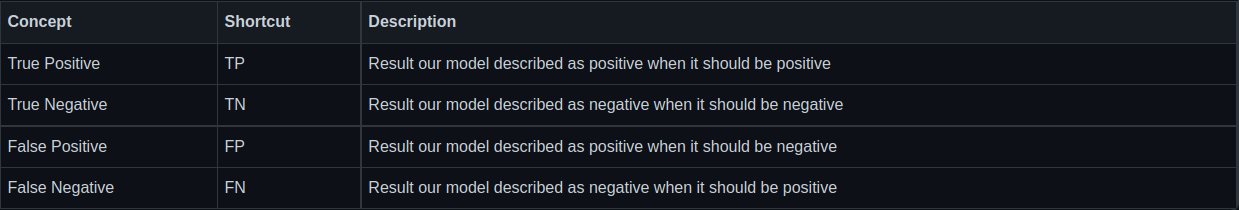
Let's start with true positives and other positive/negative combinations. I will make it in tabular form for easier reading.
True/False Positive/Negative
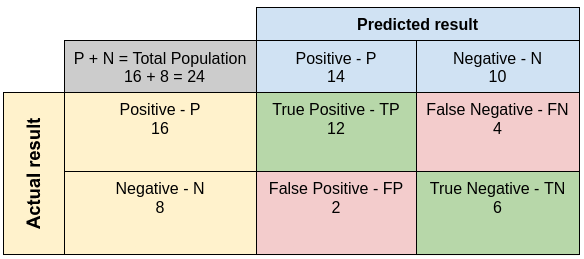
Confusion Matrix
Less commonly known as Error Matrix, it is a basic visual representation of our model performance. The concept takes its name from the fact that it makes it easy to see whether the system is confusing two or more classes. Moreover, in the case of multiclass, we can easily nothing w a pair of classes is the hardest for the model to differentiate.
In most cases, it represents the instances of an actual class in rows while representing the instances of a predicted class in columns. However, there can also be reversed representation when columns are labels and rows are predictions, but it is less frequent.
Accuracy
It is the basic metric when it comes to model performance. It describes how often our model makes correct predictions — usually, the measurement is expressed in percentage.
The problem with accuracy is that it is a very poor metric and is easy to play with. The most notable one is that we can fairly easily achieve high accuracy in quite complex tasks.
For example, in the case of anti-money laundering, you can always just return zero — meaning that this person is not laundering money — and for sure, you will achieve accuracy higher than 95 %. As most people are not actually trying to do any money laundering stuff. The question is: does such high accuracy mean that your model is good or that you will need some other metric to verify your model performance? The answer I leave up to you.
Furthermore, it is easy to overfit the model when one bases only on accuracy. We may make too many assumptions in our code that apply only to our test set and may not generalize at all.
Another problem is that when we incorrectly prepare a test set. It will be too similar to the train set, or part of the test set will be included in the train set. We can once again end up with a quite high accuracy but a poor generalizing model.
As for equations for accuracy — we can express them in terms of true positives and true negatives. Thus it can be viewed as a ratio of correct predictions compared to the whole population.

TP + TN — Correct predictions
P + N — The whole population
Precision
Checks how many positives were, in fact, identified correctly. Represent the ratio of correctly predicted positive classes to all items predicted as positives.
This can be viewed as a ratio of TP to the sum of TP and FP. High precision means that we can easily identify positives. Furthermore, precision helps us to visualize the reliability of the machine learning model in classifying positive classes.

TP + FP — Total number of classified positives
Recall
Less commonly known as sensitivity. It tries to answer the question of what number of actual positives was identified correctly. Represents the ratio of correctly predicted positive classes to all items that are actually positive.
Thus it can be expressed as a ratio of TP compared to the sum of TP and FN. High recall means that we are able to correctly identify most of the positives. While low recall means that model is misidentifying positive values.

TP + FN — All positive samples
Precision and Recall Problem
To fully evaluate the model performance, we need to know both metrics. However, the relationship between them is quite complex. Usually, actions that increase precision results in a decrease in the recall, and vice versa; actions that increase recall result in a decrease in precision. Therefore, you have to carefully balance and pick which metric is the most important for your model use case.
Confidence Score
A number from 0 to 1 (0 to 100 if one is using percentage notation) is used to express how sure our model is of its predictions. In general, the higher the confidence score, the better. A confidence score below 0,5 (50) may indicate random or semi-random predictions.
While evaluating accuracy results for the model, you should also take the Confidence Score into consideration. There is no reason why you should need a model with high accuracy but low confidence. Effectively a model totally uncertain of its predictions. We should aim to express the accuracy of our model within a certain confidence score.
ROC and AUC Score
ROC is an abbreviation for Receiver Operating Characteristic Curve. It is the graphical representation of binary classification prediction ability. Describes the relation between Recall (or true positive rate) and false positive rate (FPR) at various threshold settings.
AUC is an abbreviation for Area Under Curve. While AUROC is the abbreviation for Area Under Receiver Operating Characteristic Curve. It is a number from zero to one, which describes the part of the plot located below the ROC curve. It can be used to describe how well our model can distinguish positive samples from negative samples. Depending on the value of AUC, your model will behave differently.
For AUC value equal to:
- 1 — model will correctly predict all the labels.
- From 0.5 to 1, the higher the AUC, the higher the chance our model will predict results correctly.
- 0.5 — model is not able to distinguish positives from negatives.
- 0 — model will incorrectly predict all the labels (it will classify all positives as negatives and vice versa).
IUO
Intersection over the union in longer form or Jaccard Index. It is a metric for describing the similarities between the two data sets, with a range from 0 to 1 (or 0 to 100 or with percentage notation). The higher the value, the more similar the two populations are.
For IOU equal to:
- 1 — Sets that share all members.
- 0.5 — Sets share half of the members.
- 0 — Sets share no members.
This metric is heavily used in object detection and segmentation to calculate the degree of overlap between segments.
Although it's easy to interpret, it is extremely sensitive to small sample sizes and may give erroneous results, especially with very small samples or data sets with missing observations.
It can be expressed via the following equation:
Jaccard Index = (the number in both sets) / (the number in either set) * 100
In more mathematical notation:

Here you can also see why it is called the intersection over the union, as the first operation is called an intersection, while the second is called a union.
Calibration Error
It describes how well the predicted output probabilities of the model match the actual probabilities of the ground truth distribution. The Calibration Error can be used to visualize how far are given model results are from real-life results.
F1 score
Mixes precision and recall into one metric in a form of their harmonic mean, and it is designed to work better for an imbalanced dataset. It is also the default metric used whenever one needs only one metric to show some results. Both precision and recall are given equal weight, so no one of them has a bigger impact than the other.
We can expect that if both are high, then F1 will also be high, similar to low values of precision and recall. However, what is important is that if one is high and the other one is low F1 value will be somewhere between. As usual, the higher the metric value, the better our model performance.

Which Metric to Choose?
Sooner or later, there begins a problem of which metric to present to stakeholders or on which metric we should focus to make our model better. The answer here is simple — It depends.
For sure, you should not base model performance evaluation on accuracy alone and take more metrics into consideration. But, on the other hand, if you have to use only one metric to present some results, the F1 score or AUC are very good picks.
As for other metrics, their importance greatly depends on your model's purpose and shortcomings:
- If you assess that errors caused by FNs are more undesirable, then you should focus on Recall.
- If you assess that both types of errors are undesirable, then focus on F1.
- If you want your model to be more certain of its prediction, then you should focus on increasing the Confidence Score and reducing Calibration Error.
Additionally, if you want to show or see shortcomings of your model, then you can use Confusion Matrix to easily visualize which classes may be problematic.
Conclusion
There are many metrics that can be used to verify machine learning model performance, and their usage greatly depends on your model use case.
However, remember that you should never base anything on Accuracy only and use other metrics to verify that the model is performing as expected. If you need single metrics to show to your stakeholder, the F1 score can be a good pick. Thank you for your time.
Published at DZone with permission of Bartłomiej Żyliński. See the original article here.
Opinions expressed by DZone contributors are their own.
Comments