Create Spider Chart With ReactJS
You'll be creating a high-performance spider chart application using ReactJS and LightningChart JS that emphasizes UI capabilities and custom charting features.
Join the DZone community and get the full member experience.
Join For FreeHi again!
I've been publishing new data visualization content here in DZone but never published anything about React.
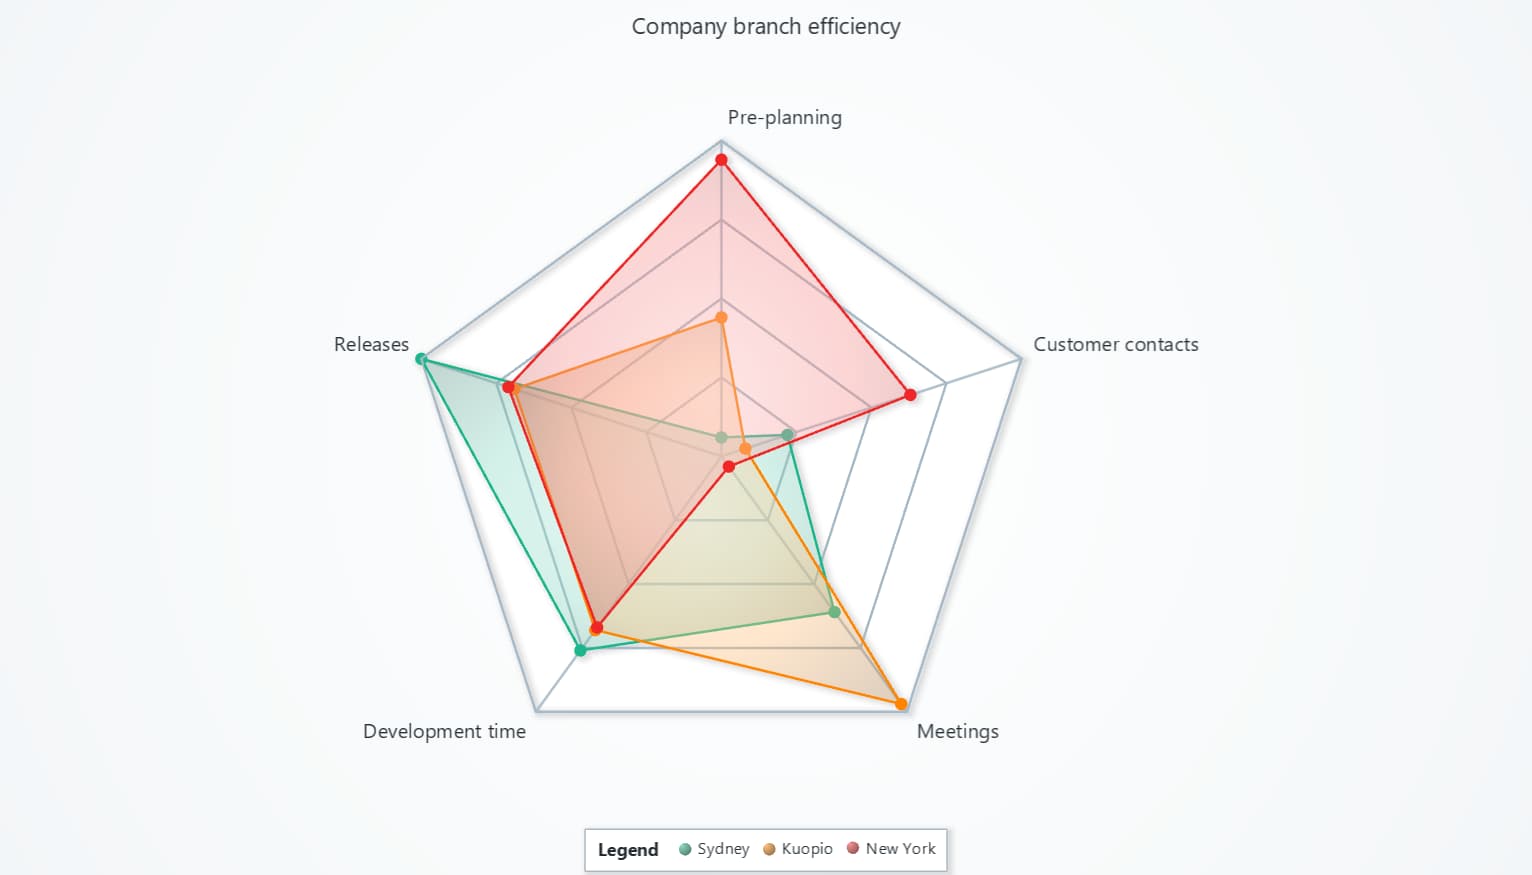
So, now let's see how to create the following JavaScript Spider Chart using ReactJS and the LightningChart JS (LC JS) library.
What Is ReactJS?![react-js-logo]()
Well, ReactJS is a framework created by Facebook, developed with great emphasis on implementing user interfaces.
With more focus on user interfaces, it is recommended to use ReactJS for the view layer, making use of a model-view-controller pattern.
So, for this article, we will do the initial setup of our React project and a brief implementation of LightningChart to show the use of libraries within this project. Let's begin...
1. Installing ReactJS
In order to install ReactJS using commands, you will need to have Node JS and the NPM command interface installed. Additionally, you can visit the official NPM documentation page.
So, already having NPM installed, we can execute the ReactJS installation command. First, we need to open a command prompt as administrator and run the following command:
npm i -g create-react-app
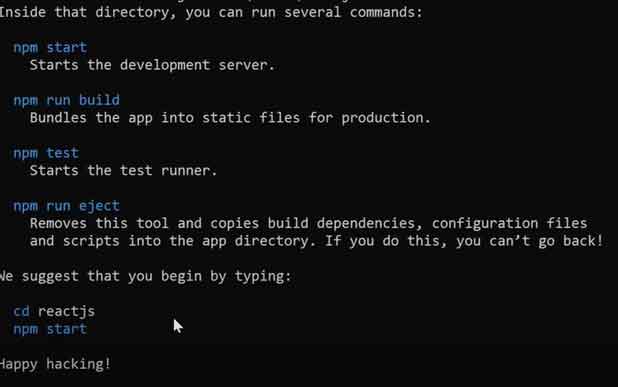
The above command will download the complete React library. Once React is installed, we will see a list of React commands that serve as a confirmation of successful installation.
Now we will create a React project. We will execute the following command from the command prompt:
npx create-react-app lc-react-app
The lc-react-app will be the default name of our project, but you can change the name without problems.
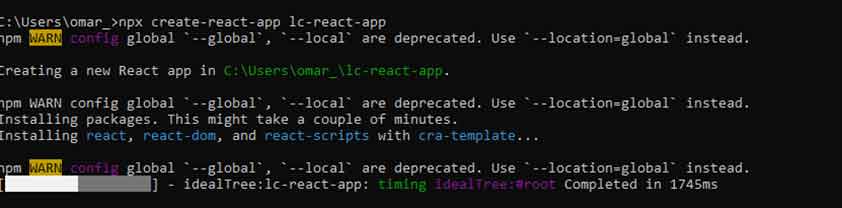
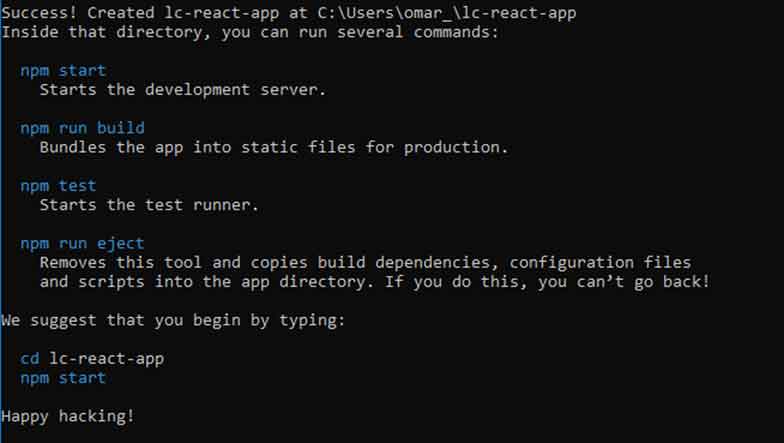
When the project has been created, the path where the project has been stored will be displayed. I recommend cutting and pasting the project into an easily accessible path.
For more information about installing react as either a create-react-app command or as a Webpack and Babe, check out this Angular vs. React vs. Vue article.
2. Configuring the Project
Before we begin, we'll need to install the LightningChart JS (@arction/lcjs) library. Download the ReactJS Spider Chart project template and open it with Visual Studio Code:
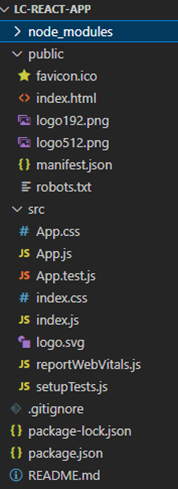
Your project should look the same or similar to the image above. Now open a new terminal so you can install LightningChart JS. The following command npm i @arction/lcjs will install the LightningChart JS library into our project.
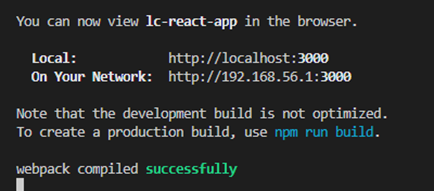
Now, if we execute the npm start command, we will be able to compile and view our page on a local server:

3. Creating the Spider Chart
Before we start with the code for our chart, we have to understand the files we will work with.
Unlike Angular where our views and logic are grouped by component, React starts with a simpler structure. The first thing we will see will be two JS files: index.js and App.js.
These files have a default naming but can be renamed according to your needs. The index file will contain the code that allows us to render the view created by the App.js file.
App.js contains our logic in charge of building the object that will be rendered. The CSS files will modify the style of the objects generated in their corresponding JS files.
When we create a React project, an App.test.js file is generated. This file corresponds to our App.js file and can be used to test our code using the npm test command.
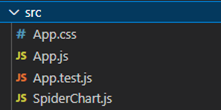
The basic idea is that there is a .test file for each generated JS file. For this project, we will create a new file called SpiderChart.js.
This file will contain the code that will generate our spider chart. We will do it separately in order to keep our chart code organized, instead of embedding everything within the App.js file.
A) Importing Necessary Classes
We'll start by importing the necessary LightningChart JS classes. The way to import components is the same as that used in Angular.
import { lightningChart,LegendBoxBuilders, Themes } from '@arction/lcjs'
import React, { useRef, useEffect } from 'react'
Now we have to create an object that contains our chart and in turn, can be exported to other instances.
const Chart = (props) => {
    const { data, id } = props
    const chartRef = useRef(undefined)

    useEffect(() => {
Using the Effect Hook allows you to run side effects like fetching, direct DOM updating, and timers. Inside the useEffect function, we'll encapsulate all of our spider chart logic.
Now, we will assign the object type "Spider" to the constant "chart". When specifying the chart type, we can assign properties as well. For instance, we can specify the look and feel of the component as well as the container where the chart will be displayed.
const chart = lightningChart().Spider({
            theme: Themes.auroraBorealis,
            container: id
        })
            .setTitle('Company branch efficiency')
            .setAxisInterval(100)
            .setScaleLabelStrategy(undefined)
            .setPadding({ top: 100 })

        const series = [
            chart.addSeries()
                .setName('Sydney'),
            chart.addSeries()
                .setName('Kuopio'),
            chart.addSeries()
                .setName('New York')
        ]
B) Reviewing Properties
setTitle: The title for the chart. The title will be displayed by default at the top of the chart.setAxisInterval: Sets the interval of the Charts Axes. Read more in the setAxisInterval documentation.setScaleLabelStrategy: Sets the strategy for drawing scale labels. It defines which position labels are drawn and whether they are flipped or not. Read more in the setScaleLabelStrategy documentation.addSeries: The addSeries function will allow us to create an independent series of data to be displayed on the chart. These series may have independent visual properties and values.
series.forEach((value, i) => {
            value
                .setPointSize(10)
                .setCursorResultTableFormatter((builder, series, value, axis) =>
                    builder.addRow(`${series.getName()} ${axis}`)
                )
})setCursorResultTableFormatter: It allows displaying values in the series when the cursor is positioned over the series.setPointSize: specifies the size in pixels of each point.
C) Adding Labels to Each Point
const categories = ['Pre-planning', 'Customer contacts', 'Meetings', 'Development time', 'Releases',]D) Assigning Values to the Series
series[0].addPoints(
            { axis: categories[0], value: 6 },
            { axis: categories[1], value: 22 },
            { axis: categories[2], value: 61 },
            { axis: categories[3], value: 76 },
            { axis: categories[4], value: 100 },
        )
Depending on the series, the number of indexes must be changed.
E) Create LegendBox
Create LegendBox as part of SpiderChart.
const legend = chart.addLegendBox(LegendBoxBuilders.HorizontalLegendBox)
            // Dispose example UI elements automatically if they take too much space. This is to avoid bad UI on mobile / etc. devices.
            .setAutoDispose({
                type: 'max-width',
                maxWidth: 0.80,
            })
        // Add SpiderChart to LegendBox
legend.add(chart)setAutoDispose: Dispose of sample UI elements automatically if they take up too much space. This is to avoid bad UI on mobile, etc.legend.add: Adding the legend box to the chart.
F) Return Function
Return function will destroy the graphic when the component is unmounted. The chart will be stored inside a container (id). The class name "chart" will be used to apply the CSS class located in the App.css file.
return () => {
        // Destroy chart.
        console.log('destroy chart')
        chartRef.current = undefined
        }
    }, [id])

    return <div id={id} className='chart'></div>
}

export default Chart
G) Rendering Chart
To render our chart object, we need to import it into our App.js file:
import React, { useEffect, useState } from 'react';
import './App.css'
import Chart from './SpiderChart'

const App = (props) => {
  return <div className='fill'>
    <Chart id='chart'/>
  </div>
}

export default App
The App constant will return the Chart object. Also, we can apply a CSS Class for the body. The CSS class is located in the App.css file. The App constant will be exported to the index.js file.
import React from 'react';
import ReactDOM from 'react-dom/client';
import './index.css';
import App from './App';
import reportWebVitals from './reportWebVitals';

const root = ReactDOM.createRoot(document.getElementById('root'));
root.render(
  <React.StrictMode>
    <App />
  </React.StrictMode>
);
The last step is to import our App.js into index.js. The way to import/export objects between JS files is similar in almost all cases. For Index files, we need to apply some React properties, because here is where we will manipulate the DOM.
React Strict Mode: Strict mode checks are run in development mode only. They do not impact the production build.
4. Final Application
In conclusion, ReactJS and LightningChart JS are powerful tools that can be used to create visually appealing and interactive spider charts for your web applications.
With ReactJS, you can easily manage your UI components and create a smooth user experience, while LightningChart JS provides the necessary data visualization tools to bring your data to life.
Spider charts can be used to represent a wide range of data, from comparing multiple variables on a single chart to tracking progress over time.
With the ability to customize your spider charts using ReactJS and LightningChart JS, you can tailor your charts to fit your specific needs and make them as informative as possible.
By using these two technologies together, you can create stunning spider charts that are both engaging and easy to use.
In case you have any questions, leave a comment with any code snippets, and I'll be happy to help!
See you in the next article! :)
Opinions expressed by DZone contributors are their own.
Comments