[CSF] Using Metrics In Spring Boot Services With Prometheus, Graphana, Instana, and Google cAdvisor
Demonstrating how to instrumentalize and monitor Spring Boot Services on the behalf of a large set of tools. Check out this entry for our Computer Science Fair!
Join the DZone community and get the full member experience.
Join For FreeThis is an entry for DZone's First Annual Computer Science Fair.
This project demonstrates how to instrumentalize and monitor Spring Boot services on the behalf of a large set of tools like, beside others, Prometheus, Graphana, Instana and Google cAdvisor.
Requirements
Some of the requirements that are considerd here are as follows:
- A decentralized way of generating metrics that will be able to cope with the highly dynamic nature of containerized and clusterized environments.
- A multi-dimensional data model that can be queried across as many dimensions as needed.
- An efficient query language that will allow us to exploit the monitoring data model and create effective alerting and visualization.
- Simplicity that will allow (almost) anyone to utilize the system without extensive training.
Technological Stack
This project is designed around Instana APM (https://www.instana.com/) which provides some very interesting functionalities, like the native integration with the container and container orchestration technologies, as well as the support of more ellaborated metrics and alerts.
Another big question when it comes to metrics management is what kind of database is the most appropriate to store and handle them? One of the most prominent time-series databases is Prometheus (https://prometheus.io/). Its biggest advantage is that the community plans to expose Docker metrics natively in Prometheus format. At that time, there is no fixed date when that'll happen, but the progress might be followed here: https://github.com/docker/docker/issues/27307. Hence, Prometheus may be used in such a way that to switch to Docker native metrics, once they are available.
Prometheus is based on a pull mechanism that scrapes metrics from the configured targets. There are two ways we can generate Prometheus friendly data. One is to instrument our own services. Prometheus offers client libraries for Java, Go, Python, Ruby, and others. Instrumenting our services is, in a way, similar to logging.
Even though the instrumentation is the preferred way of providing data that will be stored in Prometheus, when our services cannot be instrumented or, even better, when we do not want to instrument them, we can use Prometheus exporters. Their purpose is to collect already existing metrics and convert them to Prometheus format. And when pulling (scraping) data is not enough, we can change direction and push them. This comes very handy for short-lived jobs which might not be able to pull the data before they are finished and destroyed. In such cases, the short-lived job can push data to the Push Gateway (https://github.com/prometheus/pushgateway) from which Prometheus can scrape metrics. The list of currently supported exporters may be found at the Exporters and Integrations (https://prometheus.io/docs/instrumenting/exporters/) section of the Prometheus documentation.
Okay, now that we have an APM (Instana) and a time-series database (Prometheus) able to collect metrics via its extractors, we need to focus on more container specific metrics. For this purposes we need a container advisor and, one of the most common is cAdvisor from Google. cAdvisor provides an understanding of the resource usage and performance characteristics of their running containers. It is a running daemon that collects, aggregates, processes, and exports information about running containers. Specifically, for each container it keeps resource isolation parameters, historical resource usage, histograms of complete historical resource usage and network statistics. This data is exported container and machine-wide. It has native support for Docker.
All these metrics collected by Instana, Prometheus and cAdvisor need to be now represented graphically. Additionally, we might need to centralize everything in dashboards. Prometheus offers a dashboard builder called PromDash (https://github.com/prometheus/promdash). However, it is deprecated for Grafana, so we won't consider it. Instead Grafana (http://grafana.org/) is one of the leading tools for querying and visualization of time-series metrics. It features interactive and editable graphs and supports multiple data sources, among others Prometheus of course. Grafana is a truly a rich UI that has established itself as a market leader. And the best of all, it's free.
To resume: our project consists of the following services:
- Instana as an APM
- Prometheus as the time-series database hosting metrics
- Prometheus agents to instrumentalize our micro-services such that they generate metrics to be stored in the Prometheus database
- cAdvisor as a container advisor aiming at generating very specialized metrics for containers.
- Instana sensors for Prometheus and cAdvisor able to propagate metrics to the Instana APM
- Graphana as a dashboard tool
Implementation
This project consists in a small Java/Spring Boot prototype having a software architecture based on several Docker interacting containers, as follows:
- A Docker container running the Press Releasemicro-service. This is a Spring Boot based micro-service provided as an example which mimics a press release management process. Its architecture is the most common one as it consists in several layers:
- A REST layer that exposes endpoints for CRUD (Create, Read, Update, Delete) press releases.
- A service layer that implements business logic on top of the REST layer.
- A persistence layer responsible for persisting the data in an H2 database
- A model layer defining the business objects handled by the micro-service
- A data layer defining the entities handled by the micro-service
- A mapping layer which aims at transforming business objects into entities and the reverse. This microservice is using Micrometer (https://micrometer.io/), an instrumentation library that powers the application metrics delivery from Spring. These metrics are collected by the other services, as explained below.
- A Docker container running a Node Exporter service which aims at exporting all the different metrics related to the Press Release micro-service. Please visit (https://github.com/prometheus/nodeexporter) for more information on Node Exporter.
- A Docker container running a Google cAdvisor service. The role of this service is, as explained in the introduction part, to bring in the picture metrics more specific to containers. As a matter of fact, while the Node Exporter handles lots of server-centric metrics, it may lack this kind of very specific metrics. cAdvisor has also a very nice GUI (Graphical User Interface) which, in general, interests a lot the management. But despite its impressive look, this GUI is more or less useless for anything then a single server.
- A Docker container running the Prometheus time-series database. This is the database that stores the collected metrics.
- A Docker container running Grafana. This service will be used in order to design dashboards.
Modus Operandi
Please follow the instructions below in order to build and run the project:
1. Clone the GIT repository and get the develop branch:
xxxxxxxxxx
$ git clone https://github.com/nicolasduminil/spring-metrics.git
$ cd metrics
$ git checkout develop
2. Build the project using maven:
xxxxxxxxxx
$ mvn -DskipTests clean install
...
[INFO] ------------------------------------------------------------------------
[INFO] BUILD SUCCESS
[INFO] ------------------------------------------------------------------------
[INFO] Total time: 10.585 s [INFO] Finished at: 2020-03-03T13:33:28+01:00
[INFO] ------------------------------------------------------------------------
3. Check that all the required Docker containers are up and running:
xxxxxxxxxx
$ docker ps
CONTAINER ID IMAGE COMMAND CREATED STATUS PORTS NAMES
ff889b499ad0 openjdk:8-jdk-alpine "/usr/local/share/hm…" ... press_release
fb885334f561 instana/agent "./bin/run.sh" ... instana
b58aff5bf43a grafana/grafana:4.5.2 "/run.sh" ... grafana
6189d4a5580e google/cadvisor:v0.24.1 "/usr/bin/cadvisor -…" ... advisor
8dd855cc1a1c basi/node-exporter:v0.1.1 "/docker-entrypoint.…" ... node_exporter
4. Check that all the services are started and that there are no exceptions raised. You should see a listing similar to the below one. Here, the services Node Exporter, cAdvisor, Grafana, etc. are started one after one and our Press Release service waits for all of them to have started before it starts itself.
xxxxxxxxxx
$ docker logs press_release --details
********************************************************
Waiting for the Node Exporter service to start 9100
********************************************************
>>>>>>>>>>>> The Node Exporter service has started
********************************************************
Waiting for the cAdvisor service to start on port 8080
********************************************************
>>>>>>>>>>>> The cAdvisor service has started
********************************************************
Waiting for the Prometheus service to start on port 9090
********************************************************
>>>>>>>>>>>> The Prometheus service has started
********************************************************
Waiting for the Grafana service to start on port 3000
********************************************************
>>>>>>>>>>>> The Grafana service has started
********************************************************
Starting the Press Release service on
********************************************************
5. Use the Swagger interface to exercise the REST API. The Press Release REST layer exposes a Swagger interface on the behalf of which you can exercice and test the API. Use your preferred browser to navigate at http://<ip-address>:8081/swagger-ui.html#/, where <ip-address> is the IP address of the container running the Press Release service. It may be obtain using the following command:
xxxxxxxxxx
$ docker exec -it press_release ip addr
1: lo: <LOOPBACK,UP,LOWER_UP> mtu 65536 qdisc noqueue state UNKNOWN qlen 1000
link/loopback 00:00:00:00:00:00 brd 00:00:00:00:00:00
inet 127.0.0.1/8 scope host lo valid_lft forever preferred_lft forever
310: eth0: <BROADCAST,MULTICAST,UP,LOWER_UP,M-DOWN> mtu 1500 qdisc
noqueue state UP link/ether 02:42:c0:a8:e0:07 brd ff:ff:ff:ff:ff:ff
inet 192.168.224.7/20 brd 192.168.239.255 scope global eth0 valid_lft
forever preferred_lft forever
6. In order to exercise the API interface, you need to unwind the drop-down labeled press-release-controller. The following screen will be presented to you:
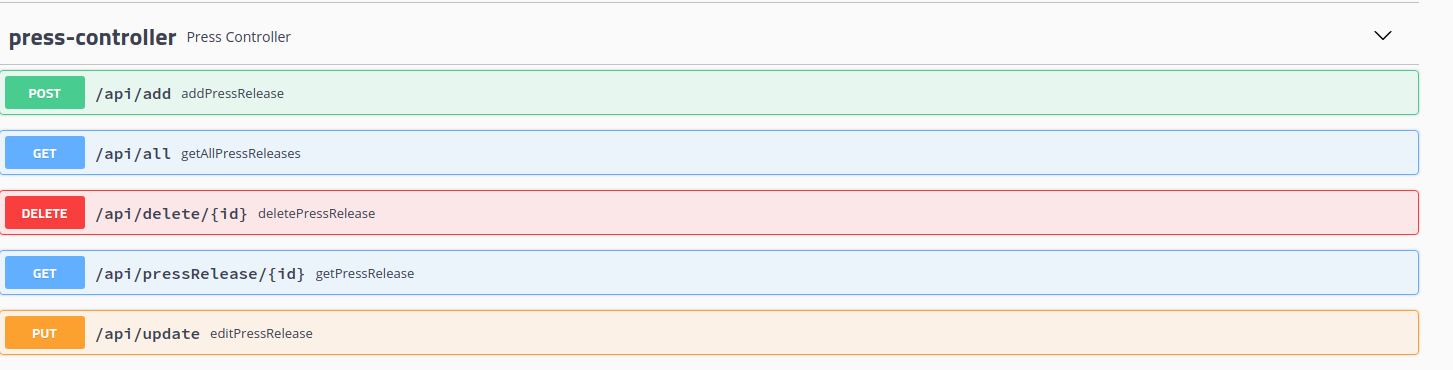 Here you can use the buttons POST, GET, PUT and DELETE in order to create, read, update and delete press releases.
7. Once you have exercised for a while the API via the Swagger interface, you probably get tired after a few minutes. In order to perform some bulk operations, you may run the following command which will create press releases. This will create some activity on the REST API allowing its instrumentation layer to generate metrics.
xxxxxxxxxx
$ mvn test
-------------------------------------------------------
[INFO] T E S T S
[INFO] Results:
[INFO] Tests run: 5, Failures: 0, Errors: 0, Skipped: 0
[INFO] ------------------------------------------------------------------------
[INFO] BUILD SUCCESS
[INFO] ------------------------------------------------------------------------
[INFO] Total time: 8.741 s [INFO] Finished at: 2020-03-03T15:27:38+01:00
8. Now everything is in place to start your monitoring session. First you might want to exercise cAdvisor. Go to http://<ip-address>:8080 and you'll see something like the following:
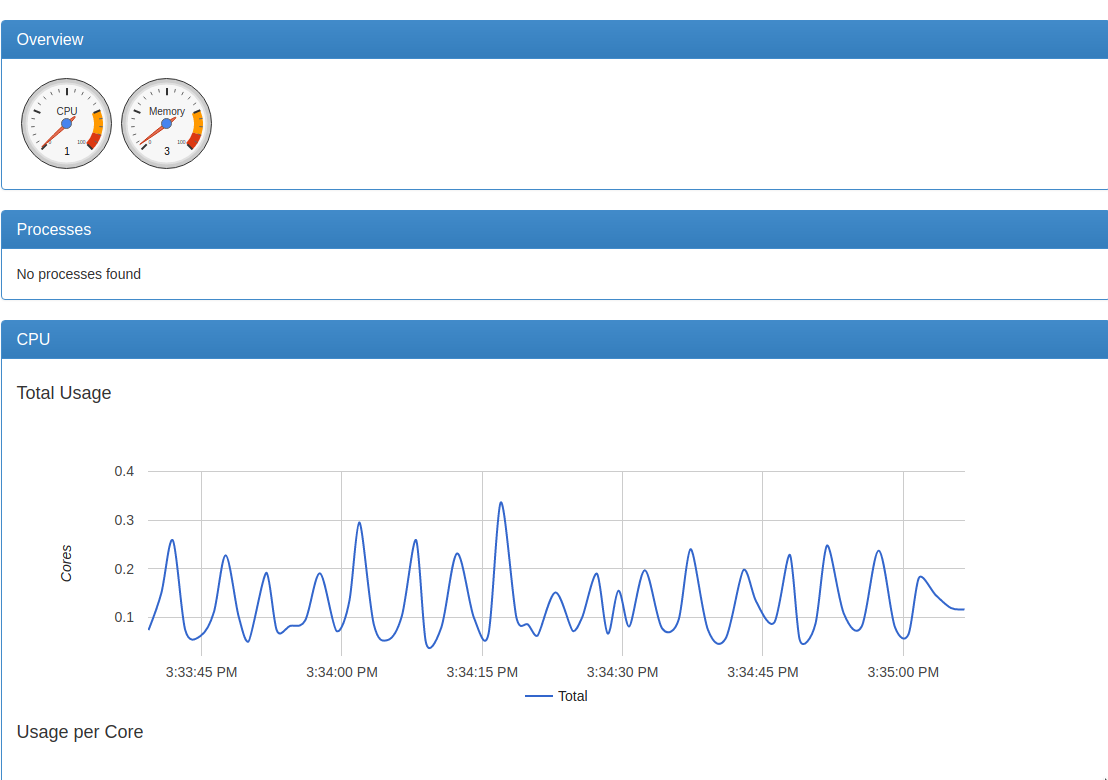
Spend some time navigating among all the proposed options.
9. In order to see the collected metrics, you may go to the Prometheus console at http://<ip-address>:9090/targets and the following screen will be presented to you:
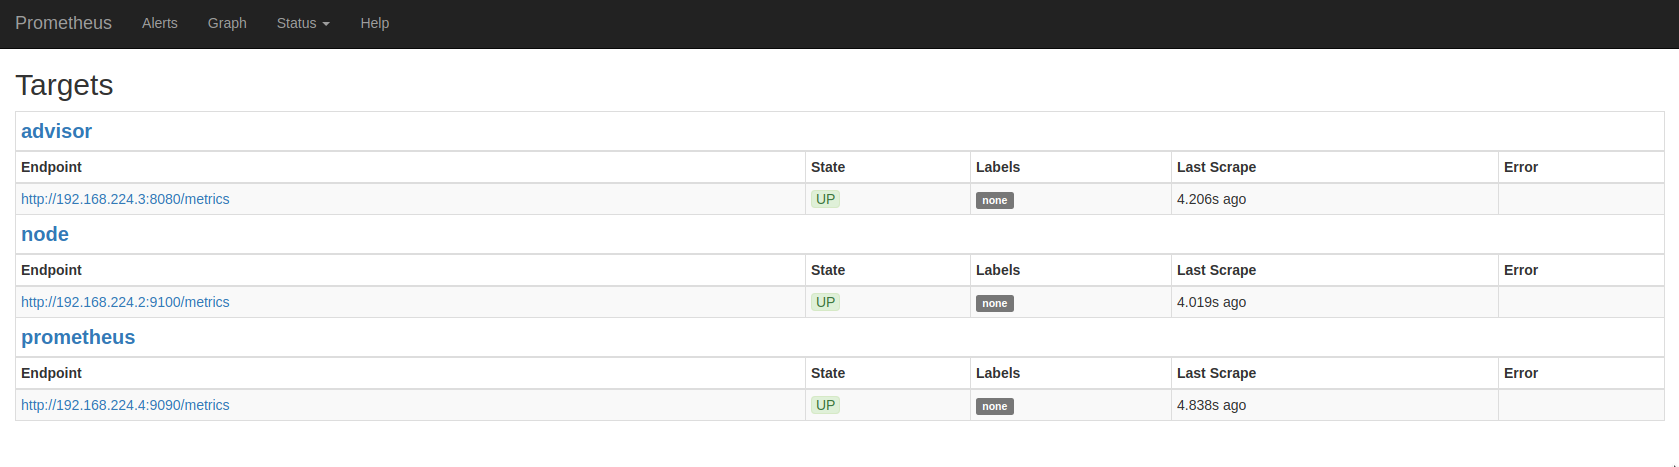 Here, clicking on the displayed links, you'll see the list of all the metrics proposed and available to us. Click on the Graph option in the menu bar and a new screen having a search area will be displayed. type metrics in this search bar and the full list of the metrics having a name starting with this word will be proposed. Select one of them, for example metrics_pressRelease_add_seconds_bucket and type return. A long list of values will be displayed in the Prometheus console and, if you click on the Graph tab you'll se the graphic representation of the time-series values of the selected metric.
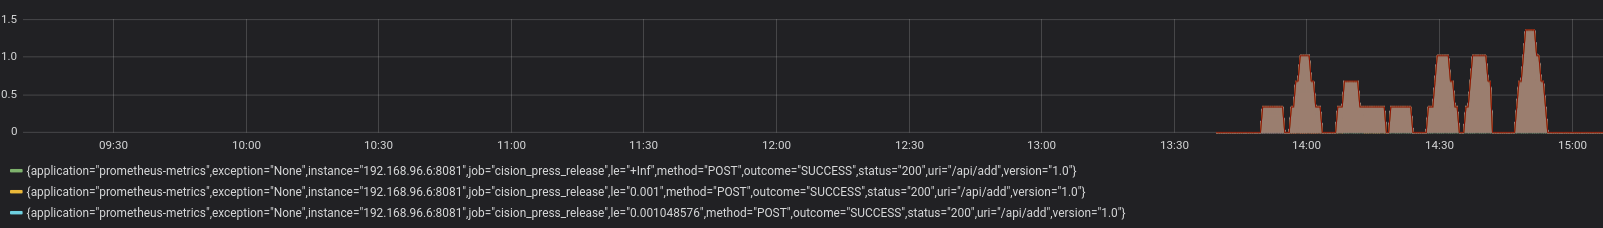
10. Now, having all these hundreds of metrics, the million dollars question is: "What do I do with them all ?". Well, here comes the fun part. Using Grafana you may build your own dashboards such that to highlight the metrics you're most interested in. Go to http://<ip-address>:3000 and you'll land on the Grafana home page. Here you need to login as admin/admin. Now, the first thing to do is to add Prometheus as data source. Please click the Grafana logo located in the top-left part of the screen, select Data Sources, and click the + Add data source button. We'll name it Prometheus and choose the same for the Type. Enter http://prometheus:9090 as the Url and click the Add button. That's it. From now on, we can visualize and query any metric stored in Prometheus. Let's create the first dashboard. Please click on the + sign in the leftmost pane and, in the unwinded drop-down select dashboard. The New Panel screen will be displayed. Here click on the button Add query and, in the New dashboard screen which is displayed, in the text field labeled metrics, type the following:
rate(metrics_pressRelease_add_seconds_bucket{job="press_release"}[5m])
After a few seconds, if you click on the Visualization button in the left-most pane, you'll see something like this:
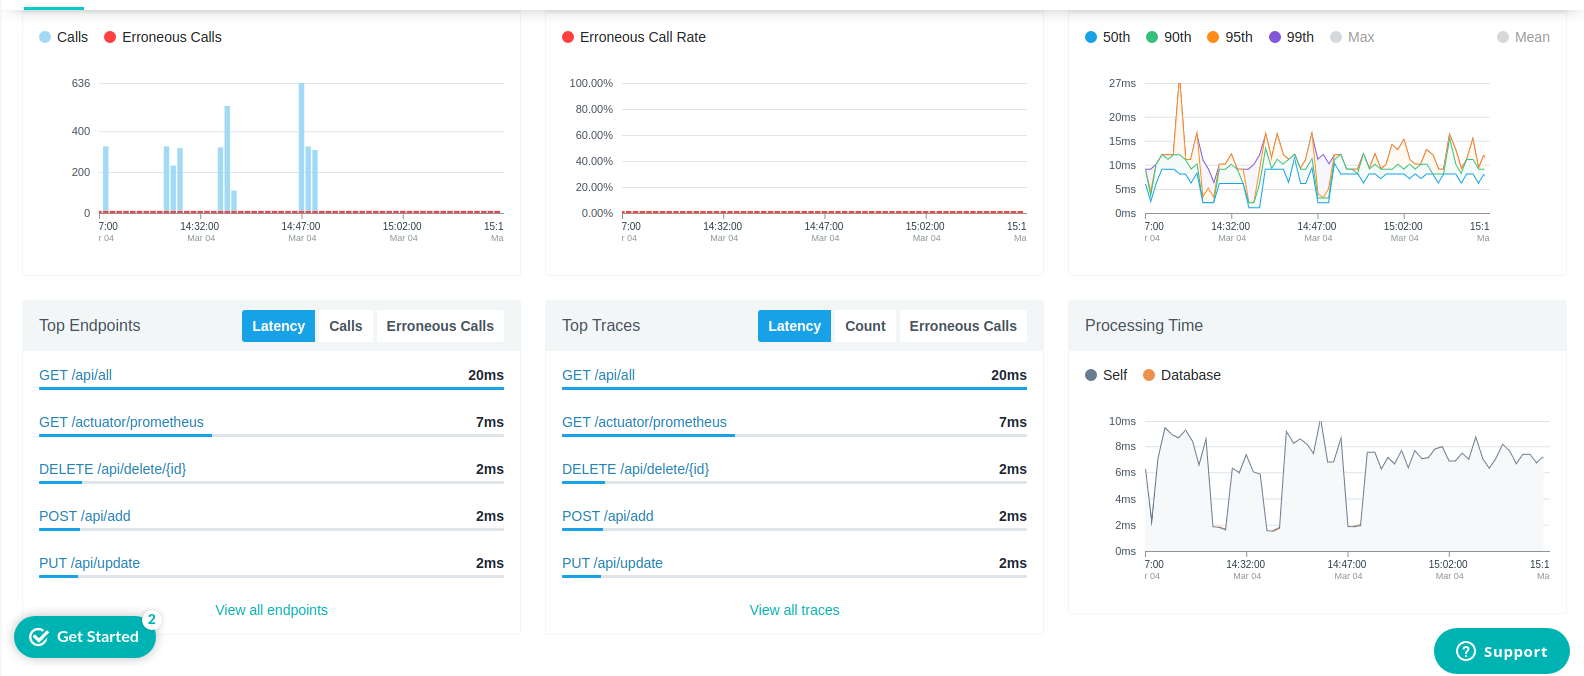
11. Now it's time to go to Instana. For the purposes of this project I've used their free trial at http://instana.com. You need to create an account and, once logged-in, you should be able to see your services running. Selecting the press_release service and clicking on the Dashboard button, you should be presented with a screen like this:
Show Me the Code
The code is a very classical one and it doesn't require much explanations, at least not from the point of view of a Spring Boot application, which is not in our scope here. The only thing which requires some explanations is the use of Micrometer library with Spring Boot. This library aims at instrumentalizing Spring Boot code such that to define and track metrics. The first thing to do is to configure Micrometer
xxxxxxxxxx
public class ScrapperConfig
{
public MeterRegistryCustomizer meterRegistryCustomizer(MeterRegistry meterRegistry)
{
return meterRegistry1 -> meterRegistry.config()
.commonTags("application", "prometheus-metrics");
}
}
Here the MeterRegistry class is used in order to register a customized set of metrics identified by tags application and prometheus-metrics. Everything else happens in the controller's code, for example the GET /api/all endpoint, that we just tested previously in Swagger, looks like:
xxxxxxxxxx
("/all")
(value = "metrics.pressRelease.getAll", histogram = true, percentiles = {0.95, 0.99}, extraTags = {"version", "1.0"})
public Collection<PressRelease> getAllPressReleases()
{
Timer timer = Metrics.globalRegistry.getRegistries().iterator()
.next().find("metrics.pressRelease.getAll")
.tags("application", "prometheus-metrics", "version", "1.0").timer();
if (timer != null)
log.debug("### getAllPressrelease {}, {}", timer.count());
return pressReleaseService.getPressReleases();
}
The only metrics specific thing here is the @Timed annotation which defines an application metric named metrics.pressRelease.getAll, of type histogram, having a precision of a percentile. All these notions are explained in details in the Micrometer documentation (https://micrometer.io/docs/). The mentioned metric is purely fictitious and only serves for demo purposes. Here it will increment each time a client will call the associated API. The code also shows, only for convenience purposes, how the defined metric might be further queried, using the find() method.
Conclusions
We managed to demonstrate how to:
- instrumentalize Spring Boot services on the behalf of the Micrometer library such that to generate customized metrics
- collect these customized metrics, together with standard Prometheus and cAdvisor metrics in a time-series database 3. represent all these metrics in different ways, using Prometheus graphs, cAdvisor GUI or Grafana dashboards
- track and monitor our Spring Boot microservices with Instana
Enjoy!
This is an entry for DZone's First Annual Computer Science Fair.
Opinions expressed by DZone contributors are their own.
Comments