How I Cut Kubernetes Debugging Time by 80% With One Bash Script
Built a bash script that analyzes Kubernetes clusters in 60 seconds, generating HTML/JSON/Markdown reports. Saved 70 minutes daily across 8 clusters.
Join the DZone community and get the full member experience.
Join For FreeHere's the truth about Kubernetes troubleshooting: 80% of your time goes into finding WHAT broke and WHERE it broke. Only 20% goes into actually fixing it. For months, I lived this reality, managing eight Kubernetes clusters. Every issue followed the same pattern: 30 minutes of kubectl detective work, five minutes to fix the actual problem. I was spending hours hunting for needles in haystacks. Then one weekend, I flipped that ratio.
Every Monday at 8 AM, our team's Teams chat explodes. "Hey, the dashboard is down." "Perf team can't access their pods." "Build agents crashed overnight."
Here's how I built a tool to cut through the chaos in under 60 seconds.
My Reality
Our team manages 8 Kubernetes clusters (AKS) - 4 in production and 4 in non-production (dev, e2e, perf, prodfix). When something breaks, our DevOps team gets pinged first.
The Problem: Finding WHAT broke and WHERE it broke takes 80% of the time. Fixing it takes 20%.
The Solution: A bash script that generates a complete cluster health report in under a minute.
Note: For this article, I demonstrate with a local minikube cluster, but the tool works identically on production clusters of any size.
A Typical Monday Morning
7:55 AM. Coffee in hand. I open Teams.
47 unread messages.
"Hey, dashboard is not up on perf cluster"
"Build agent failed overnight - need this fixed ASAP"
"E2E environment - services not coming up after weekend shutdown"
"Scheduled job didn't run - team waiting for data"
Every. Single. Monday.
Why? Cost-saving measures. We shut down non-production clusters over the weekend. Monday morning, we bring them back up.
That's when the chaos starts.
The Real Problems I Face Daily
Problem 1: The Dashboard Mystery
The message: "Dashboard is not up on perf cluster. Team can't check pod health after testing."
My old process:
kubectl get namespaces | grep dashboard
kubectl get pods -A | grep dashboard
kubectl describe pod dashboard-xyz
kubectl get pdb -A | grep dashboard
kubectl get pods -n istio-system
15 minutes later: "It's the Pod Disruption Budget. Istio only has one replica running."
The team: "Can we just get the dashboard back up?"
Problem 2: The Build Agent Nightmare
The message: "Build agents crashed overnight. Batch job failed. Team doesn't have their data."
What actually happened:
- StatefulSet pod crashed during build
- Cached issue? PAT token expired? Out of resources?
- Need to check: Logs, events, node status, storage
My old process:
kubectl get statefulsets -A
kubectl get pods -n build-agents
kubectl describe pod agent-xyz
kubectl logs agent-xyz --previous
kubectl get nodes
kubectl get pvc -n build-agents
20 minutes later: Found it. Cached image issue + node was under memory pressure.
The team: Still waiting.
Problem 3: The Secret Token Surprise
The message: "Scheduled job failed. Data didn't transfer from blob storage. Team waiting for latest data."
The actual problem: Token expired. Job couldn't authenticate. The auto-deploy pipeline didn't get the latest data.
My old process:
kubectl get cronjobs -A
kubectl get jobs -A --sort-by=.status.startTime
kubectl describe job job-xyz
kubectl logs job-xyz-pod
Buried in logs: Authorization failed: Token expired
30 minutes later: Fixed the secret. Re-ran the job manually.
The team: Already missed their morning data window.
Problem 4: The PVC Mount Failure
The message: "Pod keeps restarting in production."
The actual problem: PVC mount failed. Secret expired. Pod in CrashLoopBackOff.
My old process:
kubectl get pods -n production
kubectl describe pod failing-pod
kubectl get pvc -n production
kubectl describe pvc pvc-xyz
kubectl get secrets -n production
10 minutes later: Secret expired 3 days ago. Nobody noticed until it tried to restart.
The Pattern I Noticed
Every morning, the same pattern:
- Someone reports a problem (Teams message)
- I start investigating (10-30 minutes of kubectl commands)
- I explain what I found (Copy-paste terminal output to Teams)
- I fix the issue (5 minutes)
- I update everyone (More copy-paste)
Total time: 30-45 minutes per issue.
The frustrating part? 80% of the time was spent finding the problem, not fixing it.
What I Actually Needed
Not another monitoring tool. We have Prometheus, Grafana, and Azure Monitor.
What I needed was a snapshot:
- What's healthy? (Green = good)
- What's unhealthy? (Red = look here)
- What's weird? (Yellow = investigate later)
- Where do I focus first? (Priority issues)
And I needed it fast. Under 1 minute.
Most importantly, I needed to share this with teams that don't speak kubectl.
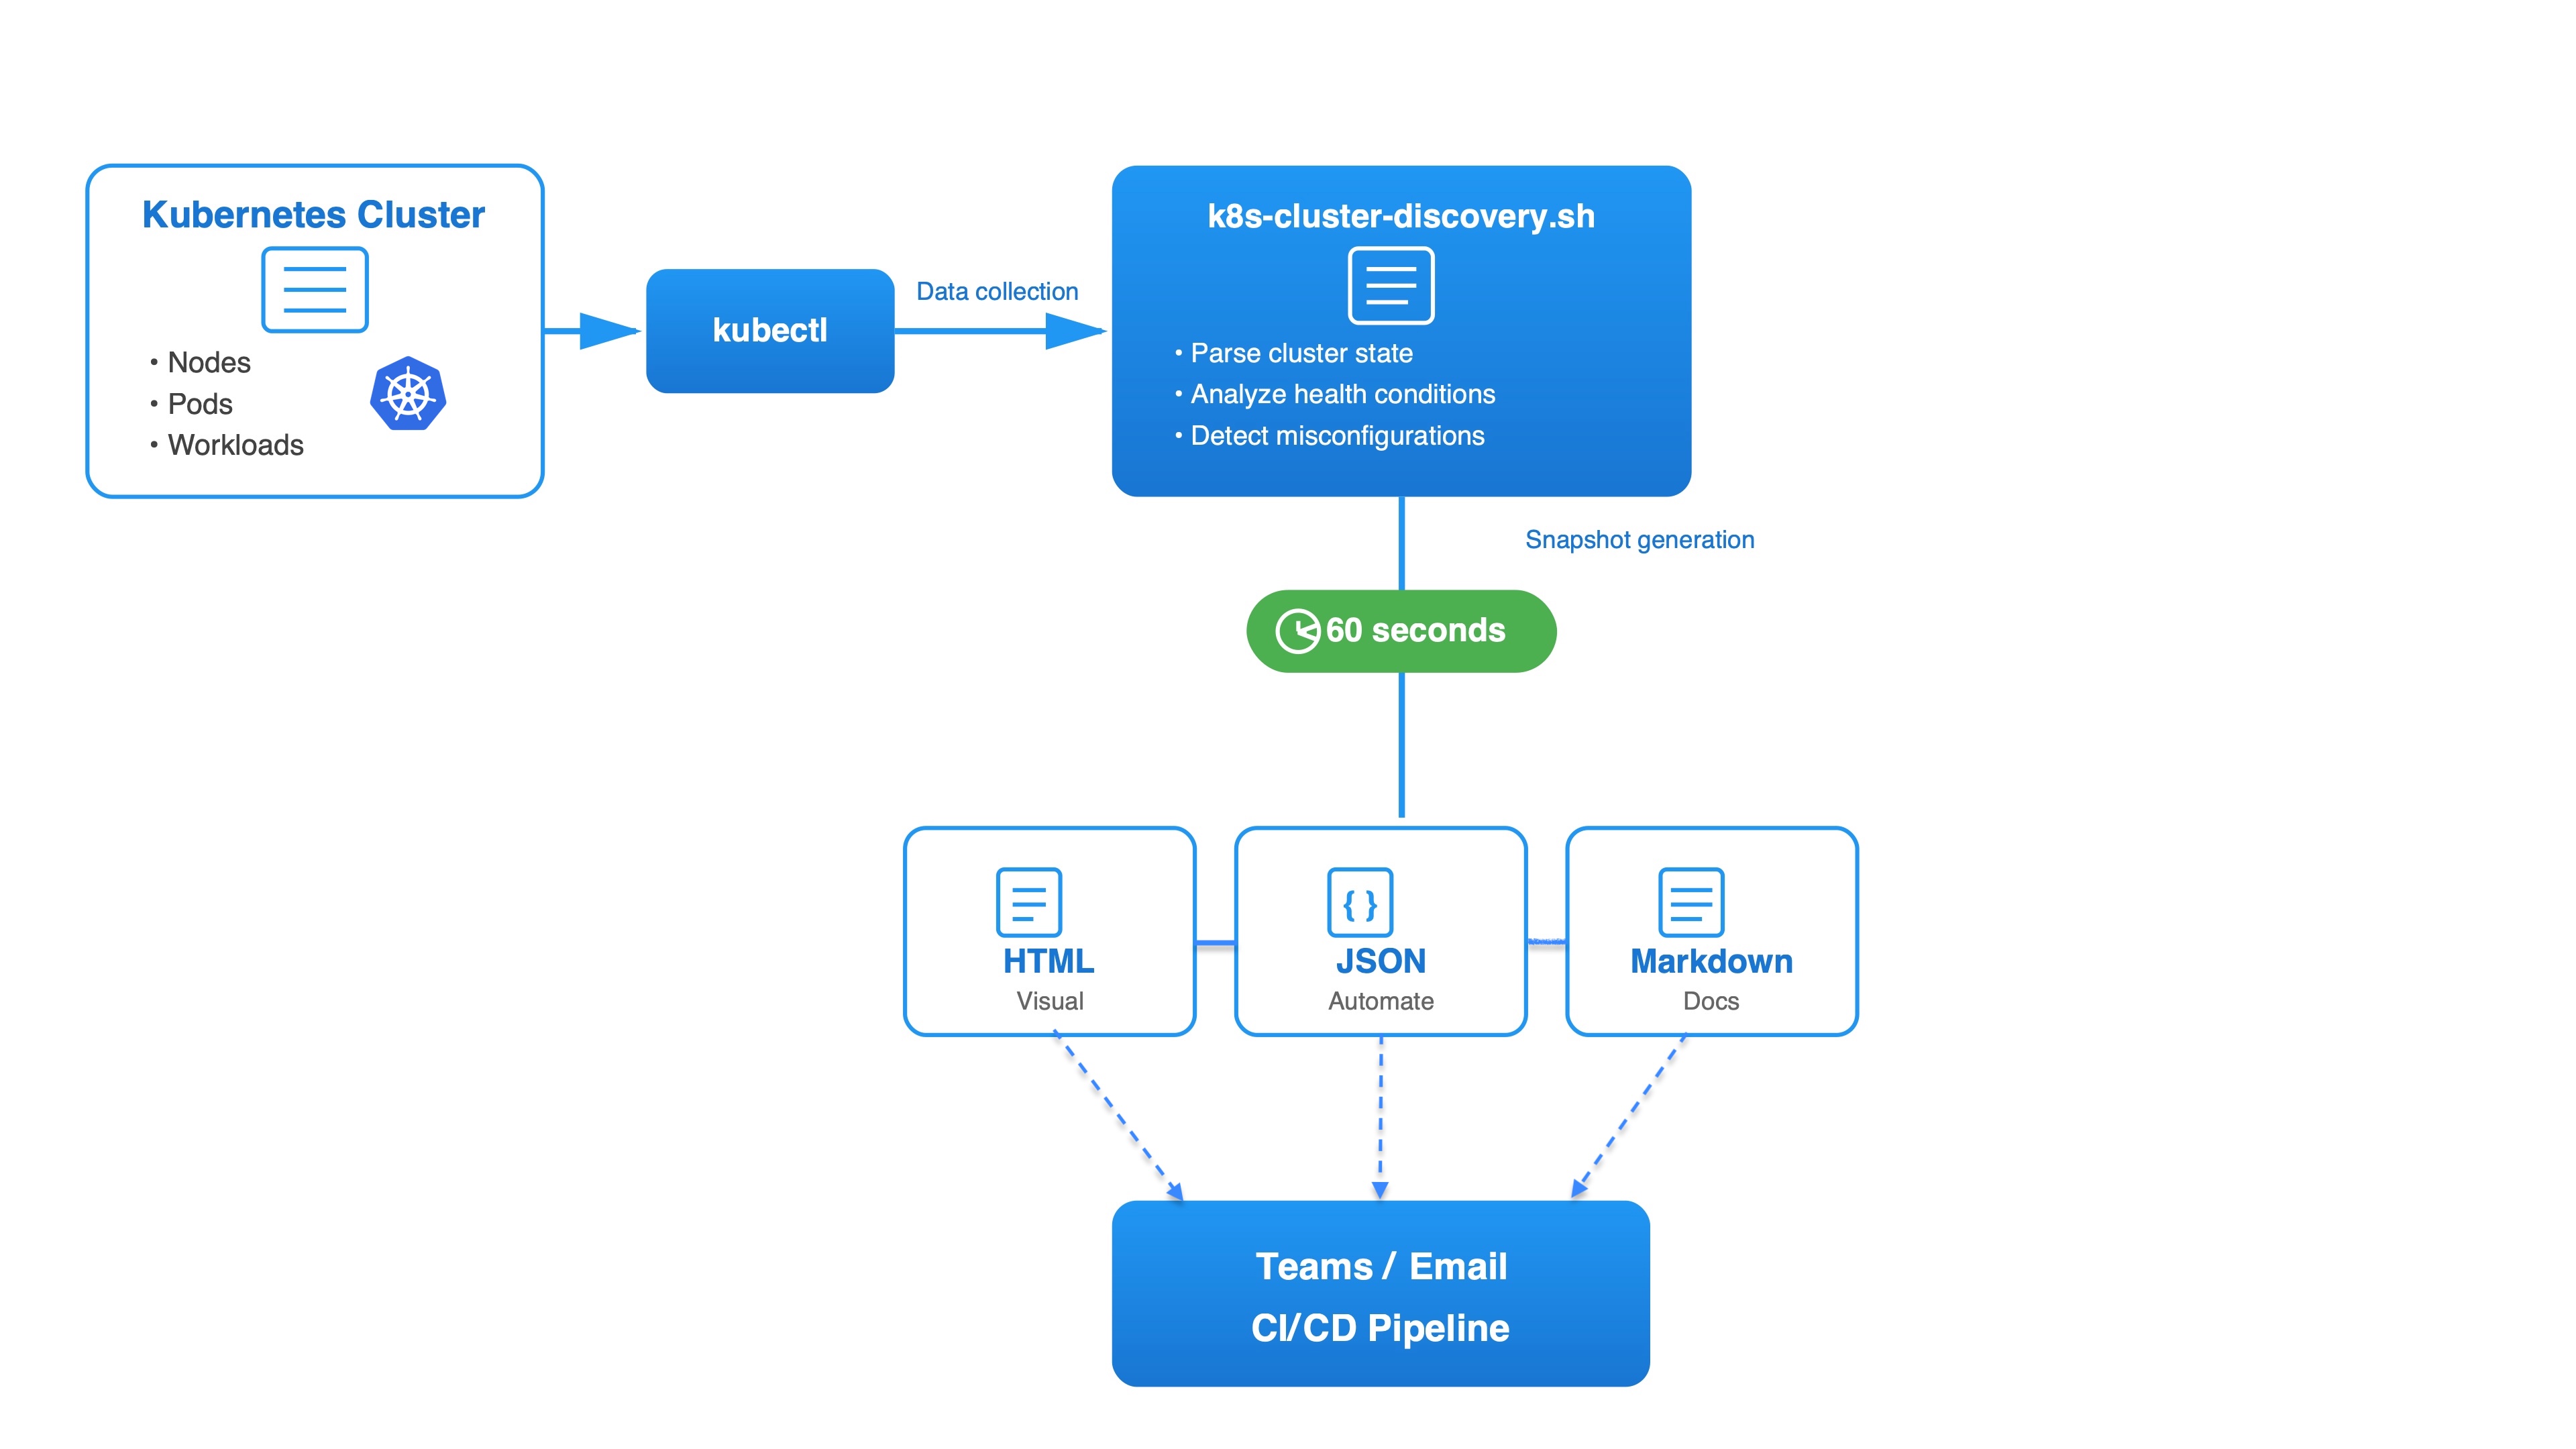
The Tool I Built
Over a weekend, I built k8s-cluster-discovery.sh.
What it does:
- Collects data from kubectl (nodes, pods, workloads, Istio, storage)
- Analyzes health status automatically
- Generates reports in three formats: HTML, JSON, or Markdown
- Takes less than 60 seconds
Works with ANY Kubernetes cluster:
- Azure Kubernetes Service (AKS)
- Amazon Elastic Kubernetes Service (EKS)
- Google Kubernetes Engine (GKE)
- Red Hat OpenShift
- Rancher
- Local clusters (minikube, kind, k3s)
- On-premises Kubernetes
Platform support:
- Linux (x86_64, ARM64)
- macOS (Intel and Apple Silicon M1/M2/M3)
- Windows (WSL2)
Usage:
# Quick health check - entire cluster
bash k8s-cluster-discovery.sh my-cluster html

# Focused investigation - specific namespace
bash k8s-cluster-discovery.sh my-cluster html production

# For automation - JSON output
bash k8s-cluster-discovery.sh my-cluster json

# For documentation - Markdown bash
k8s-cluster-discovery.sh my-cluster markdown
One Tool, Three Formats
Here's what makes this tool flexible: three output formats for different needs.
Format 1: HTML (For Humans)
bash k8s-cluster-discovery.sh my-cluster html
Who uses it: DevOps team, development teams, management, and new team members
Why: Color-coded health indicators, interactive, shareable (email, Teams), works on mobile
Use case: "What's the cluster status?" → Send HTML file
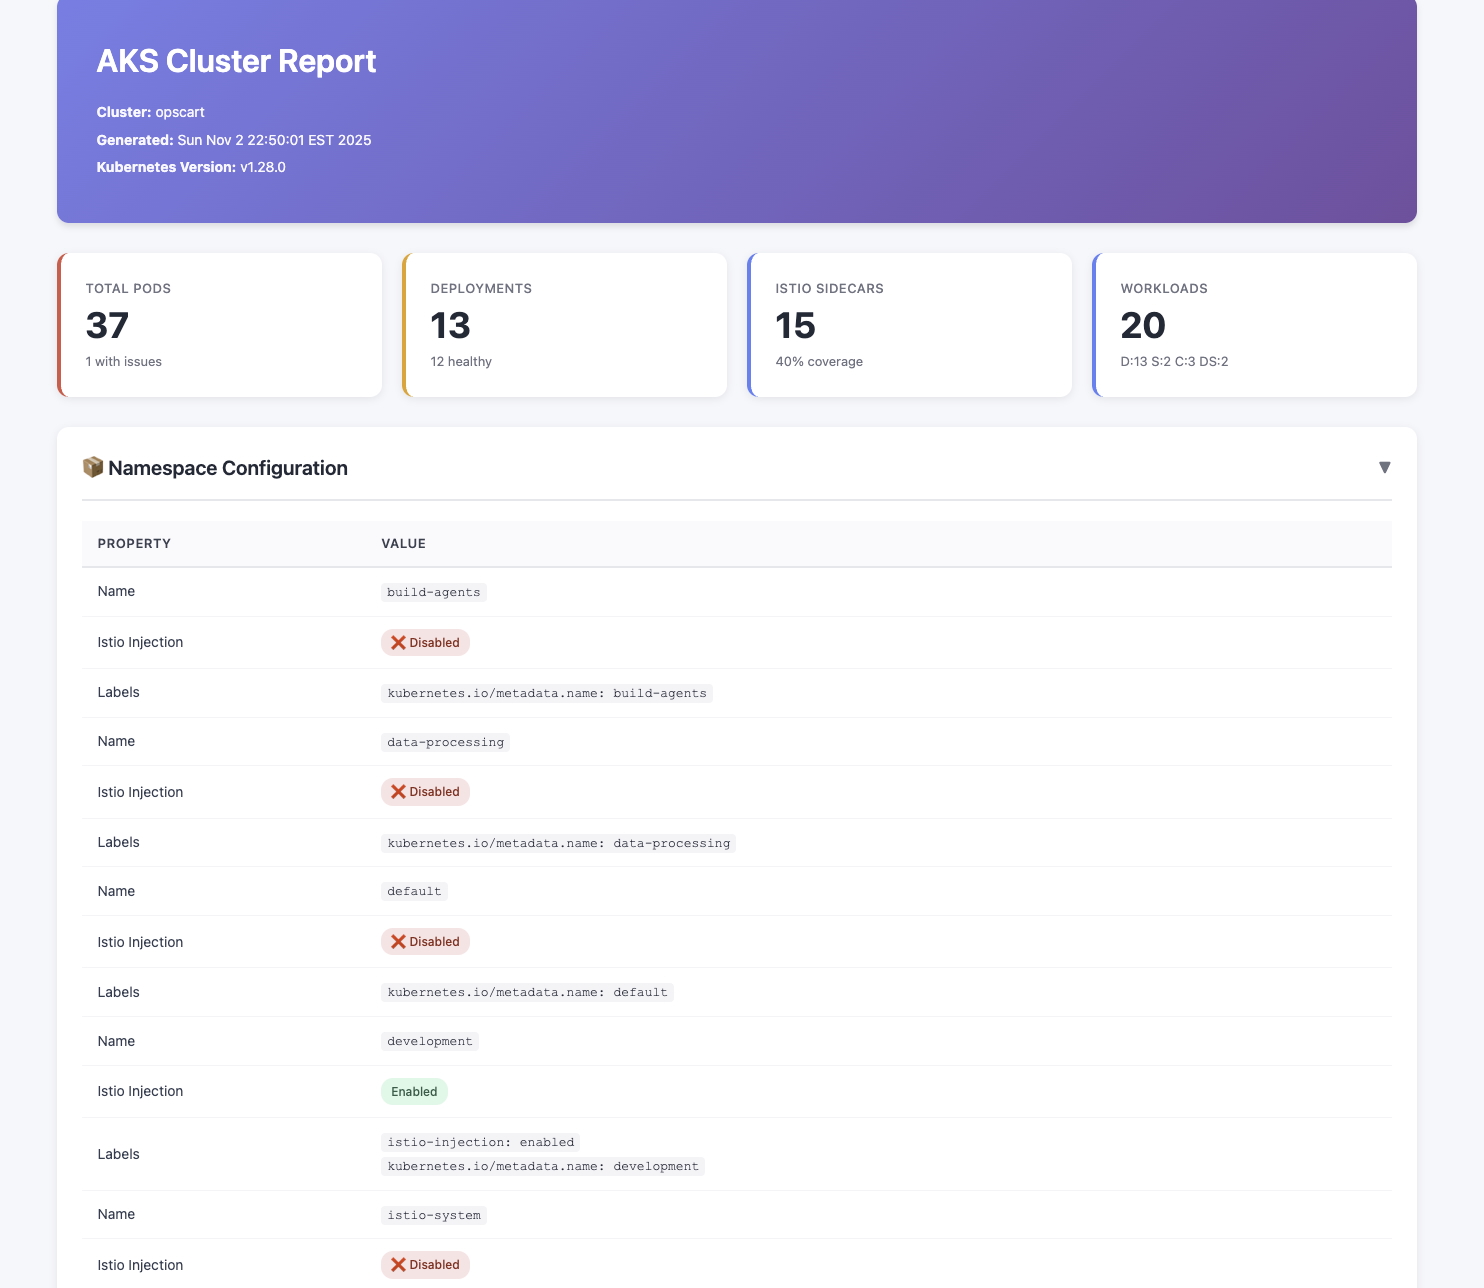
Screenshot showing: Color-coded summary cards (Total Pods, Deployments, Istio Sidecars, Workloads)
Format 2: JSON (For Automation)
bash k8s-cluster-discovery.sh my-cluster json
Who uses it: CI/CD pipelines, automation scripts, custom dashboards
Use case: Pre-deployment validation
bash k8s-cluster-discovery.sh prod-cluster json

PROBLEMS=$(jq '[.pod_health[].problems[]] | length' report.json)

if [ "$PROBLEMS" -gt 5 ]; then
  echo "Cluster unhealthy - deployment blocked"
  exit 1
fi

echo "Cluster healthy - proceeding with deployment"
Real example: Our pipeline caught 8 failing pods before we deployed to production last week.
Format 3: Markdown (For Documentation)
bash k8s-cluster-discovery.sh my-cluster markdownWho uses it: Platform team, architecture reviews, Git repositories
Use case: Weekly architecture reviews
bash k8s-cluster-discovery.sh prod-cluster markdown > docs/cluster-state-$(date +%Y-%m-%d).md
git add docs/
git commit -m "Weekly cluster snapshot"
git diff HEAD~1 docs/cluster-state-2025-10-31.md
Demo: My Local Cluster
For this article, I'm demonstrating with a local minikube cluster. My production environment runs larger clusters, but the tool works the same way regardless of cluster size.
Running on my demo cluster:
bash k8s-cluster-discovery.sh opscart htmlTime taken: ~30 seconds (smaller cluster = faster).
What I got:
- Complete health overview
- All pods with status indicators
- Workload analysis (Deployments, StatefulSets, CronJobs)
- Istio service mesh configuration
- Storage usage
All-in-one visual dashboard — whether you have 30 pods or 300 pods, the format is the same.
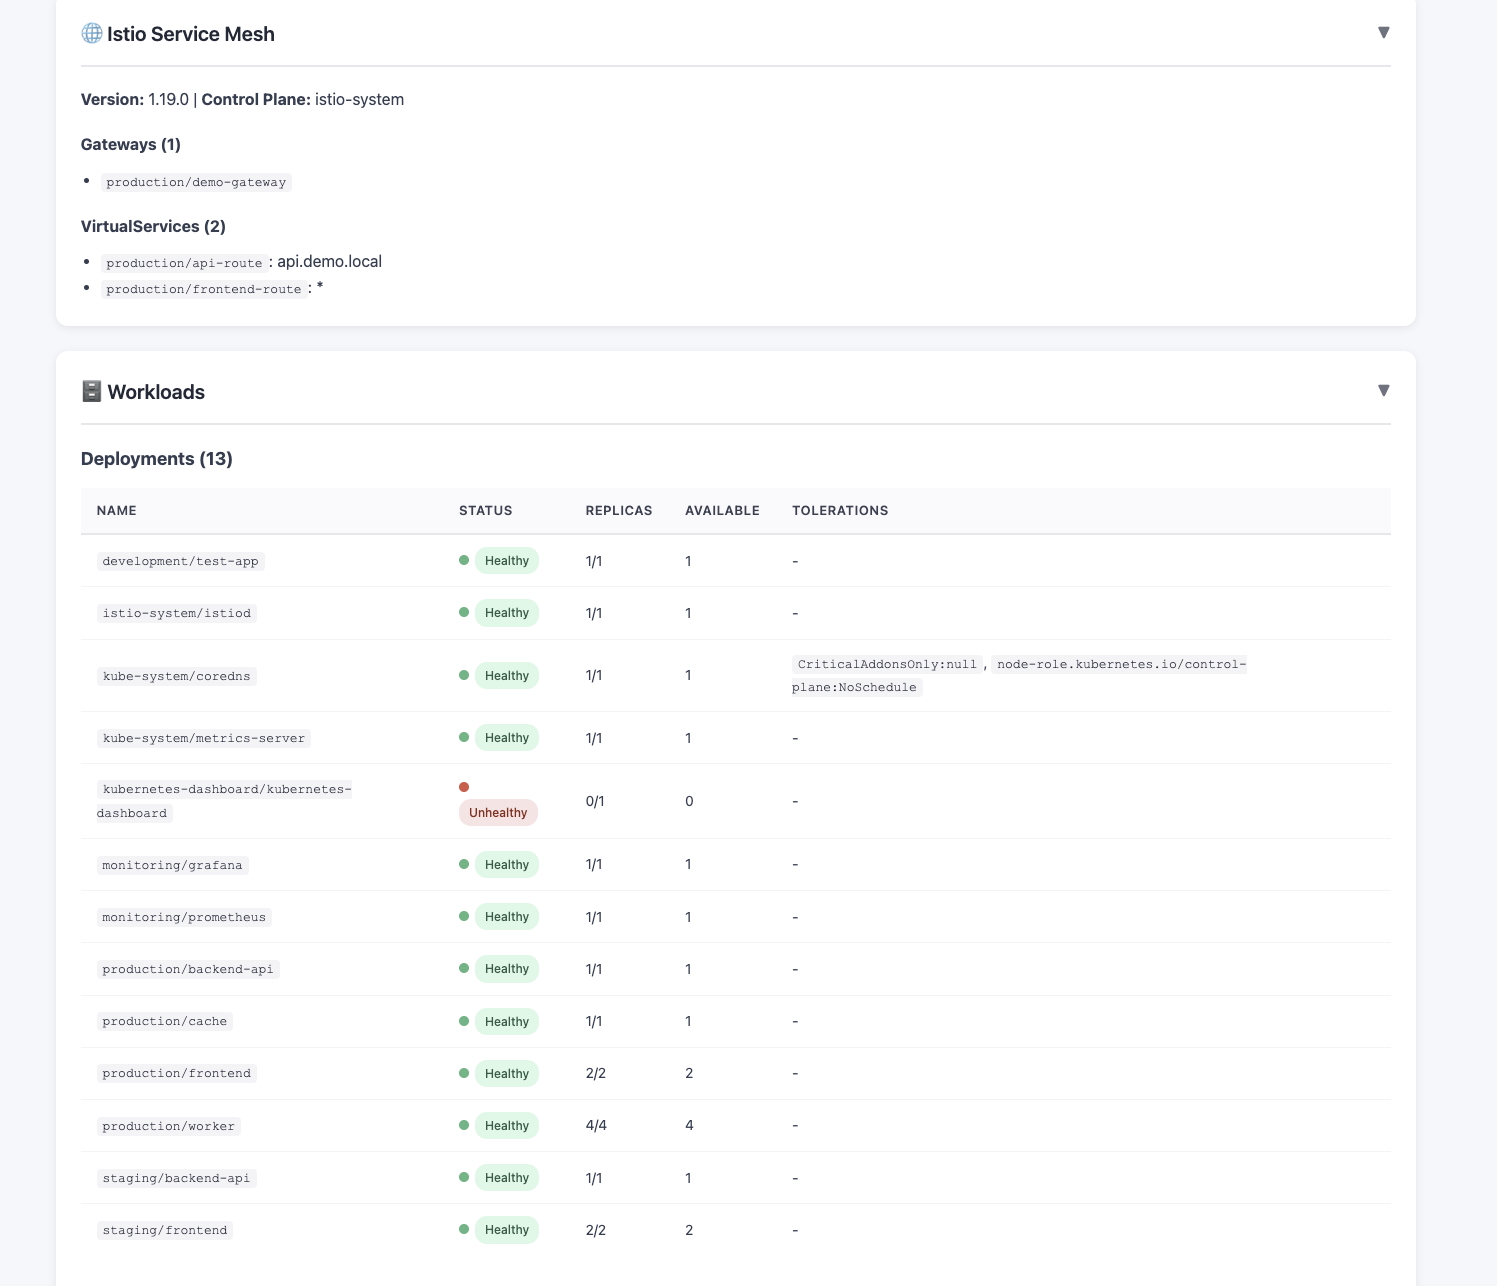
Screenshot showing: Full HTML report with multiple sections (Workloads, Deployments, Istio)
How This Changed My Mornings
Old Monday Morning (Before Tool)
8:00 AM: Teams messages start
8:05 AM: Start investigating perf cluster
8:15 AM: Copy kubectl output to Teams, explain what it means
8:20 AM: Fix dashboard issue
8:25 AM: New message - build agent problem
8:30 AM: Start investigating build agent
8:50 AM: Found the issue
9:00 AM: Standup meeting - still explaining cluster status
9:30 AM: Finally done with morning fires
Total: 90 minutes of firefighting
New Monday Morning (With Tool)
7:55 AM: Run health reports:
# Check production clusters
opscart@mac scripts % ./k8s-cluster-discovery.sh prod-1 html
╔════════════════════════════════════════════════════════════╗
║  Full Cluster Report
║  Cluster: prod-1
║  Output: html
╚════════════════════════════════════════════════════════════╝

Collecting cluster information...
  ✓ Version: v1.28.0
Collecting node information...
  ✓ Nodes: 1/1 ready
Collecting namespace information...
  ✓ Namespaces: 12 (3 with Istio injection)
  Checking Istio...
  ✓ Istio: 1.19.0 (Gateways: 1, VS: 2)
Collecting workloads...
  ✓ Deployments: 13 | StatefulSets: 2 | CronJobs: 3 | DaemonSets: 2
Analyzing ALL pods...
  ✓ Pods: 37 total (15 with sidecars, 1 with issues)
Collecting HPAs & PDBs...
  ✓ HPAs: 4 | PDBs: 5
Collecting storage...
  ✓ PVCs: 2

Generating report...

HTML report: ./cluster-reports/prod-01_20251103_142955.html
# Check non-production clusters where issues are reported
bash k8s-cluster-discovery.sh perf html
bash k8s-cluster-discovery.sh e2e html
bash k8s-cluster-discovery.sh dev html
8:00 AM: Open Teams
8:01 AM: Upload HTML reports to relevant threads
8:02 AM: Dashboard issue: PDB blocking scale-down. Istio at 1 replica. Fixing now.
8:05 AM: Dashboard back up
8:06 AM: Build agent: Node memory pressure + cached image issue. Clearing cache.
8:10 AM: Build agent healthy
8:15 AM: All morning issues resolved
9:00 AM: Standup - All clusters healthy. Reports in Teams if you want details.
Total: 20 minutes of firefighting
Time saved: 70 minutes. Every single day.
The Features That Actually Matter
Note: The screenshots below are from a demo cluster running on minikube. My production clusters have higher pod counts, but the interface and functionality are identical regardless of scale.
1. Visual Health Dashboard
Open the HTML report. First thing you see:
┌──────────────┐  ┌──────────────┐  ┌──────────────┐
│ Total Pods   │  │ Deployments  │  │ Istio        │
│      35      │  │      13      │  │ Sidecars     │
│ 1 with issues│  │  12 healthy  │  │  20 (57%)    │
└──────────────┘  └──────────────┘  └──────────────┘
    Red              Yellow            Yellow
Instant visibility: Red = problems. Yellow = warnings. Green = all good.
2. Smart Warnings
The script doesn't just collect data. It analyzes it.
Example warning:
Configuration Warning:

Namespace 'kubernetes-dashboard' has node selector set to
'kubernetes.azure.com/mode=system'. This schedules pods on
system node pools, which is unusual for user applications.
This caught misconfigurations in 3 namespaces we didn't know about.
3. Complete Pod Table
Every pod. Every namespace. With details:
| Pod Name | Status | Ready | Containers | Sidecar | Restarts |
|---|---|---|---|---|---|
| dashboard-abc | Running | ✓ | 2/2 | ✓ | 0 |
| agent-xyz | Failed | ✗ | 0/1 | ✗ | 47 |
| job-123 | Pending | ✗ | 0/1 | ✗ | 0 |
One glance shows exactly which pods need attention.
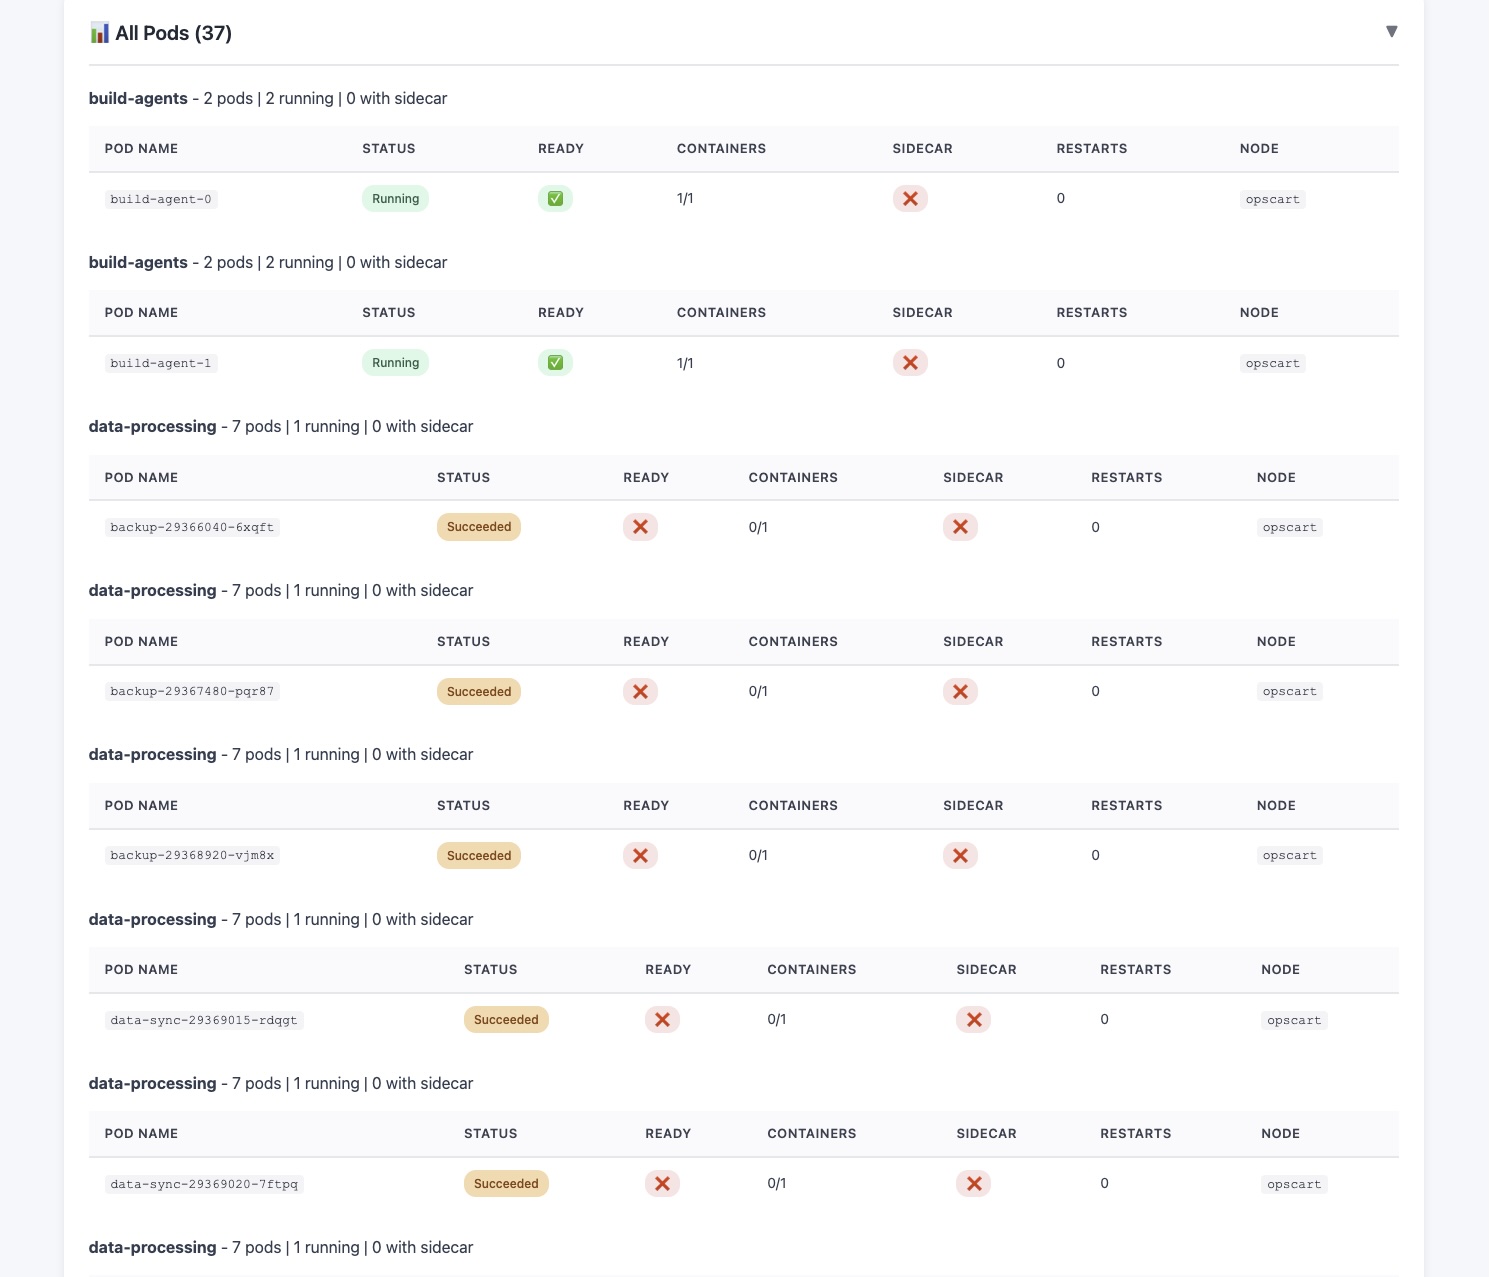
Screenshot showing: Pod table with status indicators and details
4. Istio Mesh Visibility
- Which pods have sidecars injected?
- Which pods are missing sidecars?
- Gateway configurations
- VirtualService status
5. Cluster Cleanup Insights
Bonus benefit: The report shows unused PVCs, jobs that haven't run in days, CronJobs with high failure rates, and deployments with zero replicas.
Perfect for monthly cleanup and cost optimization.
Real Impact on My Team
For Our DevOps Team
Before: "Let me check... give me 15 minutes..."
After: "See report. Dashboard issue = PDB. Fixing now."
Before: 2 hours/day on cluster health checks
After: 20 minutes/day
Team adoption: All team members now use the tool for their daily health checks.
For Development Teams
Before: "What's wrong with perf cluster?"
Me: [Sends kubectl output]
Them: "What does this mean?"
After: "What's wrong with perf cluster?"
Me: [Sends HTML report]
Them: "Oh, 3 red pods. Got it."
For Management
Before: "How are the clusters?"
Me: [Tries to explain pod states]
Them: [Confused faces]
After: "How are the clusters?"
Me: [Sends HTML report]
Them: "Mostly green. Looks good."
They actually understand cluster health now.
Why This Works for Multi-Cluster Management
Managing 8 clusters (4 production, 4 non-production) across our team means 8 different configurations to track.
New way:
# Production clusters
for cluster in prod-1 prod-2 prod-3 prod-4; do
  bash k8s-cluster-discovery.sh $cluster html
done

# Non-production clusters
for cluster in dev e2e perf prodfix; do
  bash k8s-cluster-discovery.sh $cluster html
done
5 minutes to understand the health of all 8 clusters.
Technical Details
Data Collection
Uses kubectl to collect:
- All nodes with status, taints, labels
- All namespaces with Istio injection status
- All workloads (Deployments, StatefulSets, CronJobs, DaemonSets)
- Every pod with container counts, restart counts, sidecar status
- Istio resources
- HPAs and PDBs
- PVCs
Health Analysis
Automatically detects:
- Failed or pending pods
- Pods with high restart counts
- Unusual configurations
- Unhealthy workloads
- Missing Istio sidecars
Report Generation
Generates a self-contained HTML file with:
- Embedded CSS (color-coded design)
- Minimal JavaScript (collapsible sections)
- No external dependencies
- Works offline
- Can be emailed or uploaded to SharePoint
File size: 150-500 KB depending on cluster size
Performance
Demo cluster (opscart - ~40 pods):
- Data collection: ~20 seconds
- Report generation: ~10 seconds
- Total: ~30 seconds
Production cluster (~250 pods):
- Data collection: ~45 seconds
- Report generation: ~12 seconds
- Total: ~60 seconds
The tool scales linearly with cluster size.
Real Use Cases Beyond Health Checks
1. Pre-Deployment Validation
bash k8s-cluster-discovery.sh prod-cluster json
PROBLEMS=$(jq '[.pod_health[].problems[]] | length' report.json)

if [ "$PROBLEMS" -gt 5 ]; then
  echo "Cluster unhealthy - deployment blocked"
  exit 1
fii
Saved us from deploying to an unhealthy cluster twice last month.
2. Cost Optimization
Run monthly reports. Look for:
- Unused PVCs
- Deployments with 0 replicas
- CronJobs that haven't succeeded in 30+ days
Last month: Found 15 unused PVCs. Deleted them. Saved $200/month.
3. Onboarding New Engineers
Before: "Here's kubectl... these 20 commands..."
After: "Here's this morning's report. Green = healthy, red = issues."
New engineers understand cluster health in 5 minutes instead of 5 days.
4. Incident Documentation
During incidents, generate report:
bash k8s-cluster-discovery.sh prod-cluster html
Save the HTML file. Archive it.
Post-mortem meetings: "Here's the cluster state at the time of incident."
What I Learned
1. Simple Tools Win
I could have built a React dashboard with a back-end API.
I didn't need to.
A bash script and three output formats solved the problem perfectly.
2. Share Everything
The game-changer wasn't collecting the data.
It was making it shareable.
HTML files can be:
- Opened by anyone
- Shared in Teams
- Emailed to management
- Archived for compliance
- Viewed on mobile
3. Visibility Reduces Chaos
Before: Everyone asks me for status
After: Everyone looks at reports
Fewer interruptions = more time to fix actual problems.
Why Not Use Other Tools?
kubectl
Good for: Powerful, flexible command-line tool for Kubernetes management
Not good for: Terminal output isn't shareable with non-DevOps teams, requires deep Kubernetes knowledge
Bottom line: Great for operations, but you can't send kubectl output to your manager or development team.
k9s
Good for: Interactive, real-time cluster monitoring with fast keyboard navigation
Not good for: No way to generate shareable reports or export snapshots for later review
Bottom line: Excellent for live debugging, but useless when you need to share cluster status with others.
Lens
Good for: Full-featured Kubernetes IDE with GUI, multi-cluster support, and built-in tools
Not good for: Requires installation, heavy on resources, not designed for quick health snapshots
Bottom line: Perfect as your daily K8s environment, but overkill when you just need a fast cluster overview.
Prometheus + Grafana
Good for: Real-time metrics, historical data, powerful alerting, and custom dashboards
Not good for: Complex setup, requires dedicated infrastructure, not built for quick one-time snapshots
Bottom line: Essential for production monitoring, but too heavy when you just want to answer "Is the cluster healthy right now?"
Kubevious
Good for: Visual cluster topology, rule-based validation, and change tracking
Not good for: Requires installation and setup, web UI only, heavier footprint than a simple script
Bottom line: Great for deep analysis and governance, but too much when you need a quick morning health check.
KubeEye
Good for: Security scanning, best practice checks, and compliance validation
Not good for: Command-line only, focused on finding problems rather than overall health overview
Bottom line: Excellent for audits, but doesn't give you the big picture of cluster health at a glance.
What I needed: Simple health snapshots + shareability + automation.
This tool fills the gap between "quick kubectl commands" and "full monitoring infrastructure."
Open Source and Available Now
The tool is open source on GitHub.
Quick Start
git clone https://github.com/opscart/kubectl-health-snapshot.git
cd kubectl-health-snapshot/scripts
chmod +x k8s-cluster-discovery.sh
Requirements
- kubectl configured for your cluster (any Kubernetes distribution)
- jq JSON processor
- Bash 4.0+
Works On
- Linux (Ubuntu, RHEL, Debian, etc.)
- macOS (Intel and Apple Silicon M1/M2/M3)
- Windows (via WSL2)
Tested With
- Azure AKS, Amazon EKS, Google GKE
- Minikube, Kind, K3s, Docker Desktop
No complex installation. No servers. No configuration.
What's Next
Near term:
- Multi-cluster comparison view
- Scheduled pipeline integration
- Cost analysis per namespace
Community requests:
- YAML output for GitOps
- Historical trending
- Teams webhook notifications
Want to contribute? Issues and PRs welcome on GitHub.
The Bottom Line
Every morning used to start with chaos:
- Teams messages
- kubectl detective work
- Copy-paste output
- Repeat for 8 clusters
Now:
bash k8s-cluster-discovery.sh my-cluster html
60 seconds later: Complete health report. Visual. Shareable. Actionable.
Key Takeaways
- 80% of Kubernetes debugging is detection, not fixing. Most of the time is wasted finding problems, not solving them.
- A simple bash script beats complex tools. kubectl + jq + 60 seconds replaces hours of commands and multiple monitoring tools.
- Share-ability bridges the DevOps gap. HTML reports let non-technical teams understand cluster health without kubectl expertise.
- Zero setup, maximum impact. No installation, no infrastructure, no configuration — just run it.
- Open source and ready to use. Try it in 5 minutes: .
Try It Yourself
GitHub: github.com/opscart/kubectl-health-snapshot
Author: opscart - DevOps Tools & Automation
License: MIT
If you manage Kubernetes clusters, what does your Monday morning look like? How do you handle the firefighting? Share your thoughts in the comments.
Try the tool today: https://github.com/opscart/kubectl-health-snapshot. Star the repo if it saves you time!
Opinions expressed by DZone contributors are their own.
Comments