D3-Force Directed Graph Layout Optimization in Nebula Graph Studio
See how to build a simple D3-force directed graph to illustrate how D3.js displays data connections and share some layout optimization ideas based on this example.
Join the DZone community and get the full member experience.
Join For FreeWhat Is D3.js
D3.js is an open-source JavaScript library for producing dynamic, interactive data visualizations in web browsers using SVG, HTML and CSS.
In addition to D3, there are other popular and powerful libraries such as ECharts and Chart.js. However, they are highly encapsulated, leaving too little room for customization.
In the contrary, D3 is highly customizable thanks to its support for event handling for SVG elements. It can bind arbitrary data to the document object model (DOM) or directly operate W3C DOM API on the DOM.
For those who want full control of their graph layout, D3 is definitely a go-to choice.
D3-Force Directed Graph
For social networks analysis, D3-force directed graph is the best choice. It is a module realized in D3 by simulating the velocity Verlet numerical integrator for physical forces on particles. Each node in D3-force can be regarded as a discharge particle, and there is repulsion (Coulomb repulsion) among the particles. At the same time, these particles are connected by the edges among them, thus generating traction.
Because of the repulsion and traction, particles in D3-force continuously shift from the initial state of random disorder to a balanced and ordered layout. The velocity Verlet numerical integrator controls the order of particles and edges. The graph generated with d3-force contains only nodes and edges and there is only a small collection of graph samples for reference because most graphs are customized.
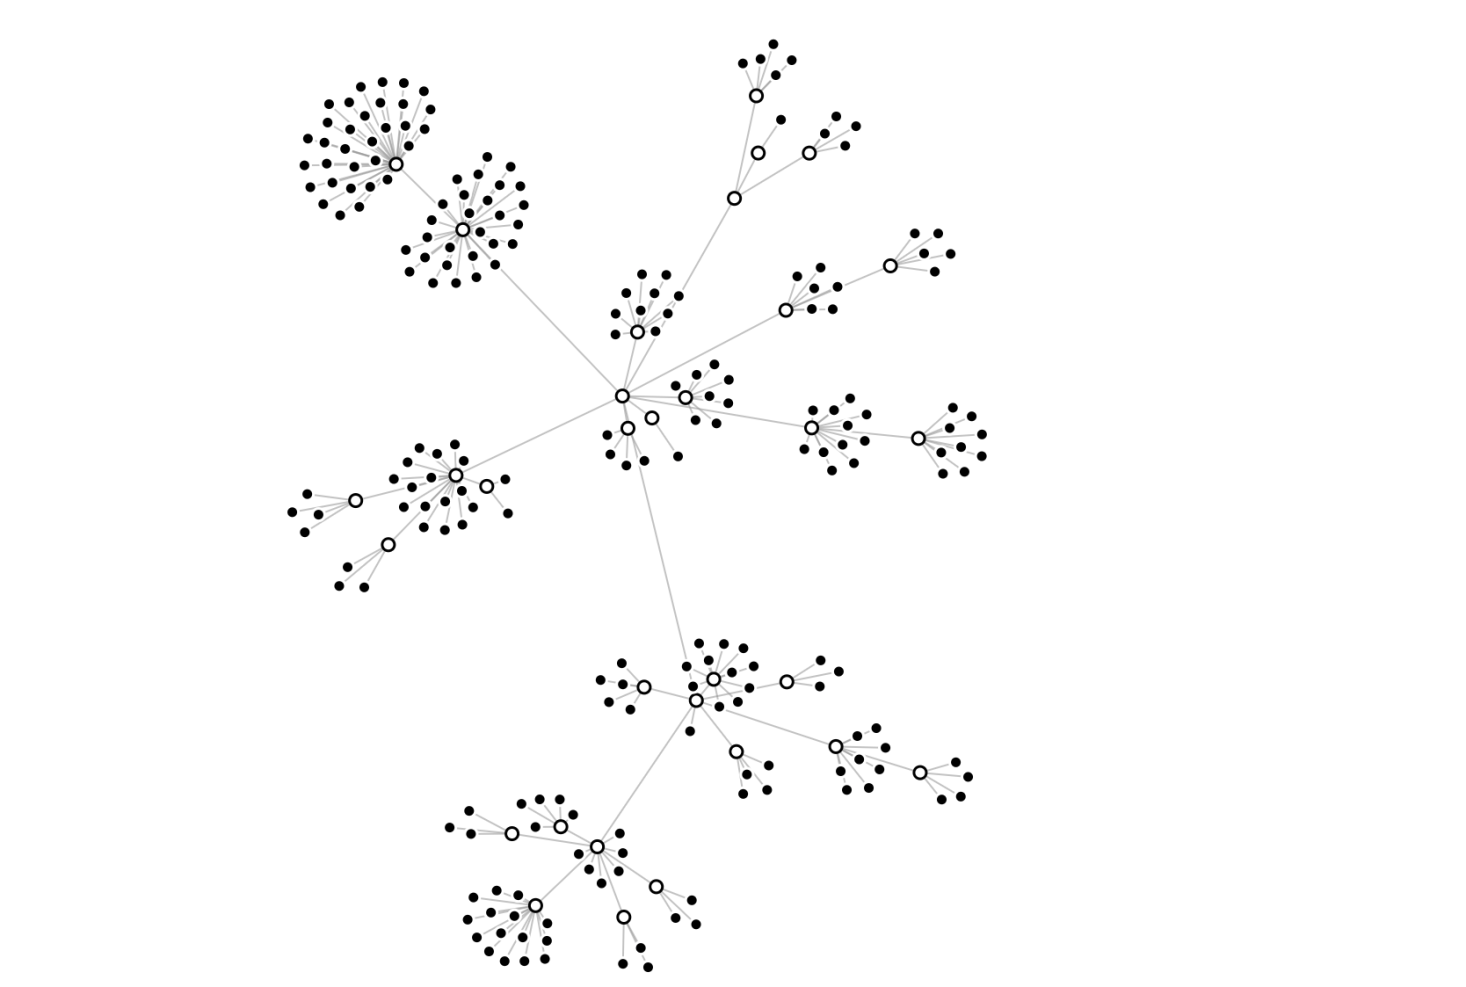
The following is a popular network diagram I found that is realized with D3-force. Apparently it is too simple for some use cases. So if yours is more complex than that, then you have to create your own graph.
Building D3-Force Directed Graph
In Nebula Graph Studio, we use the D3-force directed graph to analyze data relationships because the nodes and edges show the data connections intuitively and it allows graph exploration via graph query language. Moreover, the graph data can be updated by synchronizing the operations on the DOM to the database, which deserves another article to cover.
Let’s build a simple D3-force directed graph to illustrate how D3.js displays data connections and share some layout optimization ideas based on this example.
this.force = d3
.forceSimulation()
// Assign coordinates to nodes
.nodes(data.vertexes)
// Connect edges
.force('link', linkForce)
// The instance center
.force('center', d3.forceCenter(width / 2, height / 2))
// Gravitation
.force('charge', d3.forceManyBody().strength(-20))
// Collide force to prevent nodes overlap
.force('collide',d3.forceCollide().radius(60).iterations(2));
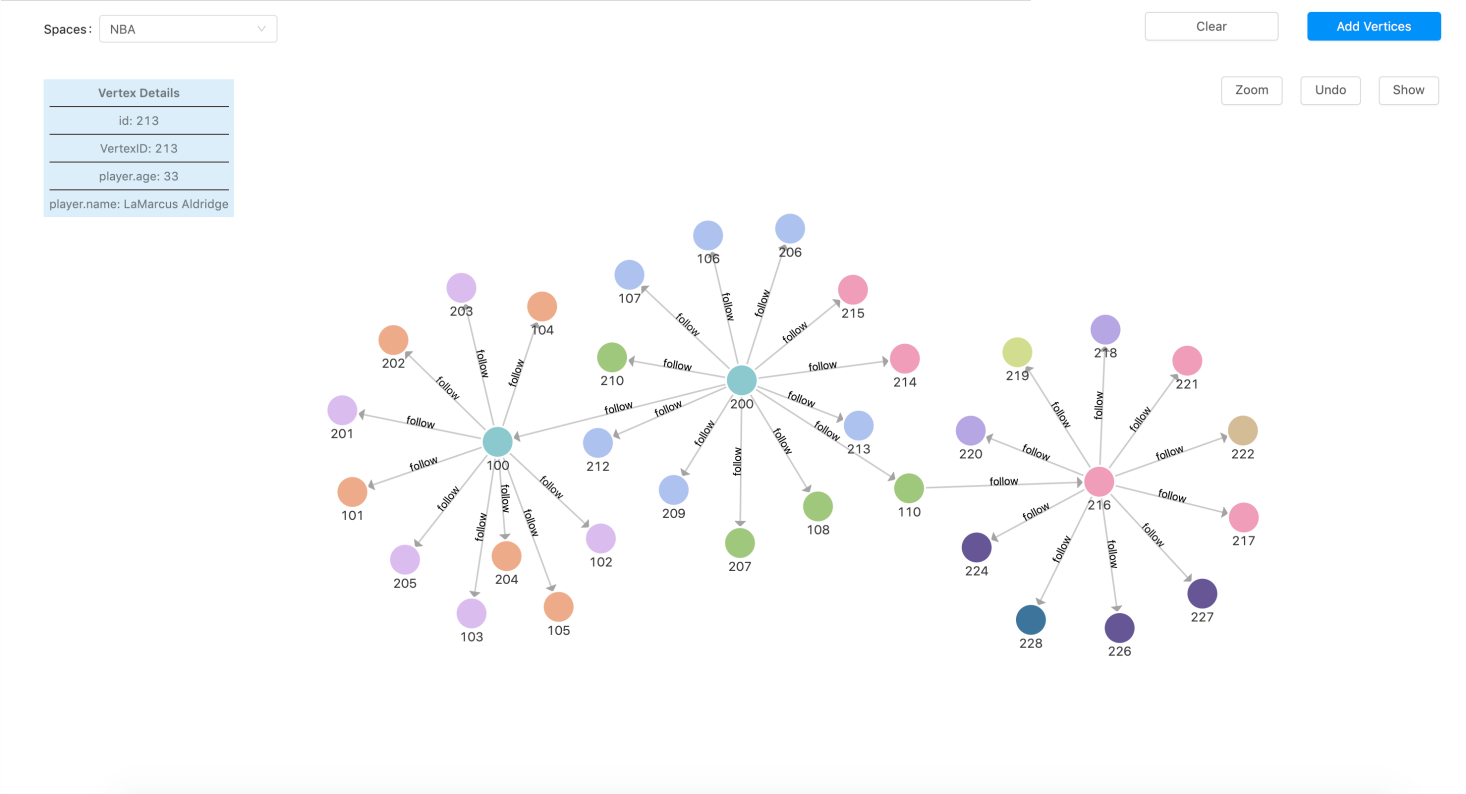
The code above generates a graph as below:
Graph Exploration Layout Optimization
The graph above displays only one-hop relationships from the starting nodes. How about two- or three-hop relationships? The answer is the D3.js enter() API.
The D3.js enter() API processes the new nodes independently. When new nodes are queried and pushed into the nodes array, the API renders them according to the coordinates assigned by the D3-force instance, without changing the information (x, y coordinates included) of the existing nodes.
From the perspective of API, this is definitely understandable. But the newly added nodes can not be handled just with a simple push to the existing D3-force instance because the d3.forceSimulation() module assigns location coordinates randomly.
The coordinates assigned by d3.forceSimulation().node() are random, so are the locations of the explored nodes. Together with the collied and link parameter, nodes associated with the new ones are close to each other under the influence of tractive force. Also, there are collisions among other nodes in the process of approaching. When there are nodes on the force-directed graph, these newly added nodes will make the entire graph collide under the effect of the collision and traction until each node finds its own place. That means the movement only stops when the collision and traction both meet the requirement. Does it look like the Big Bang?
There are two problems in the above process:
- Adding a new node would result in the entire graph’s constant moving
- It takes a relatively long time to be stable
However, this is how the the enter() API is designed.
One solution is to process new nodes and the existing ones separately, which means each node rendering requires traverse to determine whether it is new or existing. Not a performant solution, especially when the quantity is large.
Another common solution is to reduce the collision and increase traction of the D3-force instance. In this way, the nodes find balance state more quickly so that the entire graph is stable. This is a better solution but the disadvantage is that it makes the connection among nodes varies remarkably in length and the graph size is huge. So it’s not an ideal solution for cases with huge data.
We’ve come up with a new solution.
The idea is to ensure that the new node is around the source node. Instead of D3.forceSimulation().node() allocation, set the coordinates of the new node the same as that of the source node. The node collision of the D3-force instance ensures that the appearance of new nodes will not be overwritten, and will eventually appear around the source node.
Although such solution still affects the nodes within a small range, it will not greatly affect the trend of the entire graph. The key codes are as follows:
xxxxxxxxxx
# Set the new nodes coordinates as the source node center or the entire graph center
addVertexes.map(d => {
d.x = _.meanBy(selectVertexes, 'x') || svg.style('width') / 2;
d.y = _.meanBy(selectVertexes, 'y') || svg.style('height') / 2;
});
If there’s no source node, then the new node appears at the center of the graph. This will pose less effect on the existing nodes thus is worth considering.
Layout Optimization of Multiple Edges Display Between Two Nodes
When there are multiple edges between two nodes, the following problems occur:
- The default straight line will overwrite each other. Therefore, curve is a better choice under such circumstances.
- How to define the curvature of the curve to ensure there are no overwritten?
- When you have multiple curves, how to make sure the average semi-circular arc is not on a certain semi-circular?
Below is how we solve the above problems:
- First count the edges between any two nodes and group them to a map. The key in the map is based on the name of the two nodes involved.
- Then divide the edges in the same map into two groups by their direction. There are plenty of ways to determine the edge direction and here we adopt the method to compare the ASCII of source.name and target.name of a node. A linknum is set for each edge with a positive direction. Similarly, a -linknum is set for each edge with a negative direction. The linknum value we set is to determine the curvature and bending direction of the arc.
Refer to the following code for better understanding:
xxxxxxxxxx
const linkGroup = {};
// Set the edges between two nodes as the same key based on their name property.
// Then add the key to the linkGroup, making all edges a group
edges.forEach((link: any) => {
const key =
link.source.name < link.target.name
? link.source.name + ':' + link.target.name
: link.target.name + ':' + link.source.name;
if (!linkGroup.hasOwnProperty(key)) {
linkGroup[key] = [];
}
linkGroup[key].push(link);
});
// Traverse each group to call setLinkNumbers to allocate linknum
edges.forEach((link: any) => {
const key = setLinkName(link);
link.size = linkGroup[key].length;
const group = linkGroup[key];
if (group[group.length - 1] === link) {
setLinkNumbers(group);
}
});
xxxxxxxxxx
// Divide the edges into linkA and linkB based on their directions.
// Then allocate two kinds of linknum to control the upper and lower elliptical arc.
export function setLinkNumbers(group) {
const len = group.length;
const linksA: any = [];
const linksB: any = [];
for (let i = 0; i < len; i++) {
const link = group[i];
if (link.source.name < link.target.name) {
linksA.push(link);
} else {
linksB.push(link);
}
}
let startLinkANumber = 1;
linksA.forEach(linkA=> {
linkA.linknum = startLinkANumber++;
}
let startLinkBNumber = -1;
linksB.forEach(linkB=> {
linkB.linknum = startLinkBNumber--;
}
}
After allocating linknum to each edge, the sign of linknum is judged in the tick event function that monitors the edges. We only need to judge and set the curvature and direction of the path.
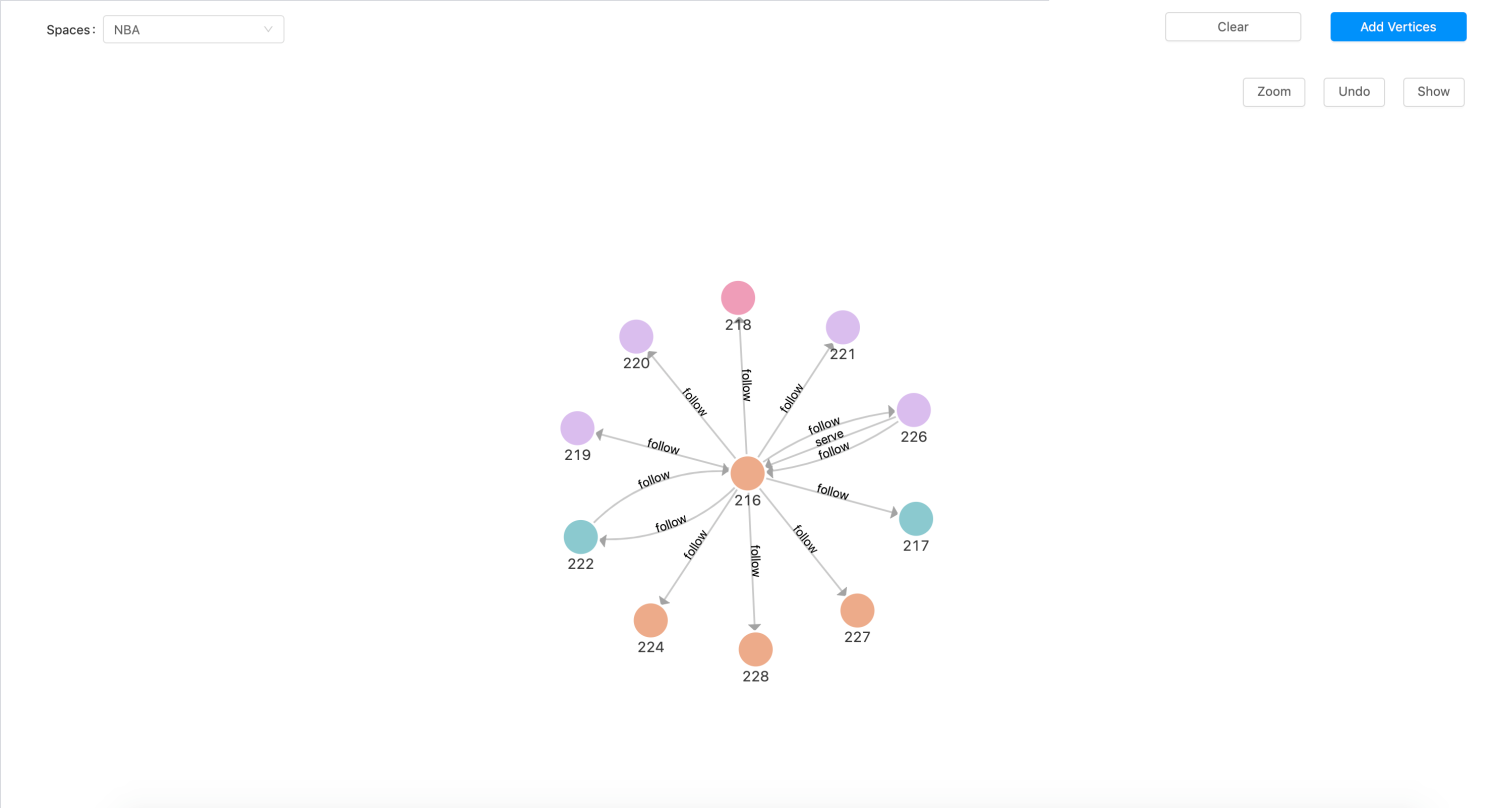
Here’s how it looks:
Conclusion
This is how we optimized the D3.js force-directed graph. There are many issues to concern and optimize if you’re building a complex relationships.
In this article we shared the two most common scenarios, i.e. presenting new nodes and multiple edges between two nodes. We will share more experiences in the future. Stay tuned!
Try Nebula Graph with Nebula Graph Studio to experience the D3.js visualization. Leave us a comment below or head over to our forum if there are any questions.
Published at DZone with permission of Jamie Liu. See the original article here.
Opinions expressed by DZone contributors are their own.
Comments