

Data Manipulation in R Using dplyr
Learn about the primary functions of the dplyr package and the power of this package to transform and manipulate your datasets with ease in R.
Join the DZone community and get the full member experience.
Join For FreeIn our previous article, we discussed the importance of data preprocessing and data management tasks in a data science pipeline. Also, we provided a brief explanation of the dplyr R package. This article will focus on the power of this package to transform your datasets with ease in R.
The dplyr package has five primary functions, commonly known as verbs. The verbs aids in performing most of the typical data manipulation operations, which we will discuss in the below sections.
Glimpse
The glimpse method can be used to see the columns of data and display some portion of the data for each variable that can be fit on a single line.
library(dplyr)
glimpse(mtcars)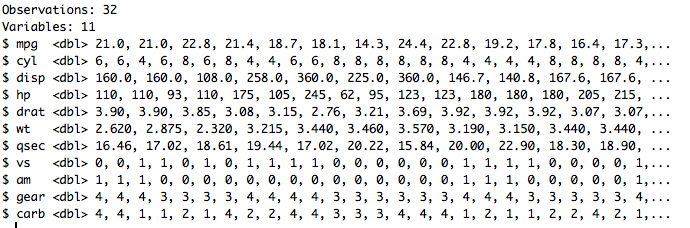
Select
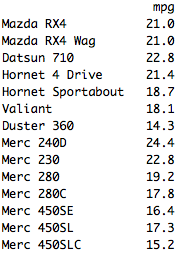
select is used for choosing display variables based on the subset criteria. For instance, select(mtcars,mpg) displays the MPG column from the mtcars dataset:
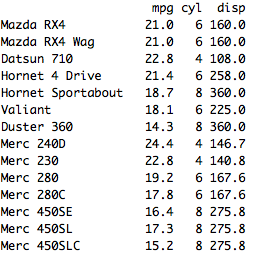
select(mtcars,mpg:disp) displays data in the columns from MPG to DISP, as shown in the below results:
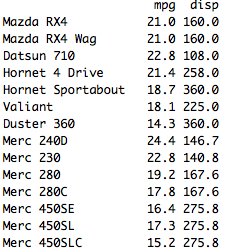
select(mtcars, mpg:disp,-cyl) displays data in the columns from MPG to DISP without the CYL attribute:
Pipe Operator
pipe operator(%>%) is used to tie multiple operations together. This makes it easy, especially when we need to perform various operations on a dataset to derive the results.
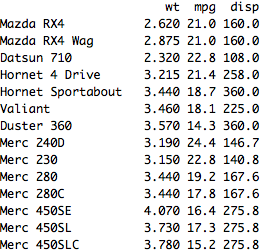
We can read mtcars %>% select(wt,mpg,disp) from left to right — from the mtcars dataset, select WT, MPG, and DISP variables.
Mutate
mutate is used to add new columns to a dataset. It is useful to create attributes that are functions of other attributes in the dataset. It's one of the essential tools that can come handy for new feature creation in the data preprocessing stage.
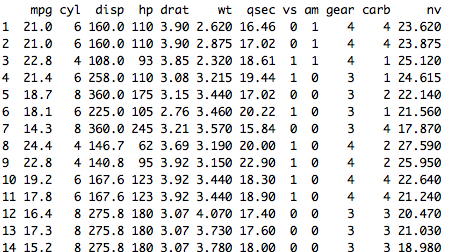
mtcars %>% mutate(nv=wt+mpg) creates a new attribute NV by adding WT and MPG together.
Filter
The filter method selects cases based on their values.
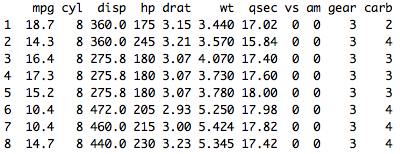
mtcars %>% filter(hp>123) displays data whose HP values are more than 123.
Group_by
group_by is used to group data together based on one or more columns. It is often used along with a summarizing function to derive aggregated values:
mtcars %>% filter(hp>123) %>% group_by(am) Summarize
summarize is used to aggregate multiple values to a single value. It is most often used with the group_by function, and the output has one row per group:
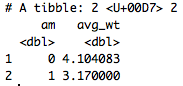
mtcars %>% filter(hp>123) %>% group_by(am) %>% summarize(avg_wt=mean(wt)) This command calculates the average WT for each unique value in the AM column for mtcar data having HP > 123.
Arrange
arrange is used to sort cases is ascending or descending order. The default is ascending order:
mtcars %>% filter(hp>123) %>% arrange(mpg) 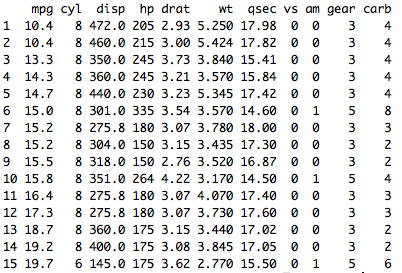
As shown below, use desc to order the data in descending order.
mtcars %>% filter(hp>123) %>% arrange(desc(mpg)) 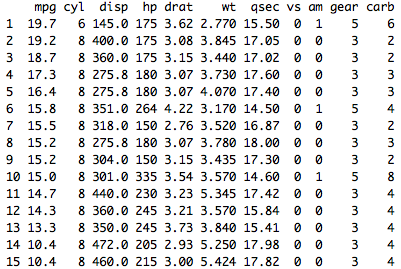
To learn more about dplyr, see here.
Though we can perform these tasks using base R functions, the verbs in dplyr are optimized for high performance, are easier to work with, and are consistent in the syntax. So, pick up a dataset, get started with dplyr, and share your data preparation story on DZone for other people to understand.
Opinions expressed by DZone contributors are their own.
Comments