Debug JavaScript Using Chrome Developer Tools
If you're a web developer, you work in JavaScript. Learn how to debug your JS code using Google's Developer Tools Console!
Join the DZone community and get the full member experience.
Join For FreeIntroduction
JavaScript is undoubtedly one of the most popular web programming languages. With the number of frameworks that are built using JavaScript increasing rapidly, web developers can utilize many features offered by them effectively. When it comes to effective programming, every developer faces a common objective of writing bug-free code. Every modern web browser now comes with a feature to debug the code easily using Developer Tools. Every JS developer will know how important F12 is while working on a JS application. We will now see how one can debug JS code in one of the most popular modern web browsers, Chrome using its DevTools.
The Bug
Let us look at some simple JS code with a bug and try to fix that using Dev Tools.
Index.html
<!doctype html>
<html>
  <head>
    <title>Sample JS to Add two numbers</title>
  </head>
  <body>
    <h1>Add two numbers</h1>
    <label for="num1">Number 1</label>
    <input id="num1">
    <label for="num2">Number 2</label>
    <input id="num2">
    <button>Add</button>
    <p></p>
    <script src="sample.js"></script>
  </body>
</html>
Sample.js
var input = document.querySelectorAll('input');
var label = document.querySelector('p');
var button = document.querySelector('button');
button.addEventListener('click', onClick);
function onClick() {
var num1 = input[0].value;
var num2 = input[1].value;
var sum = num1 + num2;
label.textContent = num1 + ' + ' + num2 + ' = ' + sum;
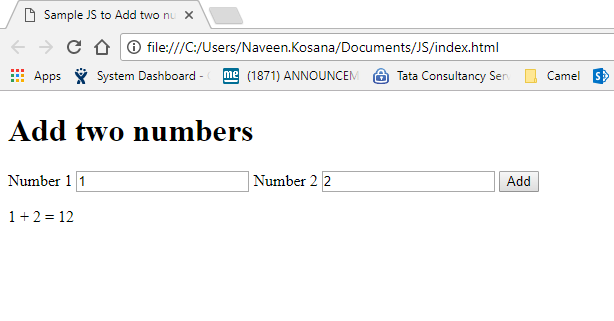
}Run the above code and you should able to see a page with two text fields and a button. Now type in two numbers in the text fields and click on the Add button. We can see that the application doesn’t do what is intended. It doesn’t display the sum. We will now fix this bug.
The Tool
Event-Based Breakpoints
Breakpoints can be used when we want to pause the execution of code at any certain line of code. We can then check what values are stored in any variable at that point of time.
- Click F12 to open Developer Tools in Chrome. Or we can right-click and select Inspect (Ctrl+Shift+I).
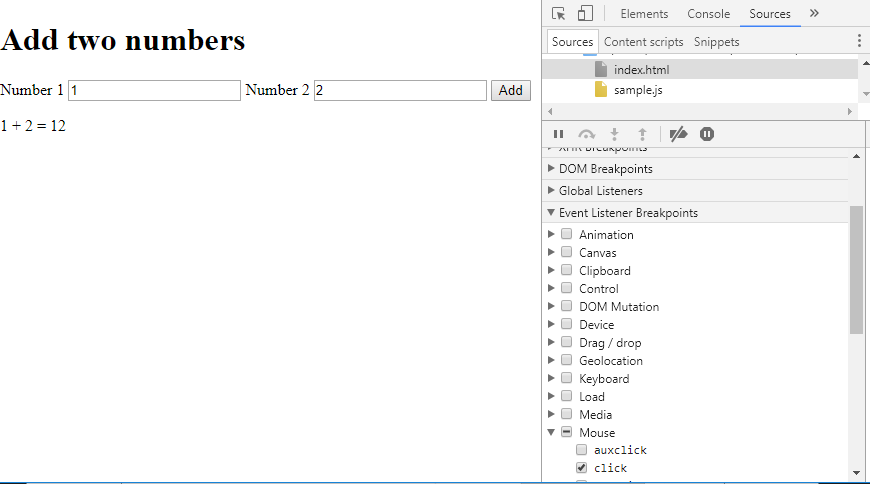
- Go to Sources tab and expand Event Listener Breakpoints section. We can find different events listed in the section like Keyboard, Device, Mouse, etc.
- Expand the Mouse checkbox and select the click checkbox.
- This implies that whenever a click event happens, the code execution pauses at that moment. This is an event-based breakpoint.
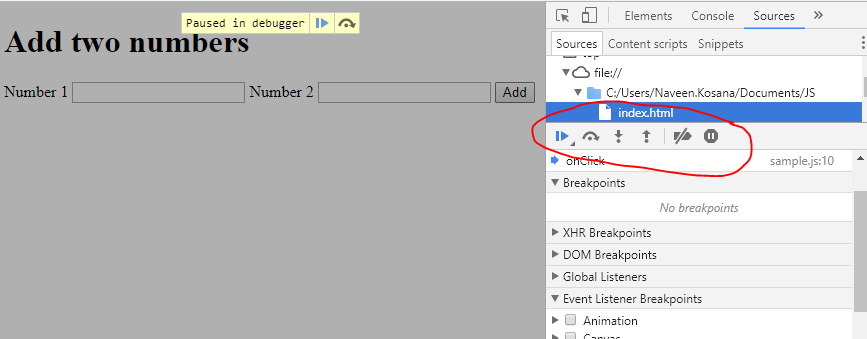
Now go ahead and try to add two numbers. When we click on Add button, the code execution is paused and the line with onClick function is highlighted. Since it’s an event based breakpoint, DevTools pauses on the line which contains that event’s handler.
Stepping Through Code
Stepping through the code helps us to execute the code line by line and we can check the order in which the code is executing. We can do three different types of steps while going through a code. In the Sources panel of the Developer Tool, we can find the buttons for step into, step out, and step over.
- Step-into: When we click on the step-into button, the code inside the
onClick()function will get executed line by line with each step-into click. - Step-over: When we click on the step-over button, the code inside the
onClick()function is skipped and the execution stops as there are no more lines of code after the function definition. If there are any lines present after the function definition, the control directly skips to that line of code. - Step-out: When inside a function, if we click on the step-out button, the control skips the rest of the function and jumps to the line where the function was called.
Based on the assumption of the location of the bug, we can set a breakpoint closer to that part of the code rather than just putting on an event.
Line-of-Code Breakpoints
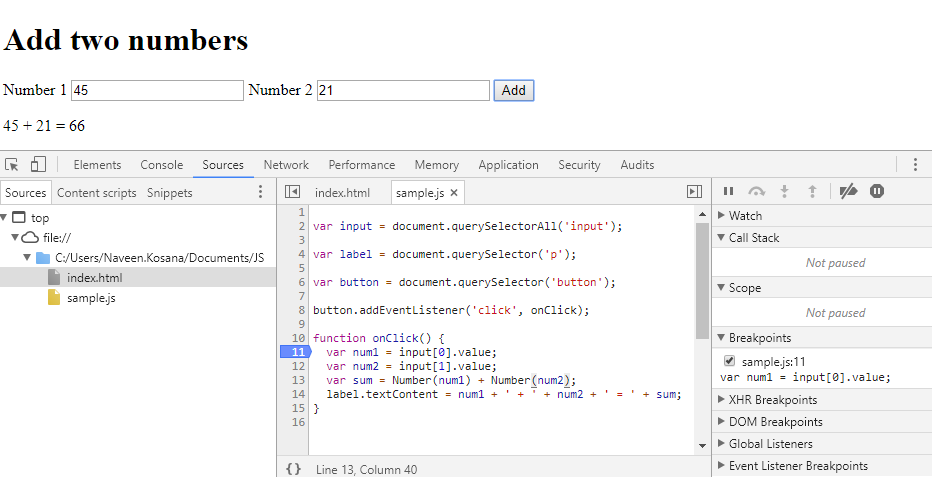
We can set a breakpoint on a certain line of code which is called a 'line-of-code breakpoint.'
Just click on the line number on the left side of the code. The color of that number changes to blue which indicates that the breakpoint is set. Now during the run, the execution will pause at that line-of-code.
When a breakpoint is set, we can easily identify what is stored in a variable at that moment of time. Let us set a breakpoint at line 11 in our code and see how the variable values change. We can check that in the Local section of the Developer Tools.
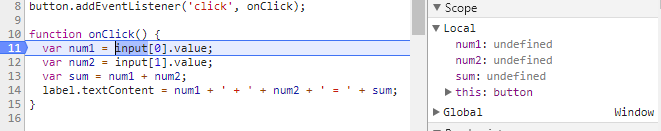
- Initially, the values are “undefined” for variables num1, num2, and sum, since we haven’t set the variables yet.
- Now step into (F11) the function and see how the variable values change.
- When we reach the variable sum, one can see that it is being evaluated as a string. So, this might be the cause of the bug.
Watch and Console
To confirm whether this is the bug or not we can use three different methods to find out how the variable sum is being evaluated.
Console.log() –console.log() is used in the code to check how the values of the variables are changing over time. But this involves manual editing of the code and we need to place multiple lines of console.log() to find where the bug is.
Console – Console is used to execute random JavaScript statements. We can overwrite variable values when debugging the code in the console. For example, we can simply give num1 + num2 in the console and hit enter. We will get the value in the next line. We can reassign the values in num1 and num2. Console is mainly used for such testing purposes.
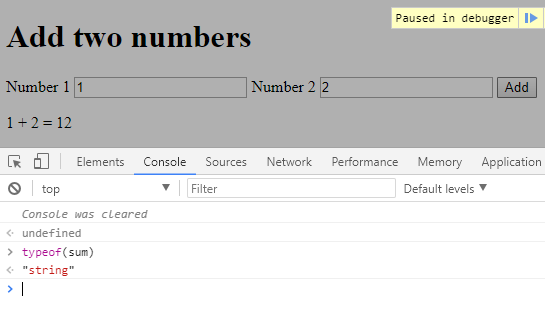
For confirming this bug, let us find the typeof sum variable through the console.
Type in typeof(sum) in the console in debugging mode. We should see the type as a string, which confirms our assumption that the variable sum is being evaluated as a string but not a number.
Watch – Another alternative to console.log(), and the easiest way to debug in Developer Tools, is the use of Watch Expressions in DevTools. We can simply add any variable or any JavaScript expression in the watch, and, during the execution, we can simply watch how the values or the expressions change over time.
In the Sources panel, expand the Watch section. Now click on the + symbol to add an expression.
Type typeof(sum)and hit enter. We will be able to see that the type of sum is “String.” Hence, this also confirms our assumption that sum is being evaluated as a string.
The Fix
Since we have identified the bug now, we just have to convert the string inputs to a number and assign the total of numbers to the sum variable. We can change the statement on line 13 to one of the following:
var sum = Number(num1) + Number(num2);or
var sum = parseInt(num1) + parseInt(num2);We can edit the code in the Sources panel directly and save using Ctrl+S to test the fix.
Now resume the execution.
We can deactivate the breakpoints using the Deactivate Breakpoints option (Ctrl+F8) in the Sources panel of Developer Options
Now the application should be working fine. These are the basic steps one can try to debug a JavaScript code using Chrome Developer Tools.
Opinions expressed by DZone contributors are their own.
Comments