Debugging Tools in Xcode
We take a look at 10 built-in tools in Xcode that make creating bug-free iOS applications a little easier. Which tools is your favorite?
Join the DZone community and get the full member experience.
Join For FreeDebugging code written in Swift/Objective-C can be tricky sometimes, especially for someone who’s just starting to learn iOS programming. I'm listing a few techniques and tools for debugging code in Xcode, that any iOS developer should be familiar with.
Xcode is a powerful IDE, hiding amazingly advanced debugging tools that can be overwhelming for a new iOS programmer. I'm not describing in detail each of these debugging tools in Xcode since this post is meant only to make you aware of the existence of these debugging features.
1. View Hierarchy Debugger
An extremely powerful tool that provides you with a way to visualize your views and the UI hierarchy. You can rotate the screen, select any view, check out children as well as the name of their view classes. You can also inspect the auto layout constraints or find the memory address of the objects underlying the views.
2. Advanced Breakpoints
Breakpoints can be used for actions that are much more complex than simply breaking into a method and pausing the execution at a specific line to inspect the current application context. Try editing a breakpoint and check out the wide variety of options. Xcode support for conditional breakpoints sets the number of times before stopping for each breakpoint as well as takes specific actions when an advanced breakpoint gets hit, such as logging, running a shell command, an Apple Script, or even playing a sound. Extremely useful, especially when debugging multithreaded environments or methods that are being called tons of times (such as layoutSubviews, for example). 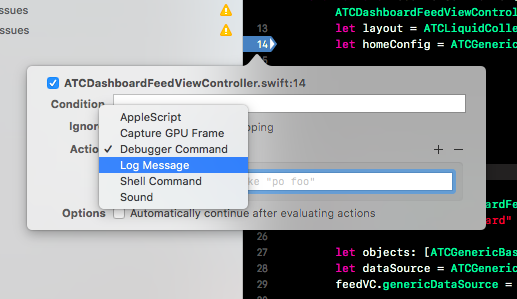
3. Generic Breakpoints
As showcased in the picture below, you can use generic breakpoints to pause the execution of the application right before an exception is being thrown out or a test case fails. This is an extremely powerful debugging technique. Check out Apple’s documentation for each of them, to learn more details about these generic breakpoints.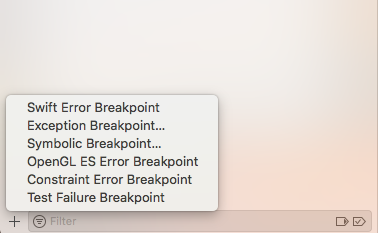
4. Debug Navigator
The debug navigator in Xcode has a set of effective debugging tools. In addition to displaying how much memory, network, CPU, and disk your current app instance is using, it has an interactive call stack navigator, listing all the threads and grand central dispatch queues currently running in your app’s sandbox, together with their current call stack. You can click on each method’s signature and inspect the object graph and app state context at each step of the execution. This is amazing for debugging code as well as ramping up on large codebases since it shows exactly where all the methods are being called from and in what order. Amazing!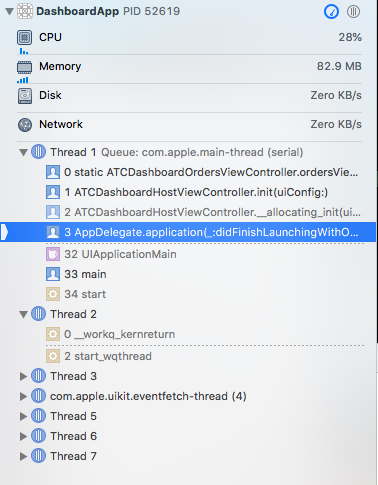
5. Location Simulator
Next to the “Debug View Hierarchy” button, there’s a “Simulate location” feature, that will allow you to simulate any locations where you want to test your app. This is very useful for ensuring your app behaves properly in any location.
6. Debugging Slow Animations
This is more of an iOS Simulator debugging trick, but it’s extremely effective for iOS apps when debugging animations. It does what the name implies: slows down the execution of the UI animations so that they can be checked with human eyes. In this way, you can notice any glitches in your animations and you’ll be able to find out when and why they happen easily.
7. Color Blended Layers
If you’re debugging layout performance for your iOS mobile app, you should turn on the “Color Blended Layers” options on your simulator. This feature will highlight in a red color which areas of your UI layout takes a lot of time to render, and therefore affects performance. Things like blurring effects or unwise opacity settings can affect the performance of your app. Ideally, all the highlighted layers should be green on the entire screen.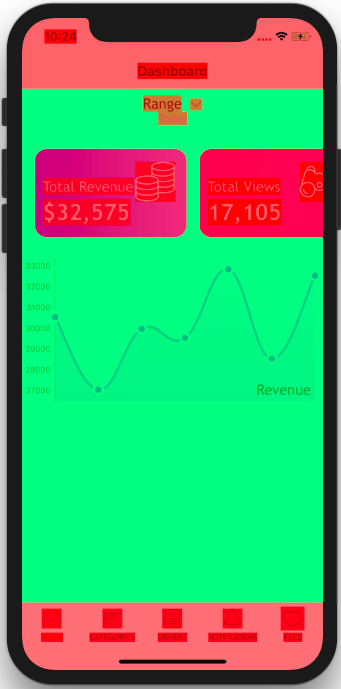
8. Quick Look
The quick look button will allow you to visualize the selected in-memory instances of your classes when hitting a breakpoint. This can mean different things for different classes. For example, you can view the real image that’s being stored into an UIImage object (just like in the following photo). Check out Apple’s documentation for a full understanding of the Quick Look debugging tool.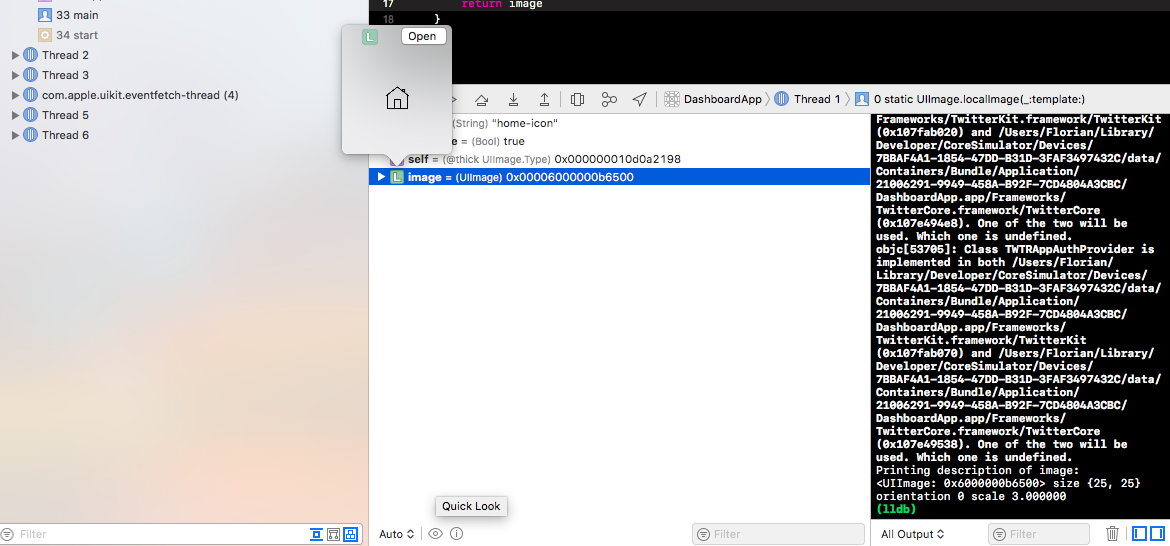
9. Simulate Background Fetch
Located under Xcode -> Debug -> Simulator Background Fetch, this tool is very powerful when debugging iOS apps that make use of the background fetch API, making it possible to manually trigger an operation that’s otherwise being done this via the operating systems, in a production environment.
10. LLDB Advanced Debugging
This is a complete command language, powering an excellent debugging experience for experienced developers. You can basically run complex commands directly on the objects that exist in the current app’s sandbox. Check out Apple’s documentation on LLDB. I highly recommend using Facebook’s Chisel, which is a rich open source set of LLDB commands built by Facebook.
Published at DZone with permission of Florian Marcu. See the original article here.
Opinions expressed by DZone contributors are their own.
Comments