Deep Dive Into Terraform Provider Debugging With Delve
In this article, we will learn how to enhance debugging skills and troubleshoot issues in Terraform providers with confidence.
Join the DZone community and get the full member experience.
Join For FreeDebugging Terraform providers is crucial for ensuring the reliability and functionality of infrastructure deployments. Terraform providers, written in languages like Go, can have complex logic that requires careful debugging when issues arise. One powerful tool for debugging Terraform providers is Delve, a debugger for the Go programming language. Delve allows developers to set breakpoints, inspect variables, and step through code, making it easier to identify and resolve bugs. In this blog, we will explore how to use Delve effectively for debugging Terraform providers.
Setup Delve for Debugging Terraform Provider
# For Linux

sudo apt-get install -y delve

# For macOS

brew instal delve
Refer here for more details on the installation.
Debug Terraform Provider Using VS Code
Follow the below steps to debug the provider
- Download the provider code. We will use IBM Cloud Terraform Provider for this debugging example.
- Update the provider’s main.go code to the below to support debugging
package main

import (
	"flag"
	"log"

	"github.com/IBM-Cloud/terraform-provider-ibm/ibm/provider"
	"github.com/IBM-Cloud/terraform-provider-ibm/version"
	"github.com/hashicorp/terraform-plugin-sdk/v2/plugin"
)

func main() {
	var debug bool

	flag.BoolVar(&debug, "debug", true, "Set to true to enable debugging mode using delve")
	flag.Parse()

	opts := &plugin.ServeOpts{
		Debug:        debug,
		ProviderAddr: "registry.terraform.io/IBM-Cloud/ibm",
		ProviderFunc: provider.Provider,
	}

	log.Println("IBM Cloud Provider version", version.Version)
	plugin.Serve(opts)
}- Launch VS Code in debug mode. Refer here if you are new to debugging in VS Code.
- Create the launch.json using the below configuration.
{
	"version": "0.2.0",
	"configurations": [ {
		"name": "Debug Terraform Provider IBM with Delve",
		"type": "go",
		"request": "launch",
		"mode": "debug",
		"program": "${workspaceFolder}",
		"internalConsoleOptions": "openOnSessionStart",
		"args": [ "-debug" ]
	} ]
}- In VS Code click “Start Debugging”.
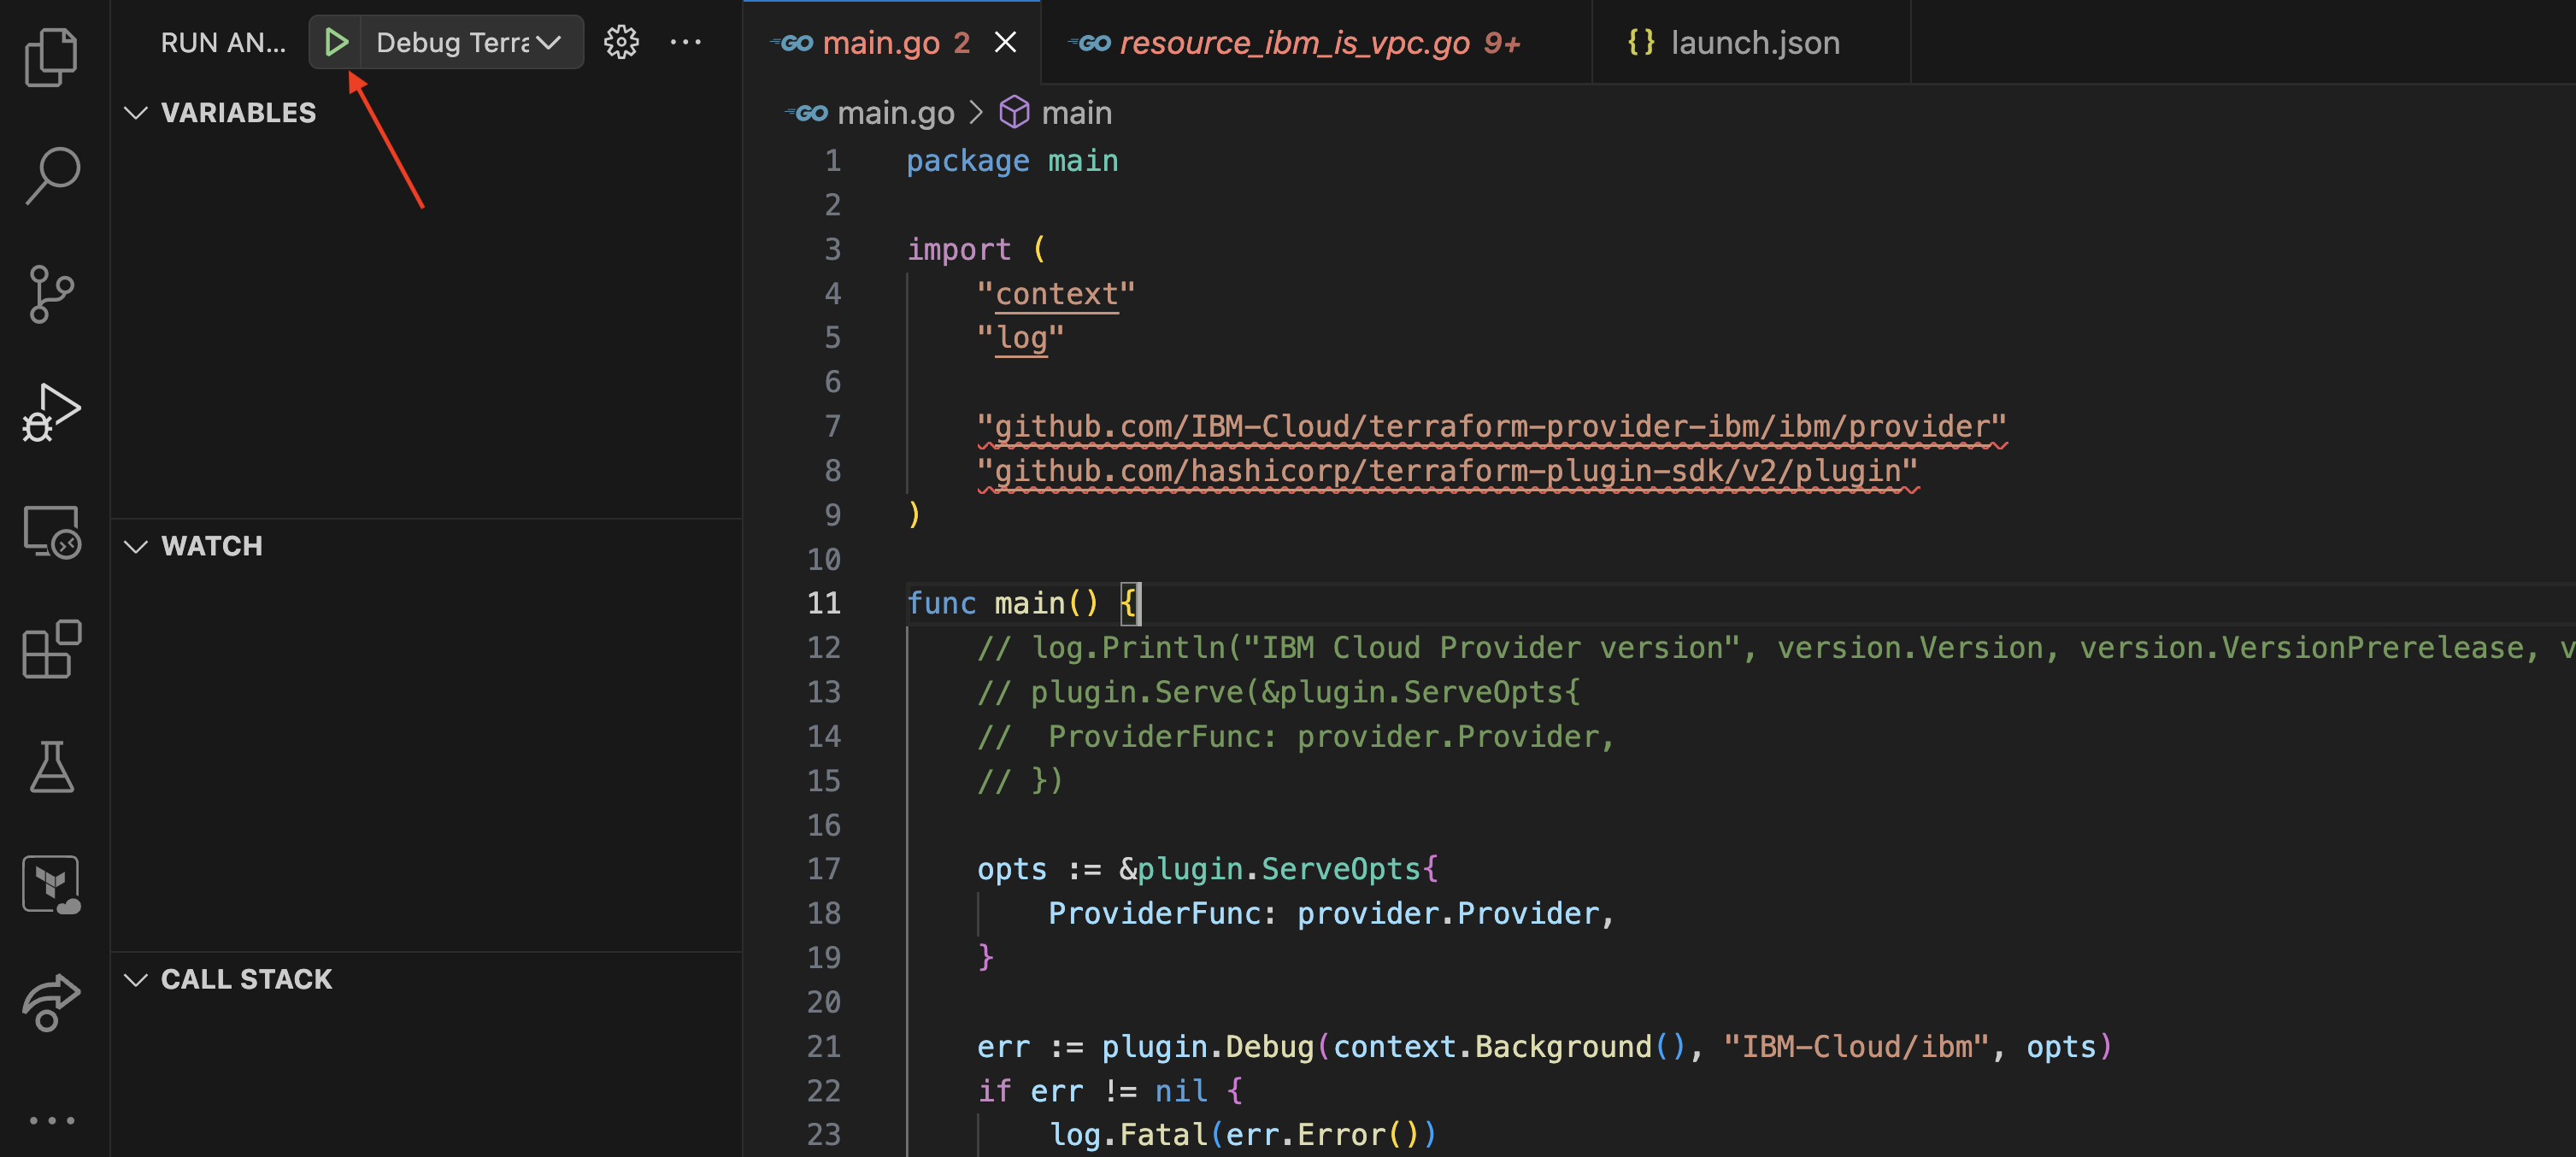
- Starting the debugging starts the provider for debugging. To attach the Terraform CLI to the debugger, console prints the environment variable
TF_REATTACH_PROVIDERS. Copy this from the console.
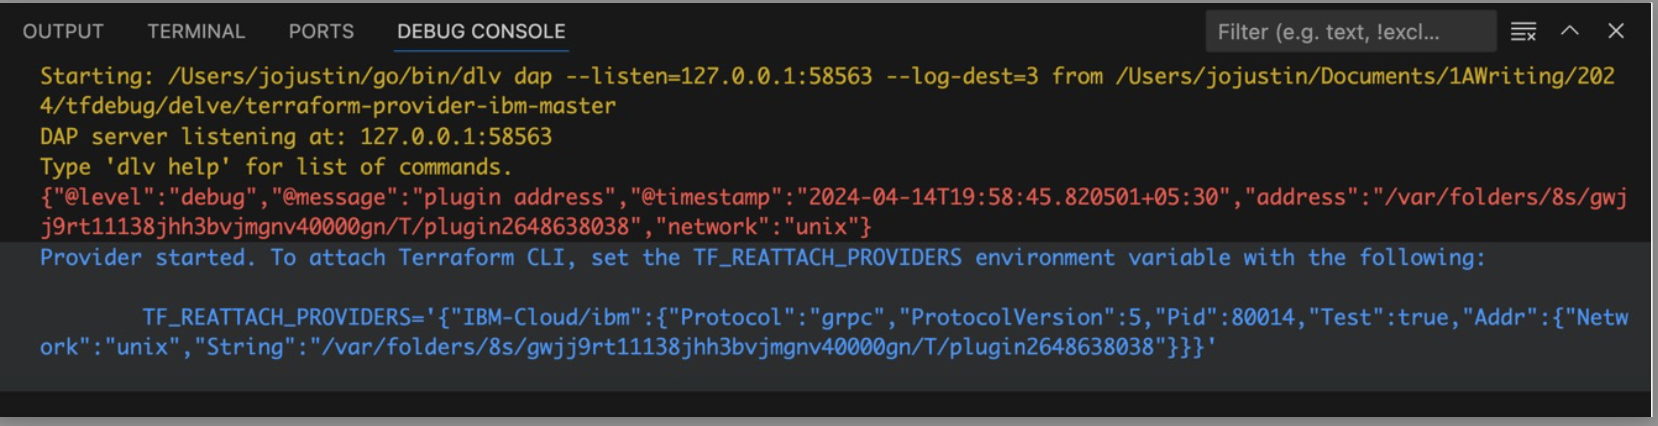
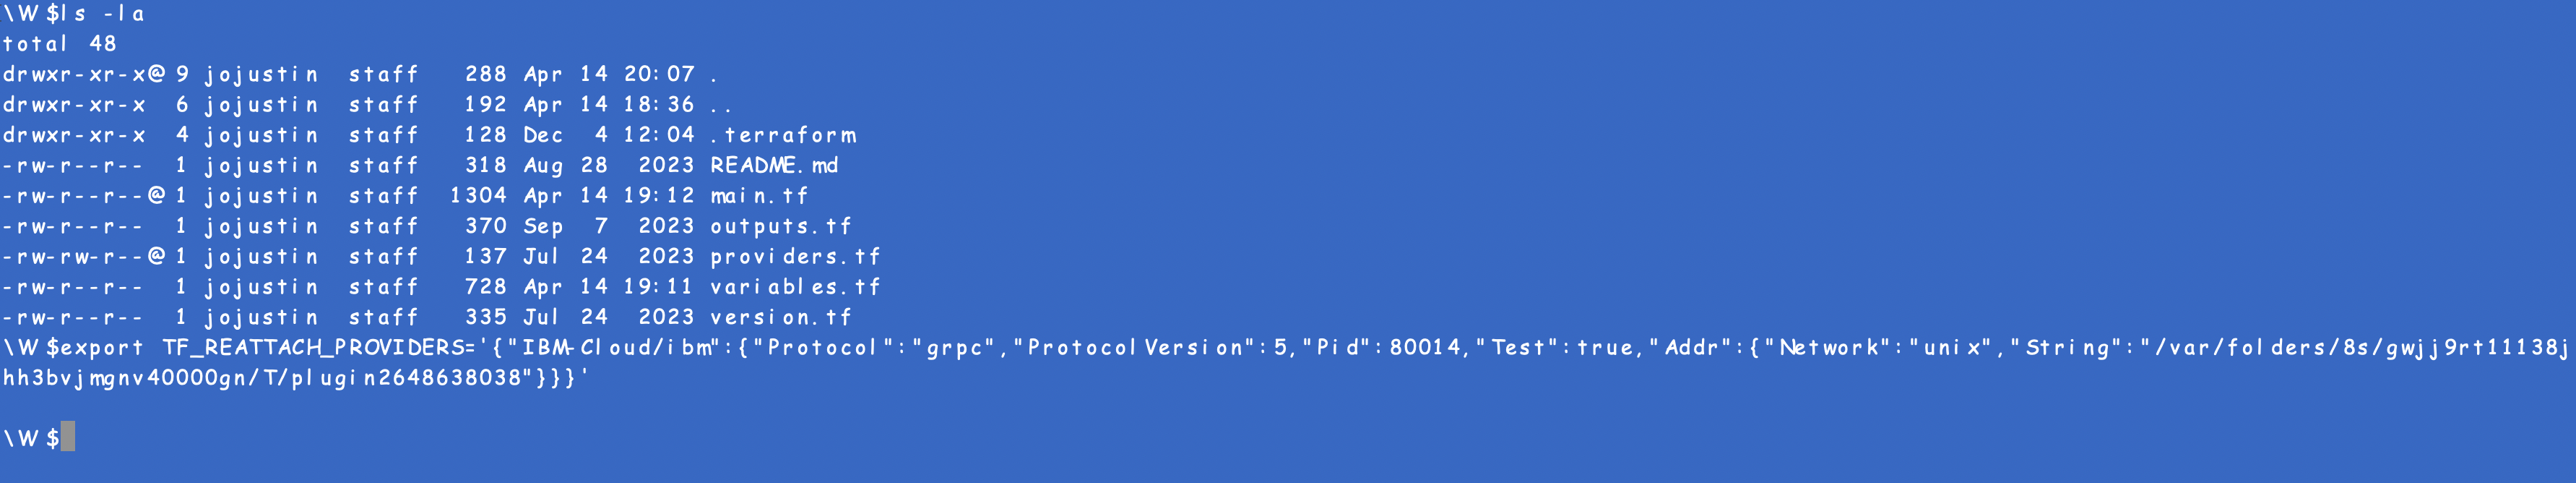
- Set this as an environment variable in the terminal running the Terraform code.
- Now in the VS Code where the provider code is in debug mode, open the go code to set up break points. To know more on breakpoints in VS Code refer here.
- Execute 'terraform plan' followed by 'terraform apply', to notice the Terraform provider breakpoint to be triggered as part of the terraform apply execution.
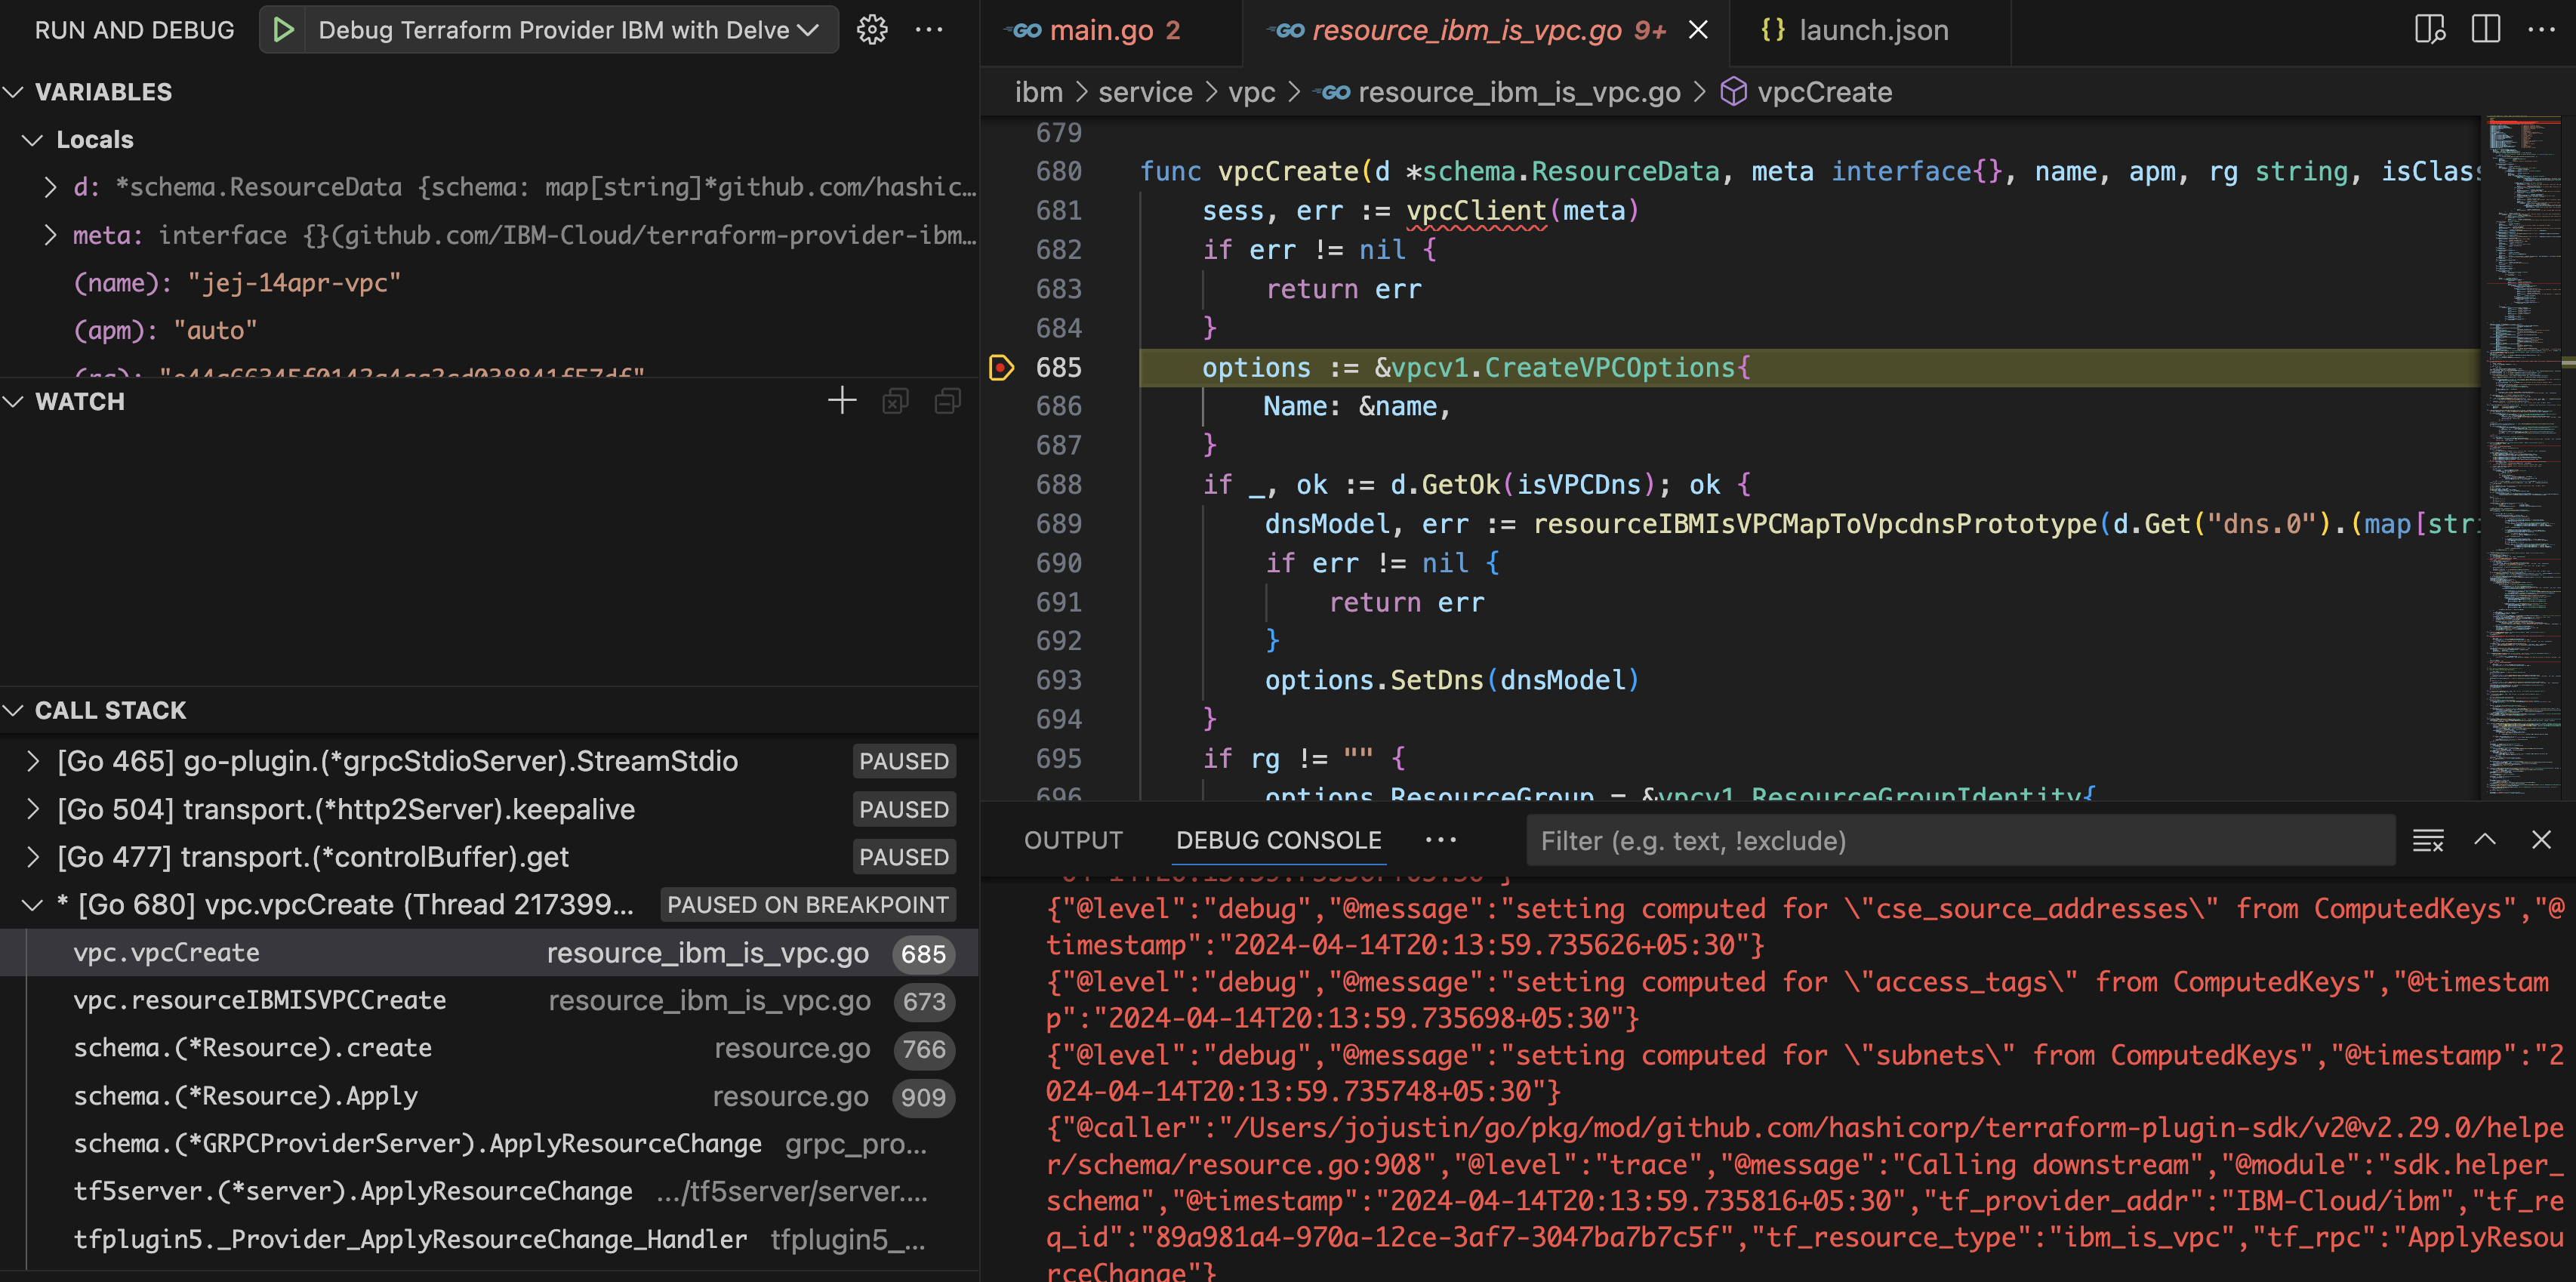
This helps to debug the Terraform execution and comprehend the behavior of the provider code for the particular inputs supplied in Terraform.
Debug Terraform Provider Using DLV Command Line
Follow the below steps to debug the provider using the command line. To know more about the dlv command line commands refer here.
- Follow the 1& 2 steps mentioned in Debug Terraform provider using VS Code
- In the terminal navigate to the provider go code and issue
go build -gcflags="all=-N -l"to compile the code - To execute the precompiled Terraform provider binary and begin a debug session, run
dlv exec --accept-multiclient --continue --headless <path to the binary> -- -debugwhere the build file is present. For IBM Cloud Terraform provider usedlv exec --accept-multiclient --continue --headless ./terraform-provider-ibm -- -debug
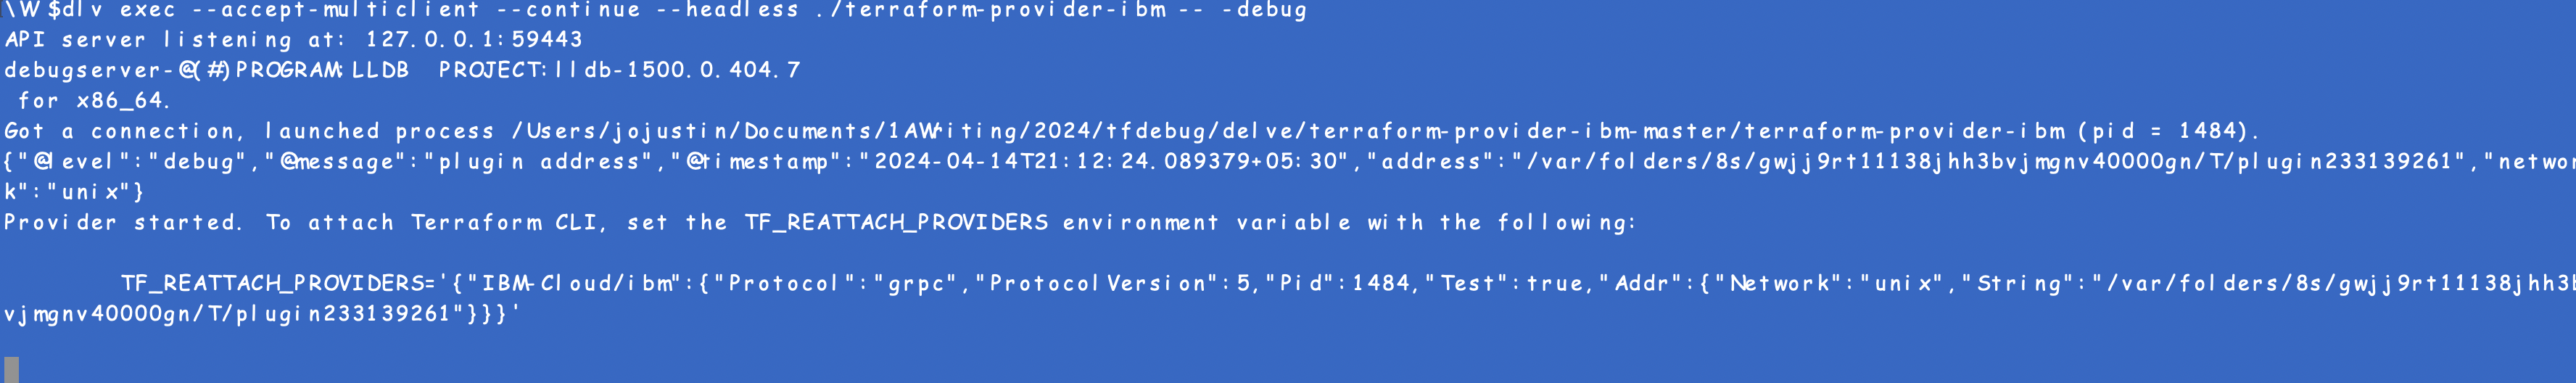
- In another terminal where the Terraform code would be run, set the
TF_REATTACH_PROVIDERSas an environment variable. - Notice the “API server” details in the above command output.
- In another (third) terminal connect to the DLV server and start issuing the DLV client commands
- Set the breakpoint using the
breakcommand
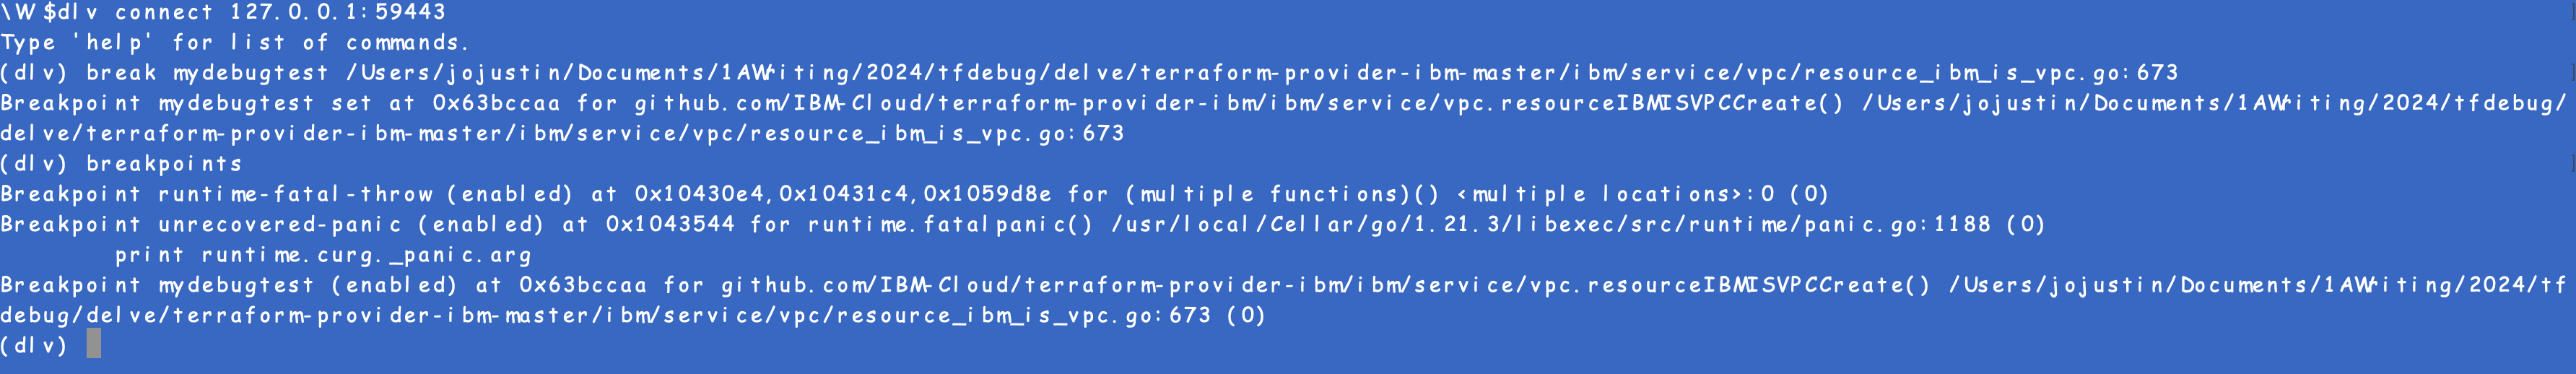
- Now we are set to debug the Terraform provider when Terraform scripts are executed.
- Issue
continuein the DLV client terminal to continue until the breakpoints are set. - Now execute the
terraform planandterraform applyto notice the client waiting on the breakpoint. Use DLV CLI commands tostepin/stepout/continuethe execution.
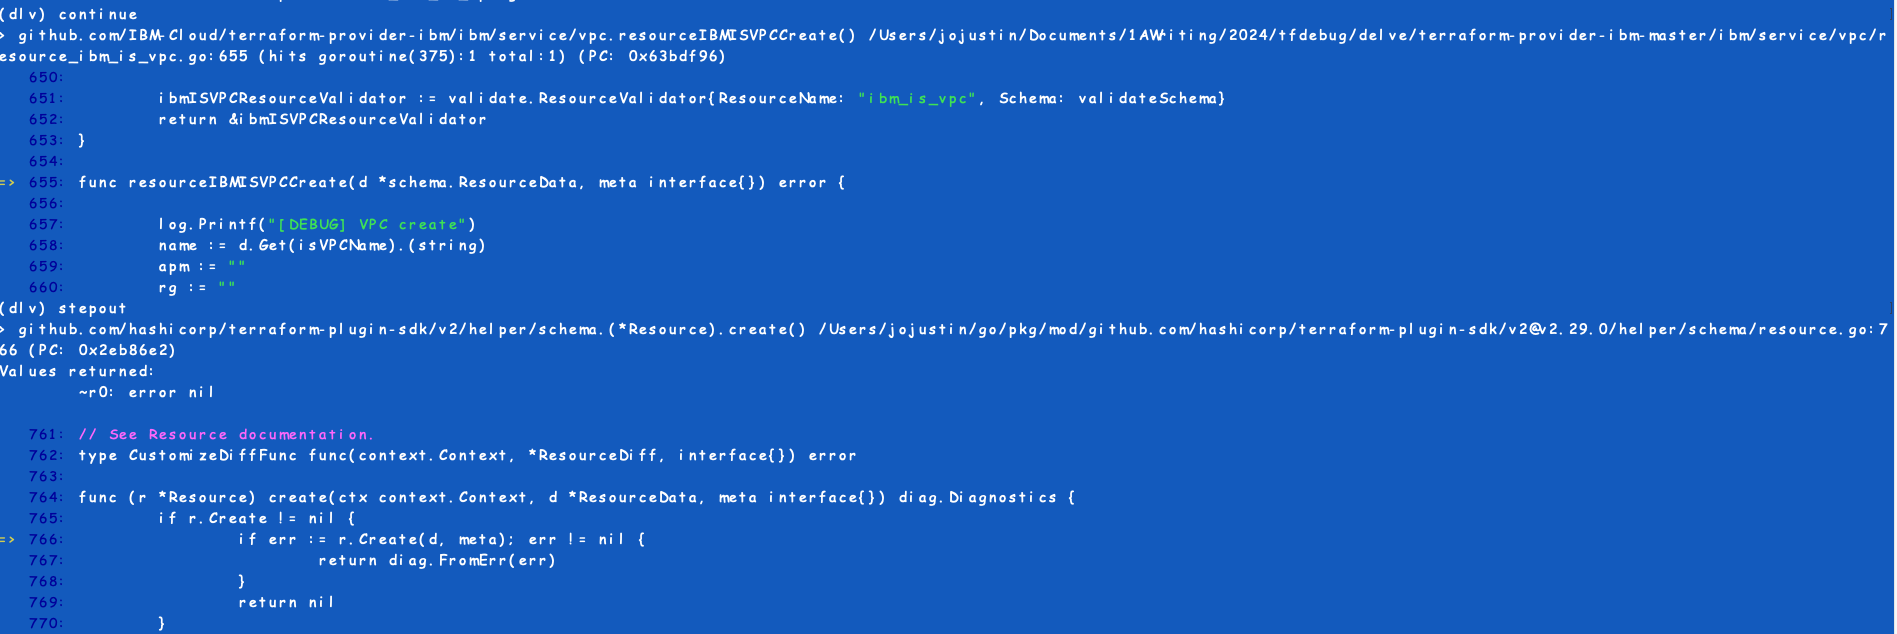
This provides a way to debug the terraform provider from the command line.
Remote Debugging and CI/CD Pipeline Debugging
Following are the extensions to the debugging using the dlv command line tool.
Remote Debugging
Remote debugging allows you to debug a Terraform provider running on a remote machine or environment.
Debugging in CI/CD Pipelines
Debugging in CI/CD pipelines involves setting up your pipeline to run Delve and attach to your Terraform provider for debugging. This can be challenging due to the ephemeral nature of CI/CD environments. One approach is to use conditional logic in your pipeline configuration to only enable debugging when a specific environment variable is set. For example, you can use the following script in your pipeline configuration to start Delve and attach to your Terraform provider –
- name: Debug Terraform Provider
  if: env(DEBUG) == 'true'
  run: |
    dlv debug --headless --listen=:2345 --api-version=2 &
    sleep 5 # Wait for Delve to start
    export TF_LOG=TRACE
    terraform init
    terraform apply
Best Practices for Effective Debugging With Delve
Here are some best practices for effective debugging with Delve, along with tips for improving efficiency and minimizing downtime:
- Use version control: Always work with version-controlled code. This allows you to easily revert changes if debugging introduces new issues.
- Start small: Begin debugging with a minimal, reproducible test case. This helps isolate the problem and reduces the complexity of debugging.
- Understand the code: Familiarize yourself with the codebase before debugging. Knowing the code structure and expected behavior can speed up the debugging process.
- Use logging: Add logging statements to your code to track the flow of execution and the values of important variables. This can provide valuable insights during debugging.
- Use breakpoints wisely: Set breakpoints strategically at critical points in your code. Too many breakpoints can slow down the debugging process.
- Inspect variables: Use the print (p) command in Delve to inspect the values of variables. This can help you understand the state of your program at different points in time.
- Use conditional breakpoints: Use conditional breakpoints to break execution only when certain conditions are met. This can help you focus on specific scenarios or issues.
- Use stack traces: Use the stack command in Delve to view the call stack. This can help you understand the sequence of function calls leading to an issue.
- Use goroutine debugging: If your code uses goroutines, use Delve's goroutine debugging features to track down issues related to concurrency.
- Automate debugging: If you're debugging in a CI/CD pipeline, automate the process as much as possible to minimize downtime and speed up resolution.
By following these best practices, you can improve the efficiency of your debugging process and minimize downtime caused by issues in your code.
Conclusion
In conclusion, mastering the art of debugging Terraform providers with Delve is a valuable skill that can significantly improve the reliability and performance of your infrastructure deployments. By setting up Delve for debugging, exploring advanced techniques like remote debugging and CI/CD pipeline debugging, and following best practices for effective debugging, you can effectively troubleshoot issues in your Terraform provider code. Debugging is not just about fixing bugs; it's also about understanding your code better and improving its overall quality. Dive deep into Terraform provider debugging with Delve, and empower yourself to build a more robust and efficient infrastructure with Terraform.
Opinions expressed by DZone contributors are their own.
Comments