Setting Up the ELK Stack With Spring Boot Microservices
Learn about the ELK monitoring and logging stack and how to collate logs for multiple microservices in one location.
Join the DZone community and get the full member experience.
Join For FreeOne of the important phases in IT is the post-production phase, and one of the major challenges is to identify issues in post-production. When multiple applications spit out different logs in different systems, it is important to collate them in one place for the IT team to manage. Here, the ELK stack comes to the rescue. In this tutorial, I will cover what ELK is and how to aggregate the logs from different microservices and push them to one common location.
What Is ELK?
ELK is an acronym for Elasticsearch, Logstash, and Kibana. It is an open-source software owned by Elastic.
Elasticsearch is an Apache Lucene-based search engine which searches, stores, and analyzes huge volumes of data in almost real time. Elasticsearch can be installed on-premise or can be used as a SaaS application.
Logstash is the log aggregator, which has a pipeline to take the input, filter the data, and send the output. Logstash can take logs from various sources using different input plugins and send the output in a desired manner.
Kibana is a software to visualize the Elasticsearch data. It comes as a plugin with Elasticsearch. Elasticsearch and Kibana can be deployed as a cloud service and hosted on AWS or GCP. Kibana can also be installed in on-premise infrastructure. In this tutorial, we will use the Docker image of ELK and set it up in EC2.
Design Architecture:

In the above design, different microservices will be spitting out logs. We will have the Syslog driver to push the logs generated from different microservices to Logstash, which will filter the logs and push them to Elasticsearch. All the aggregated logs will be visible in Kibana.
Setting Up ELK on EC2
We will be setting up ELK on an EC2 Ubuntu machine using the official Docker images. Log in to EC2 server and create a directory called "elk" in the path /home/ubuntu/.
Install Docker on EC2 by following the steps mentioned here.
Navigate into the "elk" directory and create a file called docker-compose.yml
version: '2'
services:
    elasticsearch:
        image: docker.elastic.co/elasticsearch/elasticsearch:6.3.2
        ports:
            - '9200:9200'
            - '9300:9300'
    kibana:
        image: docker.elastic.co/kibana/kibana:6.3.2
        ports:
            - '5601:5601'
        depends_on:
            -  elasticsearch
    logstash:
        image: docker.elastic.co/logstash/logstash:6.3.2
        ports:
            - '25826:25826'
        volumes:
            - $PWD/elk-config:/elk-config
        command: logstash -f /elk-config/logstash.config
        depends_on:
            -  elasticsearch
Elasticsearch uses a mmapfs directory by default to store its indices. The default operating system limits on mmap counts is likely to be too low, which may result in out of memory exceptions.
On Linux, you can increase the limits by running the following command as root to allocate maximum memory:
sudo sysctl -w vm.max_map_count=262144Run docker-compose up to spin up all the containers of ELK.
Validate whether Kibana is up by hitting port 5601. You should see the below page:

Set up the index pattern in Kibana.
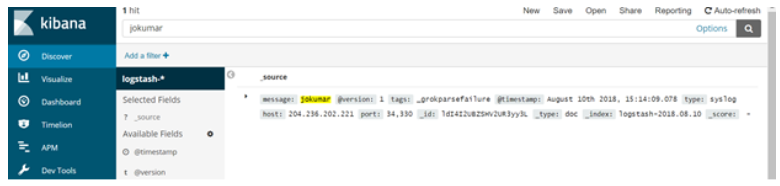
Run telnet [IP of logstash] [port of logstash] and enter any text (e.g. telnet 52.207.254.8 25826)
Once you can see the text in Kibana, that means the connectivity is set for ELK.
Next, we will see how we can push logs from microservices to ELK.
Set Up the Syslog Driver
In order to send the logs from the microservices hosted in EC2, we can use syslog driver to push the logs to Logstash. I am using this project for the logs. We will be running this project in EC2.
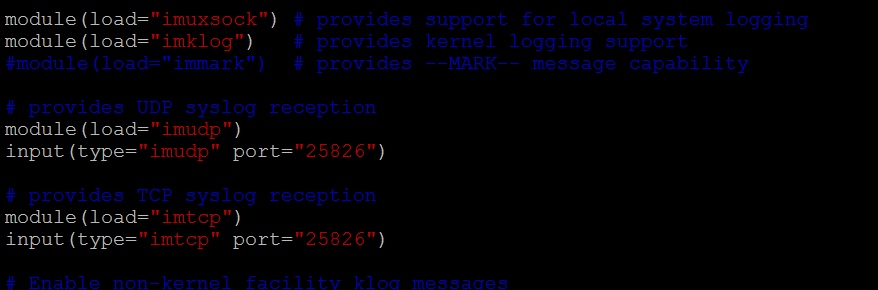
We need to make a change in rsyslog.conf present in the Ubuntu machine.
vi /etc/rsyslog.confUncomment the below lines:
Now add the below lines in logback.xml of the spring boot project:
<appender name=”SYSLOG” class=”ch.qos.logback.classic.net.SyslogAppender”>
	<syslogHost>{logstash host }</syslogHost>
	<port>{ logstash port 25826 }</port>
	<facility>LOCAL1</facility>
	<suffixPattern>[%thread] %logger %msg</suffixPattern>
</appender>
The above setup will push the logs to Logstash.
If the project is built using Docker, then we need to add the drivers with the docker run command:
–log-driver syslog –log-opt syslog-address=tcp://{logstashhost}:{logstashport}
On starting the server and hitting the API, you can see the logs in Kibana.
All the best!
Published at DZone with permission of Joydip Kumar. See the original article here.
Opinions expressed by DZone contributors are their own.
Comments