Descriptive Analysis With SAS
Different descriptive analysis techniques with SAS include PROC MEANS, PROC ANOVA, PROC FREQ, PROC UNIVARIATE, and PROC CORR.
Join the DZone community and get the full member experience.
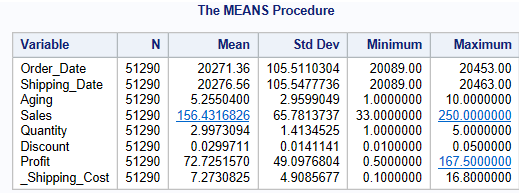
Join For FreePROC MEANS is one of the most common SAS procedures used for analyzing data. It is used to calculate descriptive statistics like the number of observations (N), mean, standard deviation, and max and min value.
proc means data = libref.ecommerce ;
run;
This code will compute descriptive statistics for all the numeric variables in the dataset.
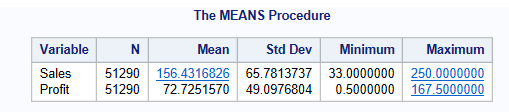
proc means data = libref.ecommerce ;
var Sales Profit;
run;
This code will compute descriptive statistics for two variables: Sales and Profit.
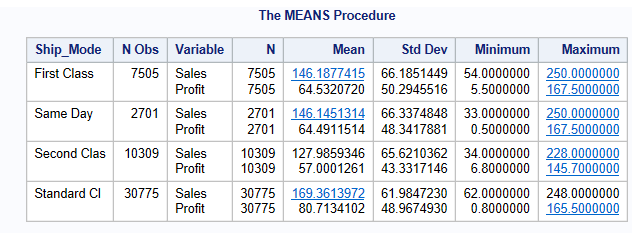
proc means data = libref.ecommerce ;
var Sales Profit;
class Ship_mode;
run;
It will also be grouped by Ship_mode.
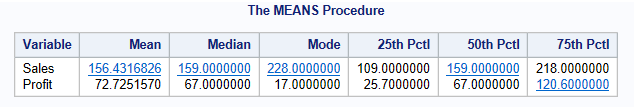
proc means data = libref.ecommerce Mean Median Mode P25 P50 P75;
var Sales Profit;
run;
By default, proc means will give you the number of observations (N), mean, standard deviation, and max and min value. If you want to compute the median percentiles, use the above code.
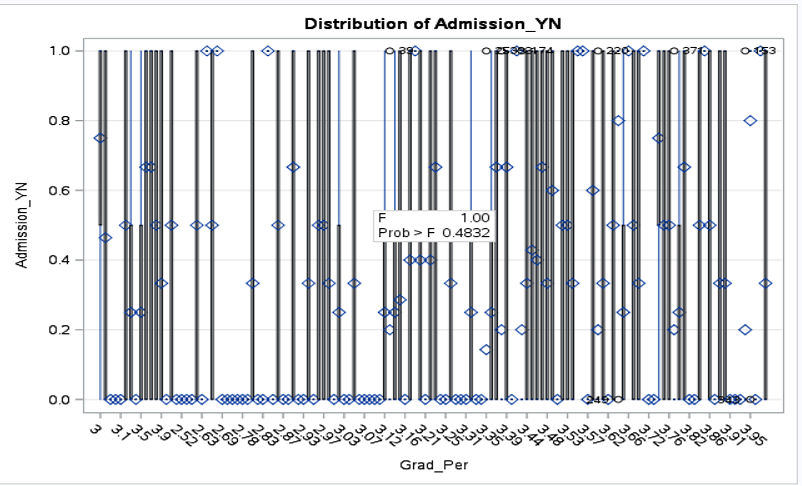
PROC ANOVA stands for Analysis of Variance. In the analysis of variance, a continuous response variable known as a dependent variable is measured under experimental conditions identified by classification variables known as independent variables.
Proc anova data=Libref.College;
Title 'Anova Analysis';
Class GRAD_PER;
Model Admission_YN = GRAD_PER;
Run;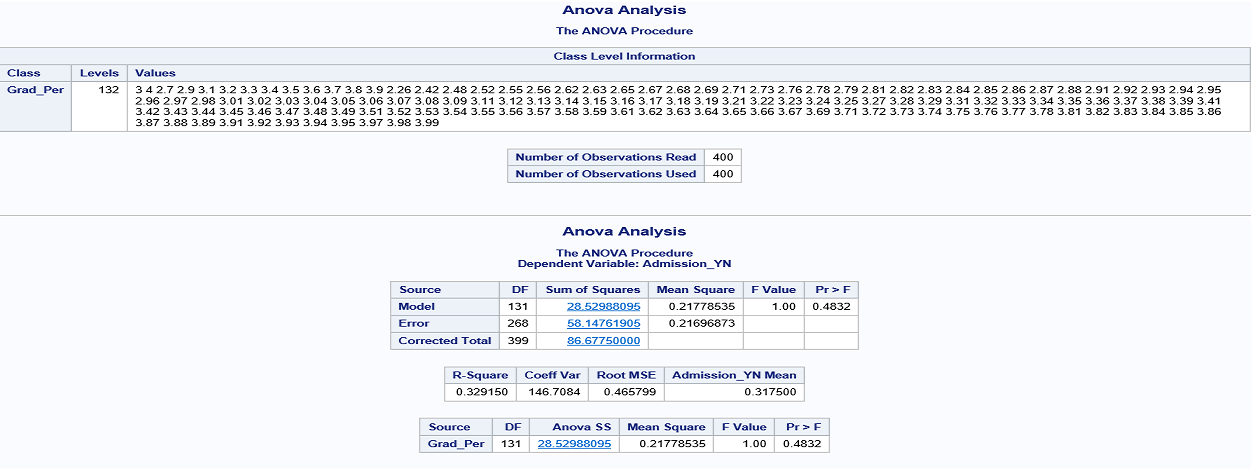
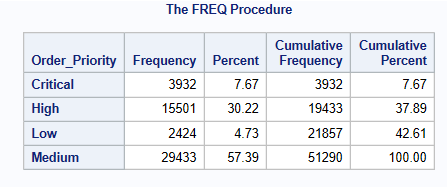
PROC FREQ prints all values of a given categorical variable in the Output window, along with the number and percentage of times each value appears. It can be used for both numeric as well as character variables.
proc freq data=libref.ecommerce;
tables order_priority;
run;
This code will calculate the number and percentage of time each value appears for the order_priority variable.
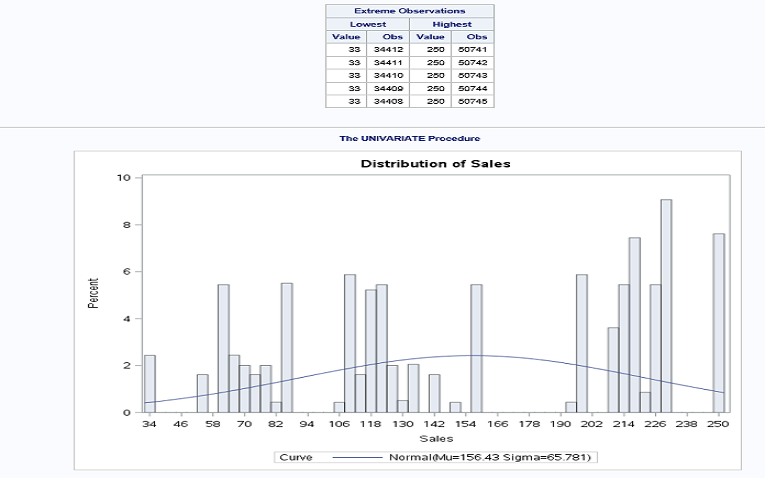
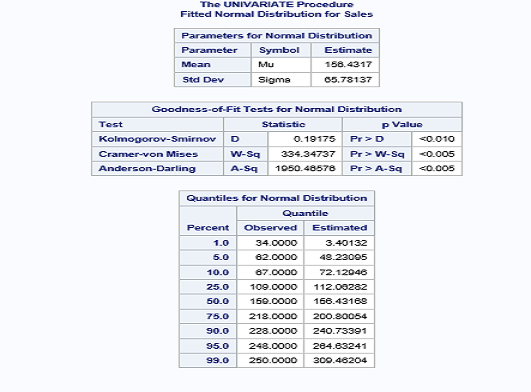
PROC UNIVARIATE computes descriptive statistics based on moments (including skewness and kurtosis), quartiles or percentiles (such as the median), frequency tables, and extreme values. It also provides statements for creating hostograms.
proc univariate data = libref.ecommerce;
var sales;
histogram sales/normal;
run;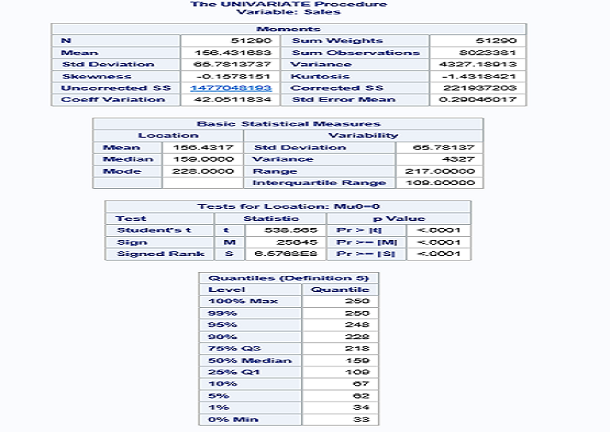
 PROC CORR computes Pearson correlation coefficients, three nonparametric measures of association, polyserial correlation coefficients, and the probabilities associated with these statistics.
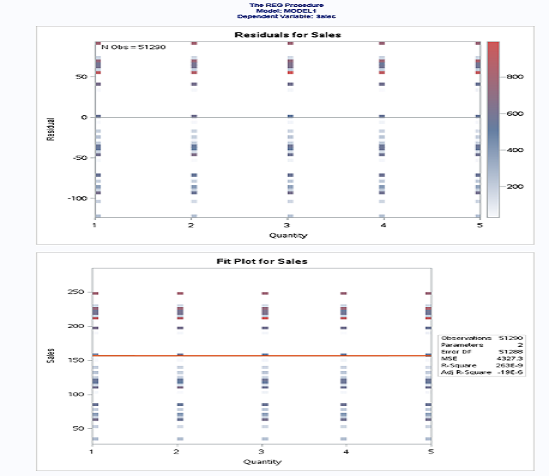
proc reg data = libref.ecommerce;
model sales=quantity;
run;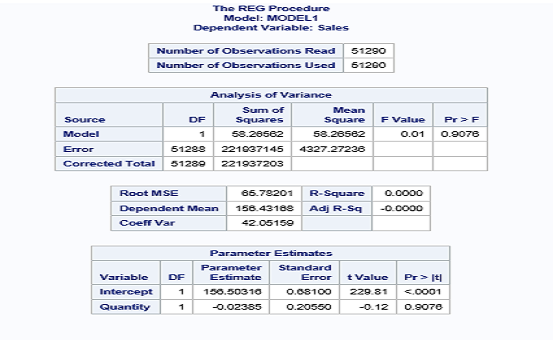
Now, you know different descriptive analysis techniques with SAS.
Opinions expressed by DZone contributors are their own.
Comments