DevOps KPI in Practice — Chapter 1 — Deployment Speed, Frequency, and Failure
This article discusses in detail the different deployment metrics in each DevOps KPI and how to collect and measure the data for effective deployment.
Join the DZone community and get the full member experience.
Join For FreeKey Performance Indicators are metrics widely used to know how good (or bad) are some practices, products, projects or even initiatives. Well-planned projects define KPIs that are collected from day zero and followed in all steps.
When a company starts a project with a focused goal, it’s necessary to measure how effective and if the steps to take the target are correctly done. With KPI we should get the facts about our decisions, supporting then and know how good is the rolling work.
Motivation
Every time I looked for DevOps KPIs, I found just the theory about them and nothing about how to collect metrics in practice. I decided to write this article and provide the practice part of DevOps KPI, i.e. how to implement the solution to collect, process, measure and show metrics.
Chapters
The “DevOps KPI in Practice” is split into nine chapters, totally devoted to showing the practice part of implementing the KPIs metrics.
- Chapter 1 — Deployment Speed, Frequency, and Failure: this part forms the base to know what, when and how to collect the metrics, defining the most meaningful KPI to follow, as well as an introduction and the high-level definition showing what we will learn and which KPIs we will measure. Here we start our saga with three KPIs related to deployment: Speed, Frequency, and Failures.
- Chapter 2 — Change Lead Time and Change Volume: how big is my change volume and how much time I take to push it to production.
- Chapter 3 — Mean Time To Detection and Mean Time Between Failures: how much time passed until a failure.
- Chapter 4 — Mean Time To Recovery: how much time I take to get up again.
- Chapter 5 — Change Failure Rate: what’s the relationship between new features and the failures in production.
- Chapter 6 — Efficiency: the efficiency in terms of development features.
- Chapter 7 — Performance: the performance of our running app - it’s so important.
- Chapter 8 — Pipeline Adoption: In this chapter, we will deep dive into details, get hands-on and learn in practice how to measure the KPI #12: Pipeline Adoption.
- Chapter 9 — Final: final thoughts and the notes about the experience acquired during these eight chapters.
For Example
When a toy company develops and launches a new product, they need to know how good are the sales. The KPI for this is how many orders they received to manufacture the new product, that can be called as Order Volume. But, for more concrete values they should use the number of invoices and name this as Invoice Volume.
With these numbers is easy to know the success: high numbers are good, because it means the acceptance of this new product. And low numbers are bad and decisions may take the place, supported by KPI.
Introduction
As a culture, a transformation, a mindset change, new tools, highly automated process and organizational changes, the DevOps initiative must have KPIs to measure its success because there are goals that must be reached and strategic decisions to take.
In this article, I will show up KPIs in practice, how to collect and process the metrics from the toolset that composes the DevOps pipeline, and how to use them to compute meaningful metrics. We will see explanations about all KPIs we will measure, detailing the meaning of each one, how to define the measurement factor, the definition the threshold for good metrics. Also, we will get examples of how to show the metrics using the graceful Grafana.
The KPIs
In the next sections, I will show to you the solution to collect, process and show the metrics for twelve different KPIs to measure the success of your DevOps initiative. For now, we will see what are the useful KPIs for DevOps context, how to take a reading over the numbers and what the correlation between it and how is it can be good or bad.
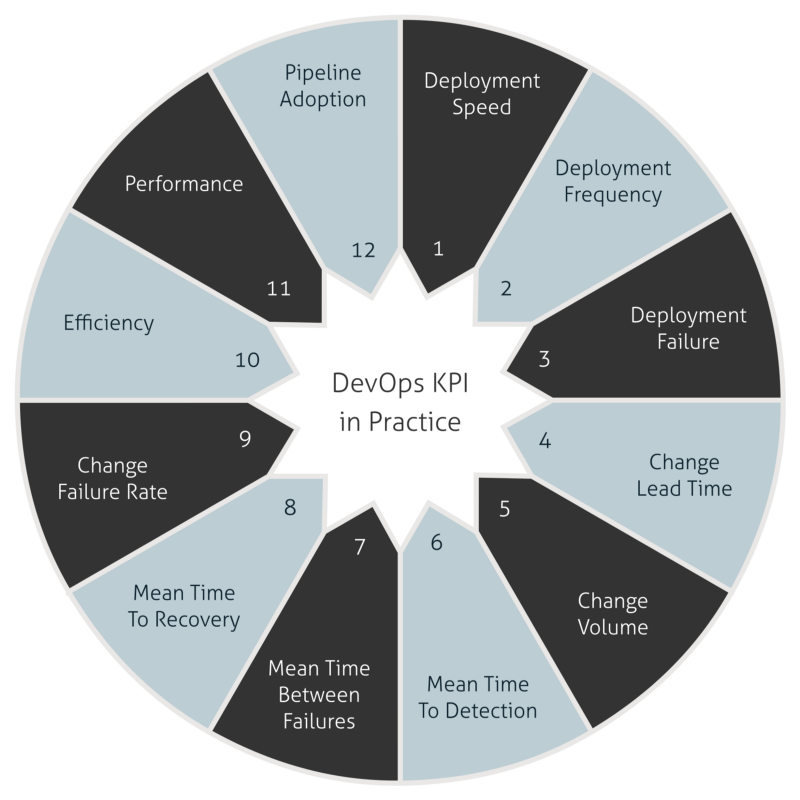
Let’s understand the KPIs covered by this series of articles:
- Deployment Speed: knows how speed is the deployments through the pipeline.
- Deployment Frequency: how many deployments happen in production.
- Deployment Failure: how many deployments are failing in production environment.
- Change Lead Time: the average time between developing a feature and to deploy it in production.
- Change Volume: total new user stories and new lines of code that are shipped in each deployment in production.
- Mean Time To Detection: the average time between a deployment and identify the very first failure in a production environment.
- Mean Time Between Failures: the average time between failures in production.
- Mean Time To Recovery: the average time between a crash down of environment and recovery in production.
- Change Failure Rate: the relation between changes and outages in production.
- Efficiency: the equivalence between touch time and wait time. These two metrics are related to time to develop a feature and time waiting until deploying it in production.
- Performance: this KPI shows the availability, response time and resource utilization of application in production.
- Pipeline Adoption: understand how is the adoption of each definition you made to become a user of the brand new DevOps pipeline.
Number 12 is a KPI that I observed it is useful to measure because it shows how the adoption is going and measures how many technical attributes are adopted in the Software Development Lifecycle — SDL.
From 1 to 11 are KPIs that we could found when googling for: “DevOps KPI,” “DevOps metrics,” or even “DevOps measurement.”
KPI in Practice
This is Chapter 1 of DevOps KPI in Practice and covers three KPIs related to deployment. Each of them intends to answer the following questions.
- Deployment Speed — How fast is my pipeline to deploy in production?
- Deployment Volume — What is my capacity to perform multiples deployments in a timeframe? (A day, for example).
- Deployment Failure — How accurate is my pipeline to deploy in production?
Now we start the hands-on, from here to end we will talk about the practice part. This section is divided into four main subsections: the solution, the ingestion, the metrics’ meaning for each KPI and the presentation of these metrics with Grafana.
The Solution
Naturally, our solution will growth throughout these nine chapters.

- Pushing the metrics: Jenkins collects and sends the metrics to InfluxDB.
- Joining the metrics: get metrics from two measurements and join them.
- Fetch/Put the latest timestamp: fetch or put the latest timestamp into the cache.
- Writing the joined metrics: write again the joined data into InfluxDB.
- Reading the metrics: Grafana reads and presents the metrics as KPIs.
- Accessing the metrics: the Users observes the KPIs and take decisions.
Jenkins acts as our metrics producer, pushing all collected data from every job execution to InfluxDB.
InfluxDB acts as our metric repository and query engine, receiving all metrics and making it available to be presented by Grafana.
Apache Nifi acts as our layer for the metrics normalization, transformation and in the next chapters, as metrics correlation.
Redis acts as our cache layer to store the latest metric timestamp to prevent double reads.
Grafana is our metric presentation tool, with rich graphics and a lot of possibilities to create dashboards to show our KPIs.
To run an example rapidly and see this solution in action, I created a Docker Compose declaring this stack of tools and shared at my GitHub account.
Clone it and have fun!
fabiojose/devops-kpi-chapter1devops-kpi-chapter1 - DevOps KPI in Practice - Chapter 1
You must have installed the following tools on your machine:
Make sure that these ports are free at your machine: 6001, 6002,6003 and 6004
Run the following commands to bootstrap our tool stack:
$ cd kpi-chapter-1
$ docker-compose up
This stack needs some finalizations. Complete the Jenkins installation and configuration, create jobs to produce metrics, and import the Grafana dashboards and Nifi templates.
The services are binding at the following address:
- Jenkins 2: http://localhost:6002
- InfluxDB API: http://localhost:6003
- Grafana 4: http://localhost:6001
- Apache Nifi 1.5.0: http://localhost:6004/nifi
The credentials for all services are the same:
username: admin
password: admin
The Metrics’ Meaning
Here we will learn the meaning of our metrics applied in each KPI, learning some thresholds, tendencies, and impacts. All KPIs are captured from deployments that have the production environment as the target, which means that the metrics from other environments are simply ignored.
Deployment Speed: every time Jenkins sends metrics, it has a field called build_time with the total time in milliseconds of the job execution. We apply the average over its value, filtering by time frame and take the speed.
- Threshold — 10m-rule: As a gold value, our pipeline execution does not exceed ten minutes rule for every execution. Of course, we can adapt this threshold for our company reality.
- Tendency — optimizing: at the beginning, our immature pipeline may be slow, but use the metrics details to identify the bottlenecks and to fix it.
- Impact —fast is good, but quality is better: have a high-speed execution is good, but never prioritize speed over quality. Review your thresholds and redefine it to reach better quality and security.
Deployment Frequency: every pipeline execution for production deployment ended with success counts one, i.e. for each metric’s push we are assuming that one deployment was made. We count the number of hits in a time frame to get the frequency.
- Threshold: there are no suggestions for this. As a rule of thumb the high values are good, but what is “high” will be defined by each DevOps initiative.
- Tendency: naturally, at the beginning, we will perform a few deployments in the time frame and will grow during the maturation of the initiative.
- Impact: with more automation, elimination of the monolith systems, and reducing the size of releases, we will increase the number of deployments in a time frame (a day, for example).
Deployment Failure: the metrics sent to InfluxDB has a field called build_successful, it’s type is boolean, when it is true the job execution was ended with success and when is false the execution ended with an error. Then, we count all metric entries ended with an error.
The Ingestion
The ingestion is active, i.e. the data is pushed to the repository by the data source, acting as an active-data-source. In this chapter Jenkins is our data source. To do this, we must to install the Jenkins InfluxDB Plugin and configure as follows.
To install the plugin, open the following menu.
- Manage Jenkins → Manage Plugins → Available → InfluxDB
After plugin installation, open the following menu.
- Manage Jenkins → Configure System → InfluxDB target

- Description: Default InfluxDB
- URL: the influxdb HTTP API
- Username: (the influxdb account username)
- Password: (the influxdb account password)
- Database: jenkins
- Retention Policy: autogen
- Expose Exceptions: marked
After that, we are able to push metrics to InfluxDB and to perform it we have two choices:
- Ordinary Jobs: do not allow customizations for fields and just it is available as a Post-build action.
- Pipeline Jobs: allows custom fields and we can push metrics from almost everywhere in our pipeline code.
I chose option number 2.
Below we have a Jenkinsfile fragment showing how to produce custom data and how to send them to InfluxDB target.
script {
  /* Custom data map for InfluxDB */
  def custom = [:]
  custom['branch']      = env.GIT_BRANCH
  custom['environment'] = target   /*Target environment: DEV | PRE | PRO*/
  custom['part']        = 'jenkins'
  custom['version']     = version  /*Package version*/

  /* Push metrics to InfluxDB, including all default and the custom data*/
  step([$class: 'InfluxDbPublisher', customData: custom, target: 'devops-kpi'])
}
The full working Jenkinsfile is available on GitHub; adapt it to your needs and use it as you want.
https://github.com/fabiojose/devops-kpi-chapter1/blob/master/Jenkinsfile
Apache Nifi
There are some issues to deal and they are related to the metrics ingestion from Jenkins to InfluxDB.
- Custom fields: when we use custom fields the plugin pushes these data in a separated measurement at InfluxDB. The ordinary data is sent to
jenkins_dataand the custom data is sent tojenkins_custom_data. - Tag fields: tag fields are used in where conditions at Grafana query. The plugin pushes just one tag field: the
project_name. But we need many others.
To solve then we introduce the Apache Nifi in the solution. Nifi is responsible for joining jenkins_data and jenkins_custom_data into the same measurement repository and creating new tag fields within InfluxDB. The key fields used in the joining are project_name and build_name, these fields never repeats in the same Jenkins master instance.
This approach is so important because made our presentation easy, and with simple queries, we can build graceful graphs in Grafana.

Let me explain how it works based on a high-level definition. But you can get the details by importing the flow template and read the comments in the processors details.
- Get the latest timestamp from cache and use it as filter to get dataset from InfluxDB, one to query
jenkins_dataand another to queryjenkins_custom_data. - Split the dataset in individual entries.
- Join the entries, one from
jenkins_dataand another fromjenkins_custom_data, based onproject_nameandbuild_number, creating a new single entry. - Add new tag keys to this new unique single.
- Post this single entry to InfluxDB in
devops_datameasurement. - End.
The template is available on my GitHub; clone it and have fun!
https://github.com/fabiojose/devops-kpi-chapter1/blob/master/devops-kpi_nifi-template.xml
Now we have the metrics joined and ready to present them as beautiful graphics and take our KPIs.
The Presentation
To present our KPIs, we are using Grafana, the best tool to show metrics, in my opinion. I have only good experiences with this tool and I hope you will, too.
With Grafana's features, we can reach the following results and should go beyond. It’ s possible to produce a dozen different layouts, and I propose one for Deployment Speed, Volume, and Failure. You can put all together or separate them like me.

To show the Deployment Speed, we have four metrics. Every metric selects data from devops_data measurement, where build_successful is equals to true and environment is equals to pro. You can see these details by editing the following singlestat panels.
The time frame in this context is Today.
- MAX in minutes: maximum execution time in the time frame.
- MIN in minutes: minimum execution time in the time frame.
- AVG in minutes: the average of execution time in the time frame.
- AVG in minutes (Last 1 week): the average of execution time in the last week.

The build_time is divided by 60000 to transform the mean of milliseconds in minutes.
A live demo version of Deployment Volume is available here.

Again the same selection criteria are applied to query the deployment volume metrics, except for the select that counts the number of deployments.
- Volume: the total count of deployments in the time frame.
- Volume (Last 1 week): the total count of deployments in the last week.
- Volume (Last 1 month): the total count of deployments in the last month.
- AVG per day (last 1 week): the average of deployments executions per day in the last week.
You can see a live demo of Deployment Volume here. It’s a snapshot, but it’s very nice to see because it uses Grafana 5 (so clever).

The queries for the Deployment Failure are similar that we’ve made before, except by build_successful that must be equals to false and the select that counts the number of deployments.
- Failures: the total count of deployment failures in the time frame.
- Failures (Last 1 week): the total count of deployment failures in the last week.
- Failures (Last 1 month): the total count of deployment failures in the last month.
- Failures - AVG per day (Last 1 week): the average of deployment failures that happened per day in the last week.

A live demo version of Deployment Failure is available here.
Don’t worry you can minimal details by importing the dashboards into the running. These dashboards are available here.
Final Words
I hope you got the practice idea behind KPI for DevOps and the importance of measurement to know how good (or bad) are the decisions that we made.
If you have some doubts or questions, come and post in the comments.
That’s it’s! Thank you for your reading! Leave some claps and I see you in the next chapters…
Published at DZone with permission of Fabio Jose Moraes. See the original article here.
Opinions expressed by DZone contributors are their own.
Comments