Diagnose CPU Spikes in a Non-Intrusive Manner
In this post, we are going to discuss a non-intrusive approach (i.e., approach that doesn’t add any noticeable overhead to the application) to diagnose CPU spike.
Join the DZone community and get the full member experience.
Join For FreeIn this post, we are going to discuss a non-intrusive approach (i.e., an approach that doesn’t add any noticeable overhead to the application) to diagnose CPU spikes. Thus, you can use this approach in your production environment to troubleshoot CPU spikes.
Works on all JVM languages:
This approach can be used to troubleshoot CPU spikes in all programming languages that run on Java Virtual Machine (JVM) like Java, Scala, Kotlin, JRuby, Jython, etc...
Step 1: Capture 360° Data
You can use the open-source yCrash data script to capture 360° data from your application stack. This script basically captures 16 different artifacts from your application stack (GC Log, thread dump, heap substitute, netstat, iostat...) and runs less than 30 seconds. Thus, it doesn’t add any measurable overhead to your application. You can trigger this script from any platform (all Linux flavors, Windows...) and any environment (bare metal, cloud, containers, k8…).
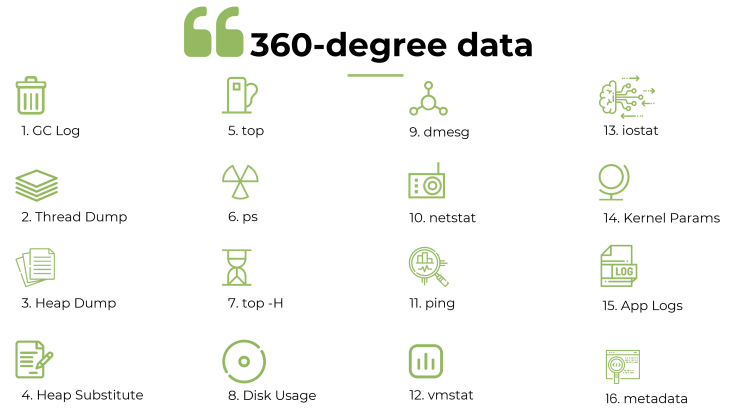
Fig: 360-degree data
Here are the steps to run this script:
1. Download the latest yc-data-script
2. Unzip the downloaded yc-agent-latest.zip file. (Say you are unzipping in ‘/opt/workspace/yc-agent-latest’ folder)
3. In the unzipped folder, you will find yc-data-script by operating system:
a) linux/yc – If you are running on Unix/Linux, then use this script.
b) windows/yc.exe – If you are running on Windows, then use this script.
c) mac/yc – If you are running on MAC, then use this script.
4. You can execute the yc script by issuing the following command:
./yc -j {JAVA_HOME} -onlyCapture -p {PID}Where, JAVA_HOME is the home directory where JDK is installed, and PID is the target JVM’s process ID.
Example:
./yc -j /usr/java/jdk1.8.0_141 -onlyCapture -p 15326When you pass the above arguments, yc-data-script will capture all the application-level and system-level artifacts/logs from your application stack for analysis. Captured artifacts will be compressed into a zip file and stored in the current directory where the above command was executed. The zip file will have the name in the format: ‘yc-YYYY-MM-DDTHH-mm-ss.zip‘. Example: ‘yc-2021-03-06T14-02-42.zip‘.
2. Analyze Captured Data
Once you have captured the data, you can analyze them using the yCrash server. You can upload the captured zip file to the yCrash server for analysis. The yCrash server analyzes all the captured data and generates one unified root cause analysis report instantly. Note: There is a free tier in the yCrash application, which you can use for CPU diagnosis purposes. In the yCrash incident report, you will see a ‘CPU consumption by thread’ section under the ‘Thread’ report (as shown below):
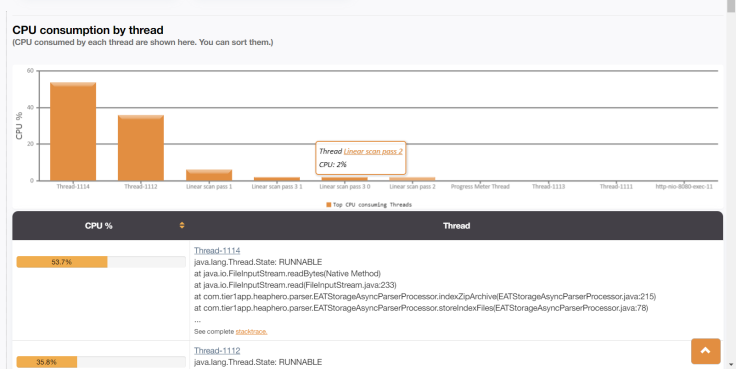
Fig: CPU consumption by threads reported by yCrash
This section will show all the CPU-consuming threads and the exact lines of code they are working on. Equipped with this information, you can spot the ‘black sheep’ lines of code that are causing the CPU to spike up.
How Does It Work?
‘Thread dump’ and ‘top -H -p {PROCESS_ID}’ are the two artifacts that yCrash data script captures. Here ‘top -H -p {PROCESS_ID}’ command shows the list of thread Ids and the amount of CPU and memory it consumes within the specified PROCESS_ID. ‘Thread dump’ shows the code path in which threads are executing. yCrash tool marries these two data and produces the above report. For more details, refer to this post.
I hope this approach will help you to isolate CPU-consuming lines of code effectively. Happy Troubleshooting!!
Published at DZone with permission of Ram Lakshmanan. See the original article here.
Opinions expressed by DZone contributors are their own.
Comments