Displaying ASP.NET Core Health Checks With Grafana and InfluxDB
A guide to displaying ASP.NET Core health checks.
Join the DZone community and get the full member experience.
Join For Free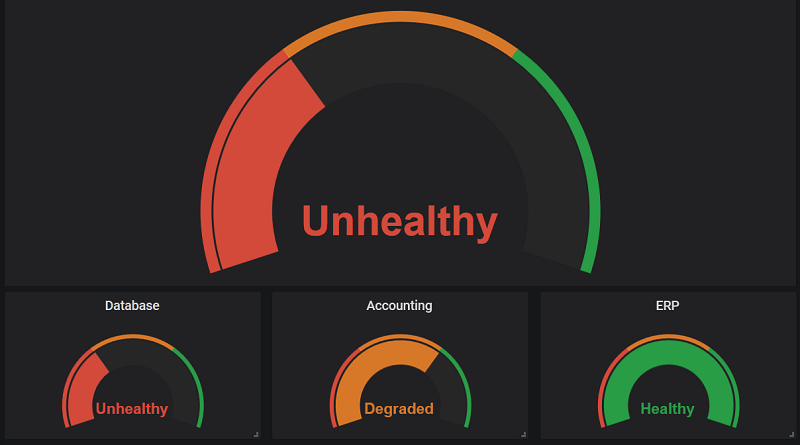
After finishing my writing about ASP.NET Core health checks I started finding a way how to visual health check results so I can display these on the wall-mounted TV or big screen. This blog post introduces how to visualize ASP.NET Core health checks with Grafana and InfluxDB.
About TIG-Stack
Visualizing side of systems monitoring can be done using open-source TIG-stack:
- Telegraf – a data collector, reports to Influxdb
- InfluxDB – time-series database, easy to use and integrate
- Grafana – web-based reporting solution, reads data from Influxdb
I installed these tools to one of my test machines and created a simple dashboard to show metrics of the same box. It’s good to plan a few hours of time to get everything running and to build some dashboards and see how things work.

Grafana supports also automatic refreshing of dashboards and those who need more widgets or ready-made reports can download these from Grafana site.
What We Are Building
Our goal is to build a web application that outputs granular health statuses and data collector application that reports these statuses to InfluxDB for Grafana.

Telegraf is here to collect other metrics like CPU, memory and disk space. I don’t stop on these metrics in this post.
Preparing Health Checks
For this writing, I will use a ping-based health check from my blog post Avoiding ping flood in ASP.NET Core health checks.
public class PingHealthCheck : IHealthCheck
{
    private string _host;
    private int _timeout;
    private int _pingInterval;
    private DateTime _lastPingTime = DateTime.MinValue;
    private HealthCheckResult _lastPingResult = HealthCheckResult.Healthy();
    private object _locker = new object();


    public PingHealthCheck(string host, int timeout, int pingInterval = 0)
    {
        _host = host;
        _timeout = timeout;
        _pingInterval = pingInterval;
    }

    private bool IsCacheExpired()
    {
            return (_pingInterval == 0 || _lastPingTime.AddSeconds(_pingInterval) <= DateTime.Now);
    }

    public async Task<HealthCheckResult> CheckHealthAsync(HealthCheckContext context, CancellationToken cancellationToken = default)
    {
        if(!IsCacheExpired())
        {
            return await Task.FromResult(_lastPingResult);
        }

        if(Monitor.TryEnter(_locker))
        {
            try
            {
                if (IsCacheExpired())
                {
                    PingService();
                }
            }
            finally
            {
                Monitor.Exit(_locker);
            }
        }

        return await Task.FromResult(_lastPingResult);
    }

    private void PingService()
    {
        try
        {
            using (var ping = new Ping())
            {
                _lastPingTime = DateTime.Now;

                var reply = ping.Send(_host, _timeout);

                if (reply.Status != IPStatus.Success)
                {
                    _lastPingResult = HealthCheckResult.Unhealthy();
                }
                else if (reply.RoundtripTime >= _timeout)
                {
                    _lastPingResult = HealthCheckResult.Degraded();
                }
                else
                {
                    _lastPingResult = HealthCheckResult.Healthy();
                }
            }
        }
        catch
        {
            _lastPingResult = HealthCheckResult.Unhealthy();
        }
    }
}
We can use this health check for multiple external services that we want to ping to make sure the machine is alive.
To format output I used the trick introduced by Dejan Stojanovic in his blog post Adding healthchecks just got a lot easier in ASP.NET Core 2.2.
public void Configure(IApplicationBuilder app, IWebHostEnvironment env)
{
    // ...

    var options = new HealthCheckOptions();
    options.ResponseWriter = async (c, r) => {

        c.Response.ContentType = "application/json";

        var result = JsonConvert.SerializeObject(new
        {
            status = r.Status.ToString(),
            errors = r.Entries.Select(e => new { key = e.Key, value = e.Value.Status.ToString() })
        });

        await c.Response.WriteAsync(result);
    };

    app.UseHealthChecks("/hc", options);

    // ...
}
This trick gave me the following ping check output.
{
  "status": "Healthy",
  "errors": [
    {
      "key": "ping1",
      "value": "Healthy"
    },
    {
      "key": "ping2",
      "value": "Healthy"
    }
  ]
}
Formatting Health Checks for Reporting
To report health checks to InfluxDB I found it to be easier if I output results as a JSON array. Grafana loves numbers and instead of names of health status, I went with integer values from HealthStatus enum.
public enum HealthStatus
{
  //
  // Summary:
  //     Indicates that the health check determined that the component was unhealthy,
  //     or an unhandled exception was thrown while executing the health check.
  Unhealthy = 0,
  //
  // Summary:
  //     Indicates that the health check determined that the component was in a degraded
  //     state.
  Degraded = 1,
  //
  // Summary:
  //     Indicates that the health check determined that the component was healthy.
  Healthy = 2
}
I created a DTO class for array elements as shown here.
public class ServiceStatus
{
  public string Service { get; set; }
  public int Status { get; set; }}
Health checks are set up and configured in the Startup class as shown here.
public void ConfigureServices(IServiceCollection services)
{
    services.AddHealthChecks()
            .AddCheck("ERP", new PingHealthCheck("www.google.com", 100))
            .AddCheck("Accounting", new PingHealthCheck("www.bing.com", 10))
            .AddCheck("Database", new PingHealthCheck("www.__Dbing1.com", 100));

    services.AddControllersWithViews();
    services.AddRazorPages();

    services.AddSingleton<IAlertService, EmailAlertService>();
    services.AddScoped<IAlertService, SmsAlertService>();
}

public void Configure(IApplicationBuilder app, IWebHostEnvironment env)
{
    if (env.IsDevelopment())
    {
        app.UseDeveloperExceptionPage();
    }
    else
    {
        app.UseExceptionHandler("/Home/Error");
    }

    var options = new HealthCheckOptions();
    options.ResponseWriter = async (c, r) => {

        c.Response.ContentType = "application/json";
        var result = new List<ServiceStatus>();
        result.Add(new ServiceStatus { Service = "OverAll", Status = (int)r.Status });
        result.AddRange(r.Entries.Select(e => new ServiceStatus { Service = e.Key, Status = (int)e.Value.Status }));

        var json = JsonConvert.SerializeObject(result);

        await c.Response.WriteAsync(json);
    };

    app.UseHealthChecks("/hc", options);
    app.UseStaticFiles();
    app.UseRouting();
    app.UseAuthorization();

    app.UseEndpoints(endpoints =>
    {
        endpoints.MapControllerRoute(
            name: "default",
            pattern: "{controller=Home}/{action=Index}/{id?}");
        endpoints.MapRazorPages();
    });
}
Take a look at how ResponseWriter is defined for HealthCheckOptions. I will create a list of ServiceStatus first. The first row in the list is the overall health status of the system. Next rows are statuses returned by individual health checks. In the end, I serialize this list to JSON and write to the response stream. Here’s the result.
[
  {
    "Service": "OverAll",
    "Status": 0
  },
  {
    "Service": "ERP",
    "Status": 2
  },
  {
    "Service": "Accounting",
    "Status": 2
  },
  {
    "Service": "Database",
    "Status": 0
  }
]
With this work done we can start working on the data collector.
Sending Health Checks to InfluxDB
As I’m too noobie for TIG-stack and I don’t know much about the internals of Telegraf I decided to write simple data collector on C#. I can run with Windows Task Scheduler by example. Also reporting data to Influxdb is easy. It’s just a simple HTTP POST-request with simple formatted data.
class Program
{
    private const string HealthCheckUrl = "http://localhost:52494/hc";
    private const string InfluxdbWriteUrl = "http://192.168.10.117:8086/write?db=telegraf";
    private const string WebHostName = "gpf1";

    private class HealthCheckResult
    {
        public string Service { get; set; }
        public int Status { get; set; }
    }

    static async Task Main(string[] args)
    {
        var statuses = await GetHealthStatus();

        await PostToInfluxDb(statuses);
    }

    private static async Task<List<HealthCheckResult>> GetHealthStatus()
    {
        using (var client = new HttpClient())
        {
            var response = await client.GetAsync(HealthCheckUrl);
            var json = await response.Content.ReadAsStringAsync();

            return JsonConvert.DeserializeObject<List<HealthCheckResult>>(json);
        }
    }

    private static async Task PostToInfluxDb(List<HealthCheckResult> statuses)
    {
        foreach (var status in statuses)
        {
            var body = $"health,host={WebHostName},service={status.Service} value={status.Status}";

            using (var content = new StringContent(body))
            using (var client = new HttpClient())
            {
                var response = await client.PostAsync(InfluxdbWriteUrl, content);
            }
        }
    }
}
It would be polite to read settings from the configuration file but let’s keep things simple until everything works as expected.
Building Health Checks Dashboard
As health checks data is running to InfluxDB from our small data collector it’s time to build a dashboard on Grafana. This is how my demo dashboard looks like.

Singlestat panel on top shows the overall health status of the system. Smaller ones below show the health status of their specific components or services. This way it is easy to see which external dependencies or components are actually problematic or failing.
For every singlestat panel, we have to configure metrics, options and value mappings. I will show on screenshots the configuration for overall health status. Configuring other panels is similar — just change the service name.
At the metrics tab, we must define a query that provides us with data. We have to specify OverAll as service and in my case gpf1 as host.

Options are more tricky. I reverted coloring so green is at the end of the scale. To show slices of values on graph filled like on the screenshot above I defined graph range from –1 to 2 and assigned 0.001 and 1.001 as thresholds.

Value mappings let us use other values instead of ones that come in with query. Remember that our health statuses come in as integer values. On graph, we want to show status names instead of numbers.

After saving singlestat panels and dashboard hit click on the Refresh icon to refresh the dashboard. It’s possible to make the dashboard automatically refresh itself and dashboard like this can be shown on big screens on the wall.
Wrapping Up
It’s not hard to get ASP.NET Core health checks data to the Grafana dashboard. Instead of Telegraf, we built our own small data collector between ASP.NET Core web application and InfluxDB. It was easy on Grafana to build the dashboard for health checks and make it look nice by configuring a few settings. Now we have a nice dashboard of health checks to show on the office wall.
Published at DZone with permission of Gunnar Peipman. See the original article here.
Opinions expressed by DZone contributors are their own.
Comments