Distributed Tracing for Microservices on Elastic (ELK Stack)
Let's explore distributed tracing for microservices on the ELK stack.
Join the DZone community and get the full member experience.
Join For FreeIn this fast-moving world, businesses need to be nimble and be able to deliver changes to their customers faster than ever before. To keep up with that, software systems and teams should find ways to build things faster and deploy quicker. Enter microservices!
Microservices
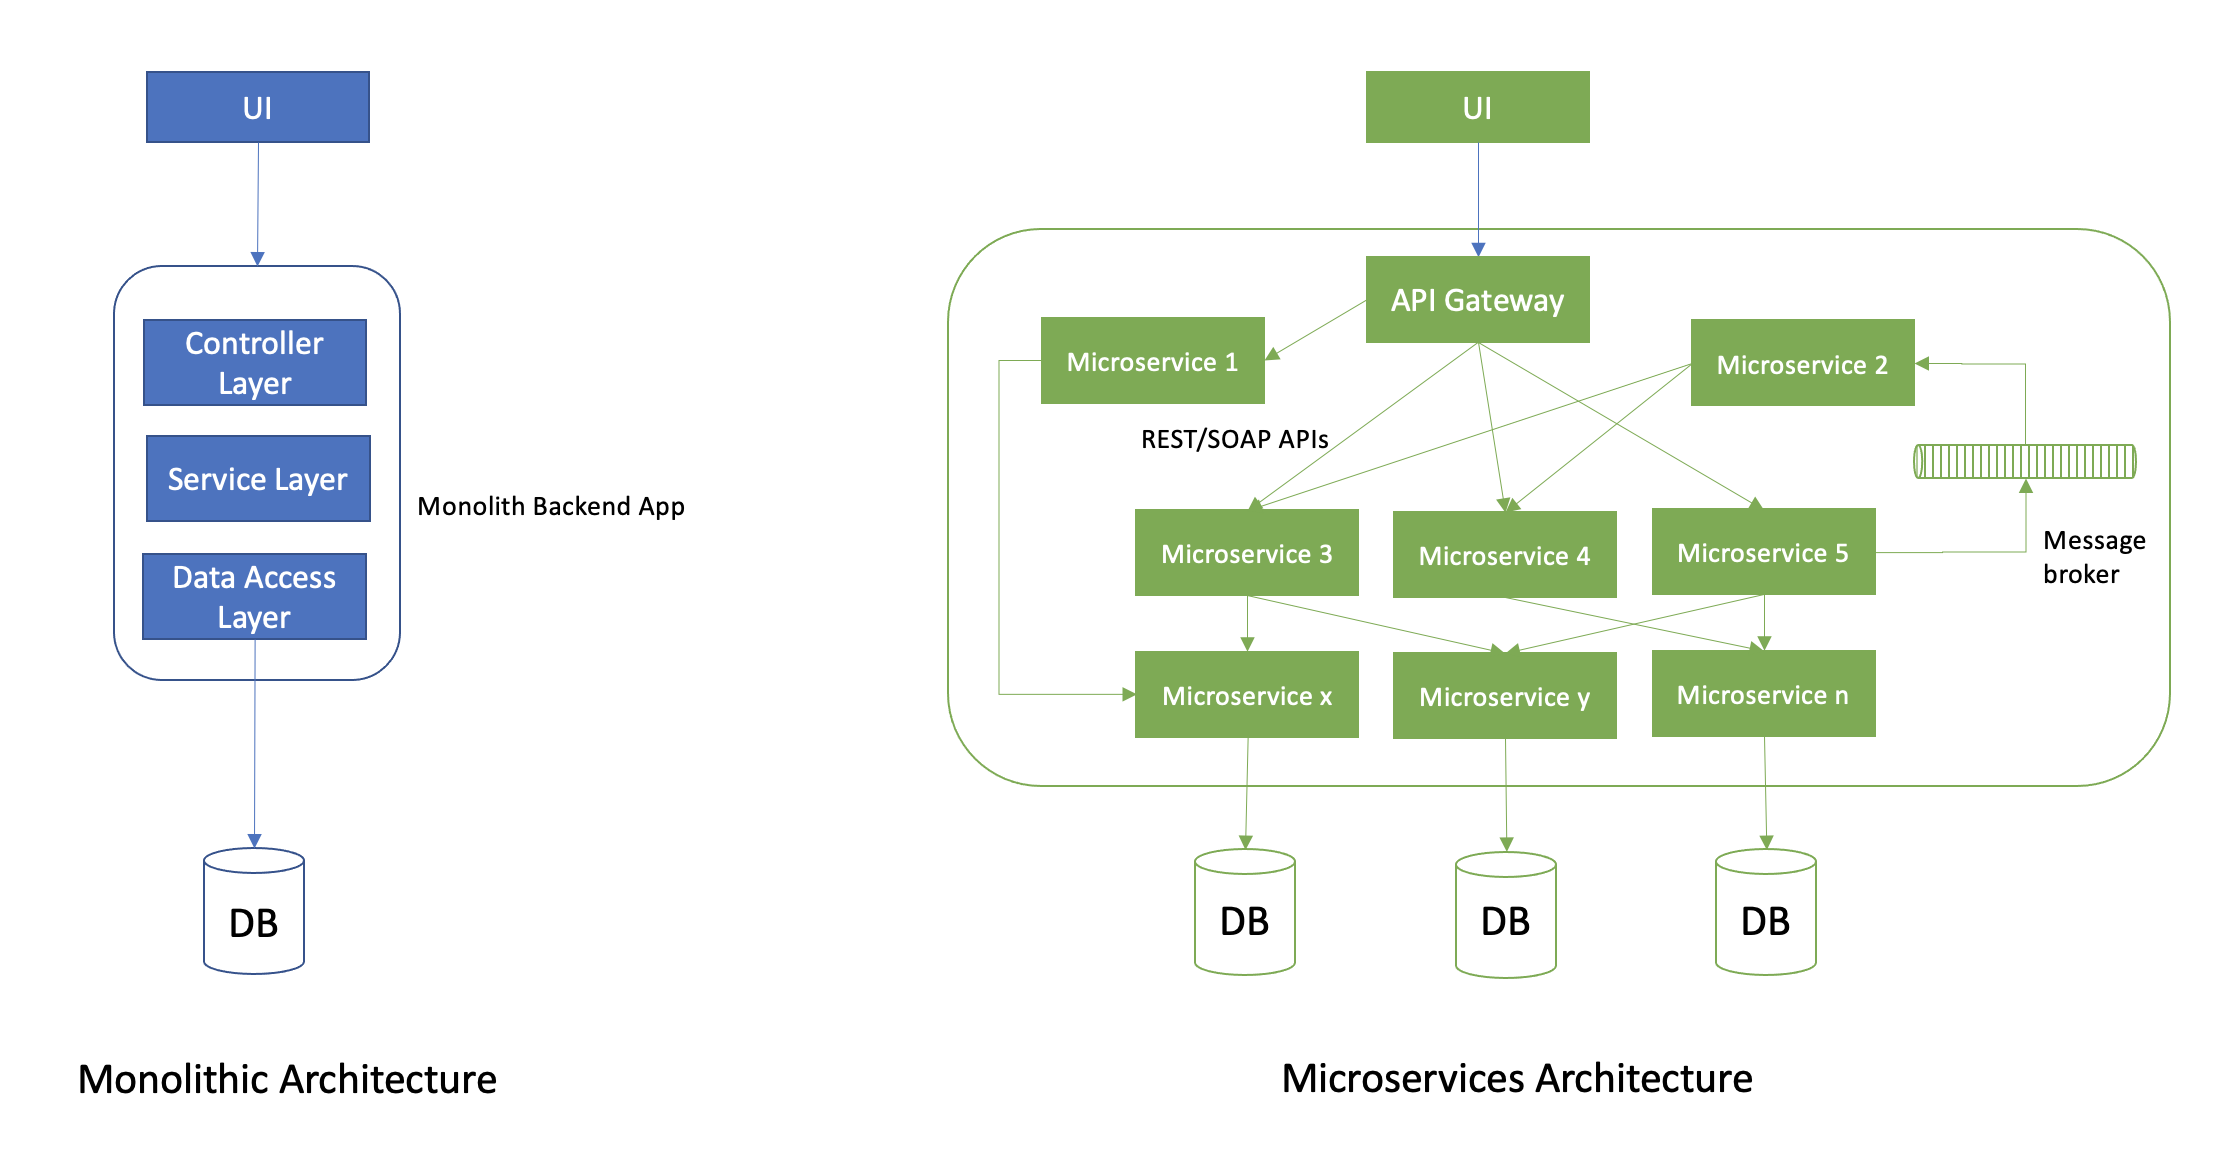
Microservices architecture is the modern way distributed systems are built that addresses most of these needs. Microservices are a set of small, loosely coupled, independent services that have a single responsibility. Software applications in this architecture are built as a set of services that communicate over standard protocols such as HTTP (REST/SOAP APIs), message brokers (Kafka, RabbitMQ), and so on. This architecture has tons of benefits: Being "small" makes them quicker to build and deploy; being "loosely coupled" makes them platform and technology agnostic and independently scalable. This also allows for smaller two-pizza teams to own and manage their own set of services without overlaps or a need for bigger teams.

Disadvantages of Microservices
Microservices come with their own issues, too. Some of the most commonly called out disadvantages are the complex dependencies between services, integration testing services being more difficult and needing more stubbing, the number of hops a request has to go through for the final response could go very high, the complexity in handling atomic transactions across services, and so on.
But the one we are going to talk about here is the challenge with debugging a request that spans multiple services. It is not uncommon for a software system to have tens (even hundreds) of microservices, and usually most requests to the application span more than two services before a response is sent to the client. In traditional monoliths, if a request fails or has performance bottlenecks, we know where to look for problems — the single monolith backend application! With microservices, it is hard to locate the service where the issue is. If a request goes through n different services, some over HTTP and some asynchronously through message brokers, it is a nightmare to debug.
Distributed Tracing
Distributed tracing is one of the three pillars of observability — logs and metrics being the other two. Distributed tracing is the method of observing a request as it propagates through different services, revealing how each of them are behaving — showing failures, time taken at each step, and so on. OpenTelemetry defines distributed tracing as follows:
A Distributed Trace, more commonly known as a Trace, records the paths taken by requests (made by an application or end-user) take as they propagate through multi-service architectures, like microservice and serverless applications.
Tracing Concepts
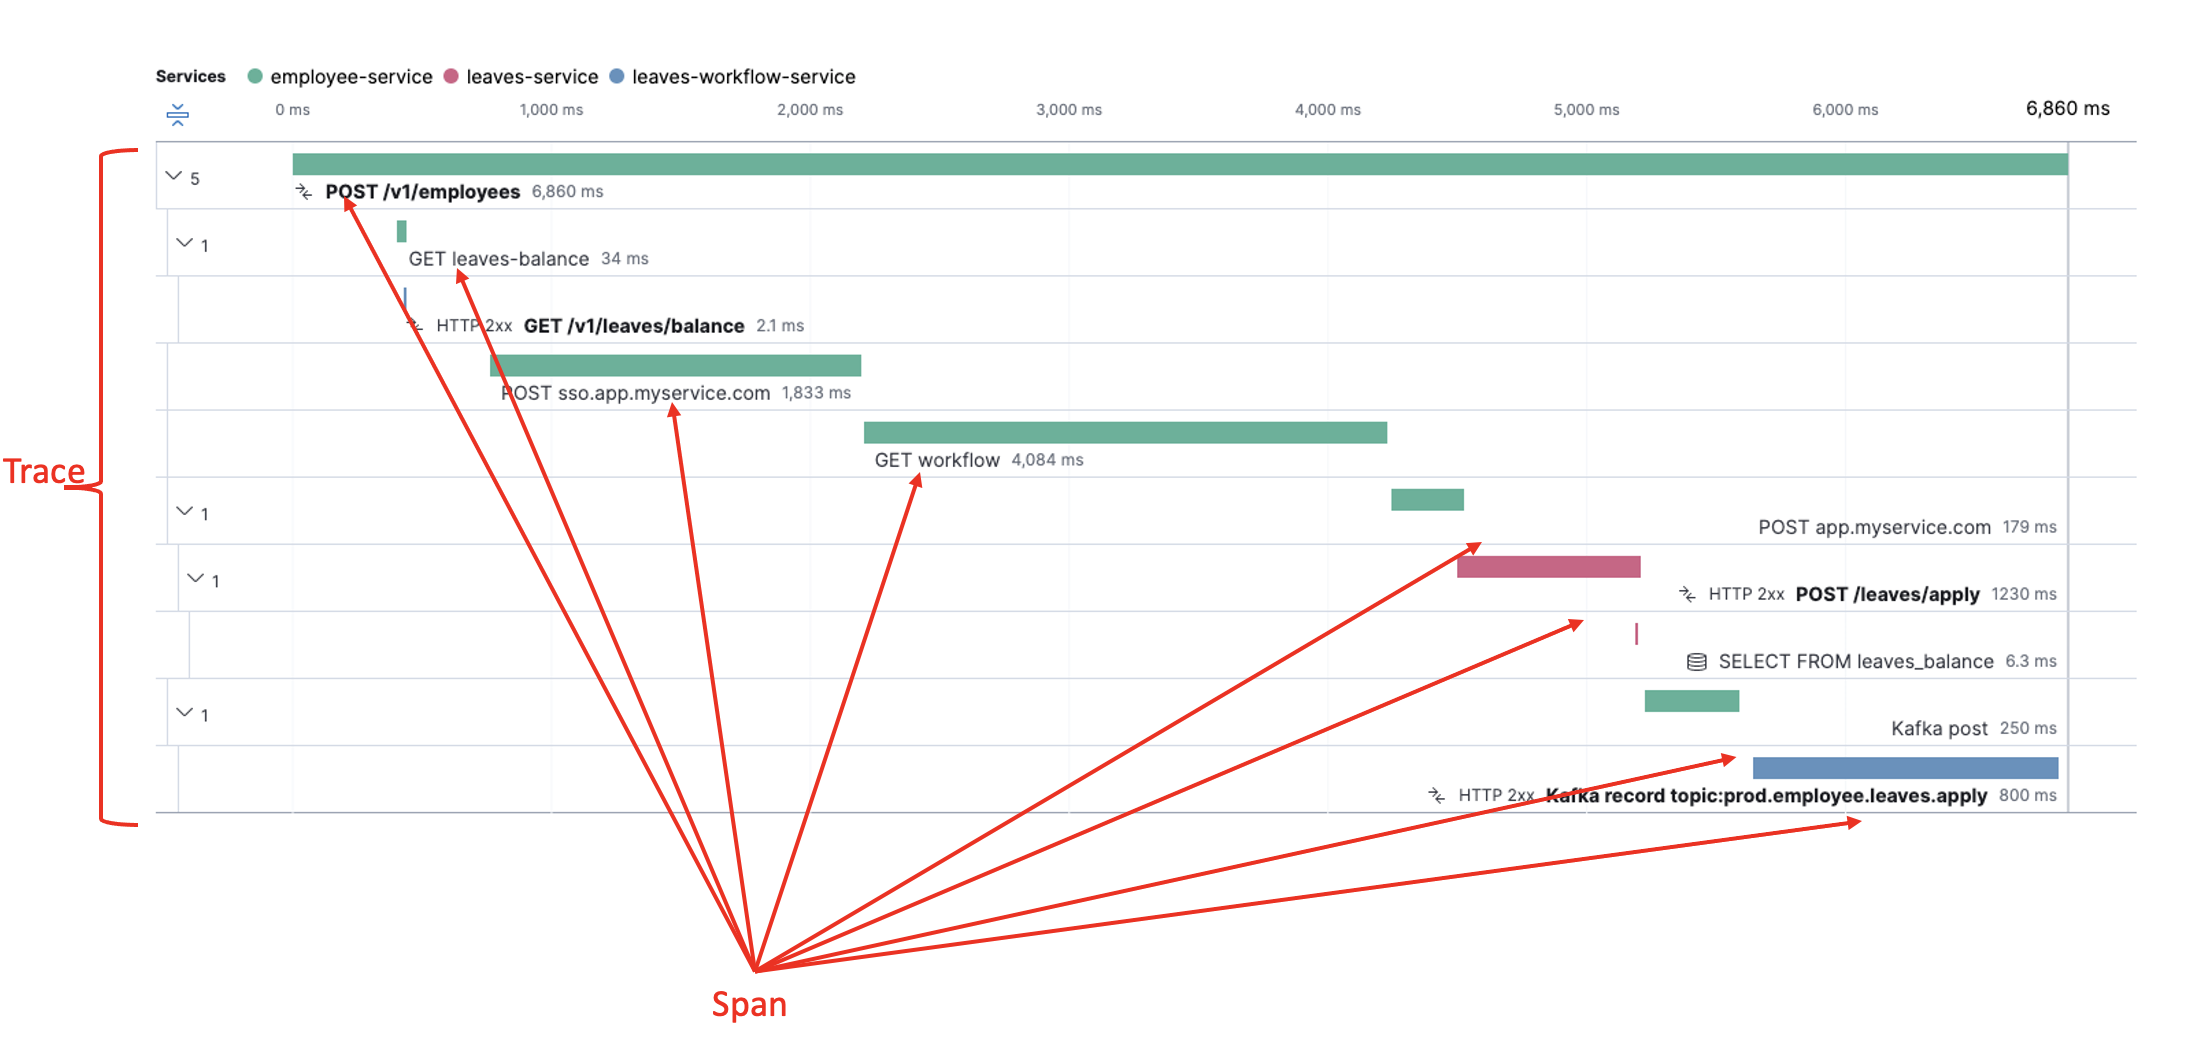
Trace: The end-to-end view of a request as it goes through various services. Traces are made of spans.
Span: An individual unit of work done within a single service. Primary building block of a trace. Has associated metadata such as time intervals.
Tags: Tags are user or tracing system defined key-value pairs that enrich spans for query, filter, and understand trace data.
Trace Logs: Logs produced by services as the request is handled for this specific trace. This association provides more contextual data for better debugging.

The above diagram shows a request being traced across three different services. The request goes to employee-service first, which after some operations on its own, calls leaves-service over HTTP, and finally places the request in a Kafka topic, which is consumed by the leaves-workflow-service.
How Distributed Tracing Works
- Each service that receives the request (including the first one, since it may not know it is the first), and checks if there is a
trace_idassociated (typically in request headers).- If not present (if this is the first service), the service starts a new trace, sets a unique
trace_id, and sets it.
- If not present (if this is the first service), the service starts a new trace, sets a unique
- The service then builds spans under the trace, starts, and finishes them within required code boundaries. Each service can create multiple spans each of which will be shown in the tracing dashboard under that service
- The service can also set Trace Tags for contextual information (such as IDs) which will get propagated through the request and can be used for querying, filtering, and searching later.
- The tracing library (such as Jaeger) automatically captures timestamps for start and finish of spans and the trace.
- The entire trace is captured under the
trace_idalong with associated spans, its metadata, and tags. Any errors thrown during the trace are also captured under the trace. - Once the trace completes, the information is sent to a server and visualized on a dashboard.
Implementing Distributed Tracing Manually
All of the above can be implemented manually using libraries such as Jaeger and visualized in Jaeger dashboard. This tutorial shows how to instrument and set up a Java service for distributed tracing using Jaeger. Manual instrumentation like this is cumbersome and error-prone for the following reasons:
- Every access point through which request can be received (APIs, message consumers, scheduled jobs, and so on) need to be manually edited for tracing — it's easy to miss a few.
- This needs to be done for every service, and your services could all be written in different languages.
- The concept is not very easy, and making every (new) developer understand and follow this can be difficult.
If you are like me, you would want an easier solution.
Elastic APM
Elastic APM is an application performance monitoring tool that is built on top of Elastic Search and Kibana, the E and the K of the ELK stack. Implementing Elastic APM is super easy — all you need to do is add the agent jar to your service and set some basic properties. This is done once per service, and that enables distributed tracing for all requests of that service.
The following features are available out of the box after instrumentation:
- Distributed tracing for instrumented services — incoming and outgoing HTTP calls, DB requests, Cache hits, scheduled job executions such as Quartz, message broker communications, and so on — all visualized in the APM dashboard in Kibana.
- Automatic capturing of errors and exceptions that are thrown by the services (unhandled). Elastic also groups the errors for detailed analysis.
- Linking logs and traces to provide more contextual information for every captured trace.
- Basic metrics including host metrics, (CPU, memory, container metrics, and so on), agent specific metrics (JVM metrics for Java apps).
Implementing Elastic APM
In this section, I am going to explain how to set up the APM agent for a Java service. Elastic APM is supported for multiple languages.
Pre-requisites
- Service(s) that is/are built on one of the Elastic APM supported technologies listed here.
- A running instance of Elastic Stack (Elastic Search, Kibana). This could be a self-hosted ELK instance or an Elastic Cloud account, a SaaS offering by Elastic.
Step 1: Add elastic agent dependency in the pom.xml
<dependency>
	<groupId>co.elastic.apm</groupId>
	<artifactId>apm-agent-attach</artifactId>
	<version>${elastic-version}</version> <!--version should be compatible with your elastic instance-->
</dependency>
Step 2: Set up properties for APM agent
Properties can be set in one of the following ways:
elasticapm.propertiesinclasspath- Java System properties
- Environment variables
The property names will vary depending on how it is set. For example to enable/disable recording, the property would be recording (in elasticapm.properties), elastic.apm.recording (in Java System Properties) and ELASTIC_APM_RECORDING (in env variables)
Following are the properties that would be needed to get going:
## minimum needed
recording=true
server_urls=<your-elastic-server-url>
service_name=<your-service-name>
environment=prod/dev/test/stage

secret.token=###############
Note: Though the secret token used by agent to access Elastic server can be passed through properties, it is highly recommended to pass that as a env variable through secret storage such as Kubernetes Secrets.
The properties here are what's needed at the minimum to run the APM agent. For a full list of properties, refer to Elastic APM Agent Configuration documentation.
Step 3: Attach the agent on app startup
@SpringBootApplication
public class MyApplication {
	public static void main(String[] args) {
      try {
			ElasticApmAttacher.attach();
		} catch (IllegalStateException e) {
			log.error("Error attaching Elastic APM", e);
		}
		SpringApplication.run(MyApplication.class, args);
	}
}
That's it! Repeat the steps for all your microservices, deploy them, and start seeing the magic on the Kibana APM dashboard!
Additional Tips
Linking Logs and Traces
If you are sending your logs to the ELK stack, you can link logs and traces by adding a single property to the elasticapm.properties. This will link logs and traces and provide logs specific to a trace in APM view in Kibana.
enable_log_correlation: "true" ##set to true by default in versions > 1.30JSON Logging
If your services log plain text messages and you would like to have structured Elastic compliant JSON logging, set the following property:
log_elastic_reformatting=OVERRIDECircuit Breaker
Elastic APM agent is lightweight and will not have any noticeable impact on the performance of your application. However, this property will let Elastic know that if the system metrics reach certain limits, the APM recording should be stopped (and restarted when it goes below the limits).
circuit_breaker_enabled=true

stress_monitoring_interval=1 ##seconds
stress_monitor_gc_stress_threshold=0.95
stress_monitor_gc_relief_threshold=0.75
stress_monitor_system_cpu_stress_threshold=0.95
stress_monitor_system_cpu_refief_threshold=0.75Opinions expressed by DZone contributors are their own.

Comments