Dive into your JVM with New Relic
Join the DZone community and get the full member experience.
Join For Freeif you’ve been looking for deeper insight into your jvm and application server, we’ve got some good news for you. the latest release of the new relic java agent includes an increase in the amount of data we collect on your java applications and these new metrics can be used to solve a multitude of performance problems.
the new metrics are located under the jvm tab and include the following:
* loaded and unloaded class count for the jvm
* active thread count for the jvm
* active and idle thread count for each thread pool
* the ratio of active to maximum thread count for each thread pool
* active, expired and rejected http session counts per application
* active, finished and created transaction counts per application server
now let’s take a closer look at each of them:
loaded & unloaded class count
location: under the memory tab in the bottom-right corner of the screen.
supported application servers: all application servers that have jmx enabled.
use cases: the loaded and unloaded class count can be used for a variety of purposes. for example, if the loaded class count is constantly going up, then the app server or a class loader may have a bug. or if you perform upgrades without bringing down the jvm, you can use it to verify that classes were unloaded and then reloaded.
active thread count
location: under the threads tab.
supported application servers: all application servers that have jmx enabled.
use cases: you can use the thread count to determine how many active threads are running in your application. this is useful for determining usage trends. for example, it can show the time of day and the day of the week in which you usually reach peak thread count. in addition, the creation of too many threads can result in out of memory errors or thrashing. by watching this metric, you can reduce excessive memory consumption before it’s too late.
thread pool metrics
location: under the threads tab.
supported application servers: tomcat, jboss 5 and 6, resin, jetty, weblogic, tomee, glassfish, and websphere
use cases: thread pools are typically used to service multiple requests simultaneously. however, to get the best throughput, thread pools must be configured appropriately. for example, if the maximum thread count is set too high, the app will slow down from excessive memory usage. but if the maximum thread count is too low, it will cause requests to block or timeout.
you can use these metrics to see if you are reaching the maximum thread count in a pool. in addition, they can be used to tune other properties – such as the amount of time before an idle thread is destroyed and the frequency of when new threads are created.
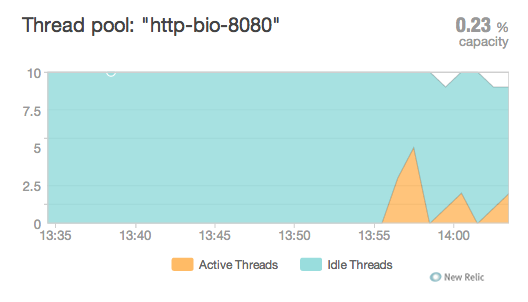
this graph displays information on the http-bio-8080 thread pool on a tomcat 7.0 application server. it shows that the thread pool starts with 10 idle threads and never handles more than five active requests at a time. the 0.23% capacity indicates that the number of active threads is well under the limit.
session metrics
location: under the http sessions tab.
supported application servers: tomcat, jboss 5 and 6, resin, tomee, glassfish, and websphere
use cases: http session information is used to determine usage trends such as the time of day when an application is getting the most amount of traffic. it can also be used to tune configuration properties such as the maximum number of active sessions allowed at one time and the amount of time a session remains active. for example, a high rejected session count usually indicates that the maximum active session count should be increased. meanwhile, a high expired session count can suggest that the session timeout is too low.
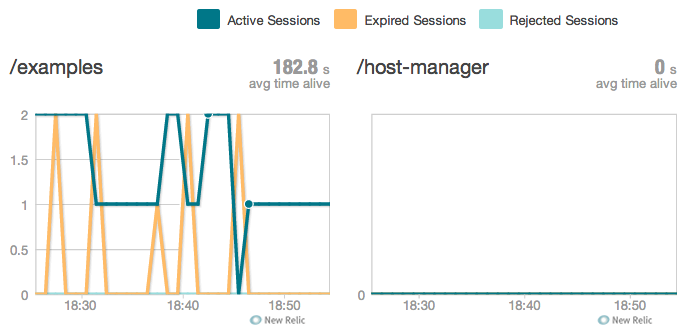
the graphs below show session information for two applications. the first indicates that a maximum of two sessions have been created for the application ‘examples’, but the sessions are constantly expiring. after increasing the timeout, the number of expired sessions reduces to zero. from the second graph, we see that zero sessions have been created for the application ‘host-manager’.
transaction metrics
location: under the app server transaction tab.
supported application servers: jboss 7, resin, and glassfish
use cases: these metrics show info on transactions that go through the application server’s transaction manager. they are used to show transaction traffic patterns and help to configure the transaction manager.
get started today
new relic uses java management extensions (jmx) to gather data on these new metrics. before you get started using these new metrics, you must update to our latest java agent and enable jmx on your application server.
you can also set up new relic to show custom jmx metrics. to see how to display custom metrics,
watch this video
.
Published at DZone with permission of Leigh Shevchik, DZone MVB. See the original article here.
Opinions expressed by DZone contributors are their own.


Comments