Docker Logging With the ELK Stack: Part I
There's no silver bullet when it comes to Docker logging. Docker logs are super useful, but they represent only one dimension of data being generated by your Docker host.
Join the DZone community and get the full member experience.
Join For FreeThe irony we face when trying to log Docker containers is that the very same reason we chose to use them in our architecture in the first place is also the biggest challenge.
Transiency, distribution, isolation — all of the prime reasons that we opt to use containers for running our applications are also the causes of huge headaches when attempting to build an effective centralized logging solution.
The ELK Stack (Elasticsearch, Logstash, and Kibana) is one way to overcome some, if not all, of these hurdles. While it is not always easy and straightforward to set up an ELK pipeline (the difficulty is determined by your environment specifications), the end result can look like this Kibana monitoring dashboard for Docker logs:
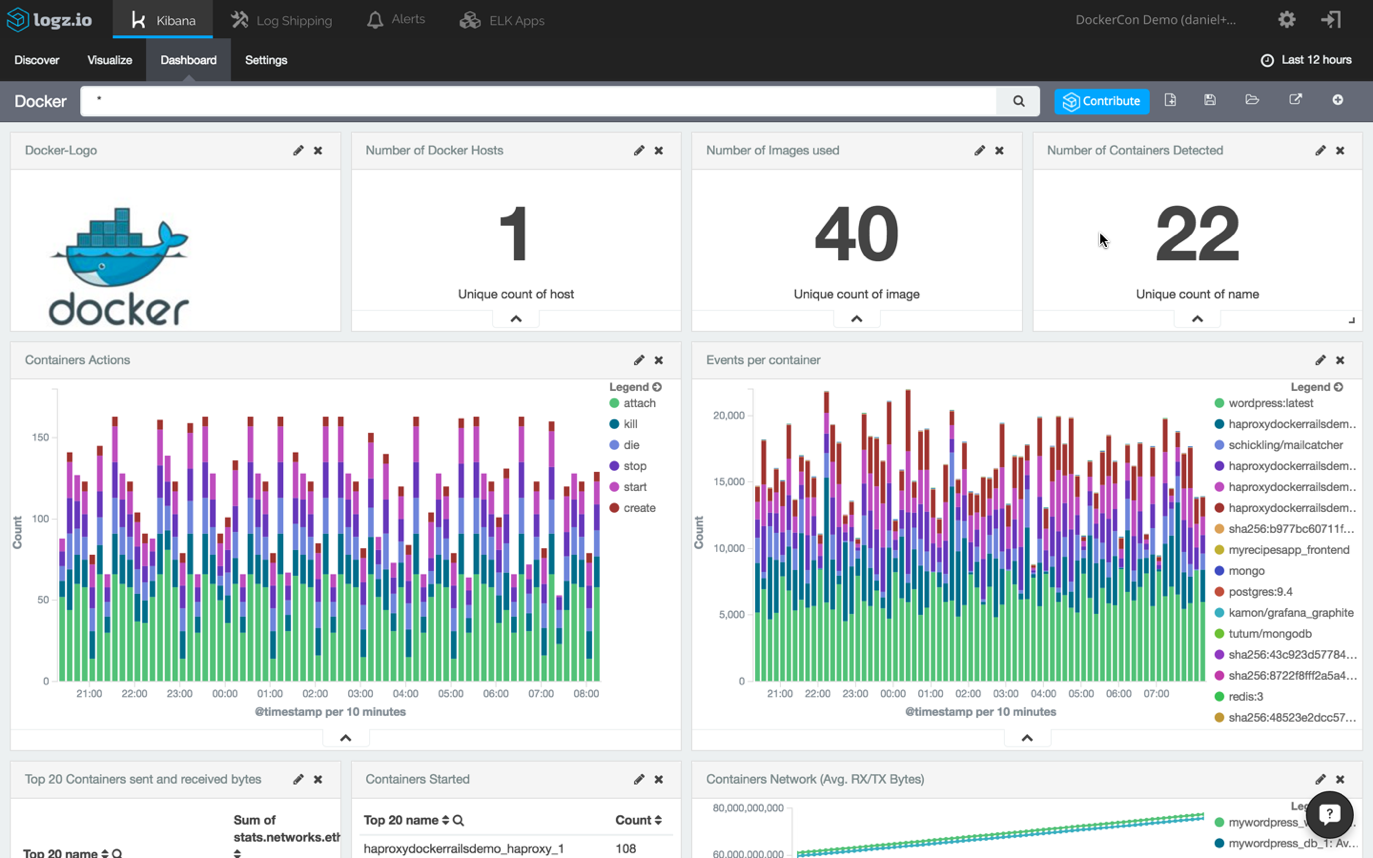
In honor of Docker’s fourth birthday, we will be writing a series of articles describing how to get started with logging a Dockerized environment with ELK. This first part will explain the basic steps of installing the different components of the stack and establishing pipelines of logs from your containers. The next part will focus on analysis and visualization.
Understanding the Pipeline
A typical ELK pipeline in a Dockerized environment looks like this:
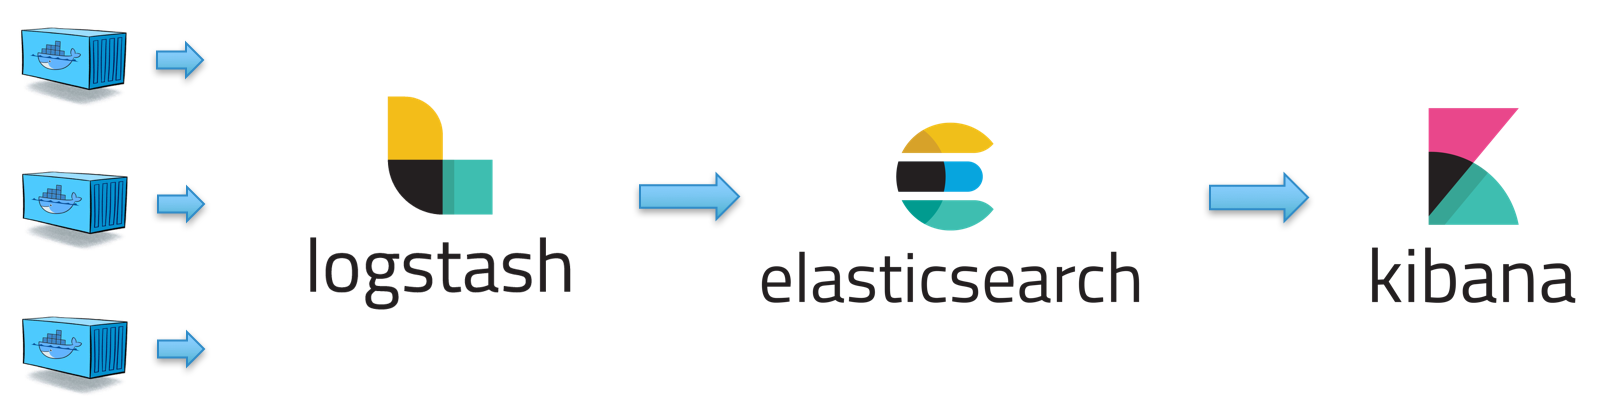
Logs are pulled from the various Docker containers and hosts by Logstash, the stack’s workhorse that applies filters to parse the logs better. Logstash forwards the logs to Elasticsearch for indexing, and Kibana analyzes and visualizes the data.
Of course, this pipeline has countless variations. For example, you could use a different log shipper, such as Fluentd or Filebeat, to send the logs to Elasticsearch. Or, you could add an additional layer comprised of a Kafka or Redis container to act as a buffer between Logstash and Elasticsearch. But the diagram above depicts the basic Docker-to-ELK pipeline and is a good place to start out your experimentation.
So, how does one go about setting up this pipeline?
Installing the Stack
There are various ways of integrating ELK with your Docker environment. You can install the stack locally or on a remote machine — or set up the different components using Docker.
There is still much debate on whether deploying ELK on Docker is a viable solution for production environments (resource consumption and networking are the main concerns) but it is definitely a cost-efficient method when setting up in development.
The Docker image for ELK I recommend using is this one. It has rich running options (so you can use tags to combine different versions), it has great documentation, and it is fully up to date with the latest versions of Elasticsearch, Logstash, and Kibana.
Before installing, make sure that the following ports are free: 5601 (for Kibana), 9200 (for Elasticsearch), and 5044 (for Logstash).
Also, make sure that the vm_max_map_count kernel setting is set to at least 262144:
sudo sysctl -w vm.max_map_count=262144To run the stack:
git clone https://github.com/deviantony/docker-elk.git
cd docker-elk
docker-compose up
By default, all three of the ELK services (Elasticsearch, Logstash, Kibana) are started. The image also persists /var/lib/elasticsearch — the directory that Elasticsearch stores its data in — as a volume.
sudo docker ps

CONTAINER ID        IMAGE                     COMMAND                  CREATED             STATUS              PORTS                                            NAMES

73aedc3939ad        dockerelk_kibana          "/bin/sh -c /usr/l..."   7 minutes ago       Up 6 minutes        0.0.0.0:5601->5601/tcp                           dockerelk_kibana_1

b684045be3d6        dockerelk_logstash        "logstash -f /usr/..."   7 minutes ago       Up 6 minutes        0.0.0.0:5000->5000/tcp                           dockerelk_logstash_1

a5778b8e4e6a        dockerelk_elasticsearch   "/bin/bash bin/es-..."   7 minutes ago       Up 7 minutes        0.0.0.0:9200->9200/tcp, 0.0.0.0:9300->9300/tcp   dockerelk_elasticsearch_1
Testing the Installation
To make sure all is working as expected, perform the following actions.
First, curl Elasticsearch with
curl localhost:9200You should see the following output:
{
"name" : "W3NuLnv",
"cluster_name" : "docker-cluster",
"cluster_uuid" : "fauVIbHoSE2SlN_nDzxxdA",
"version" : {
"number" : "5.2.1",
"build_hash" : "db0d481",
"build_date" : "2017-02-09T22:05:32.386Z",
"build_snapshot" : false,
"lucene_version" : "6.4.1"
},
"tagline" : "You Know, for Search"
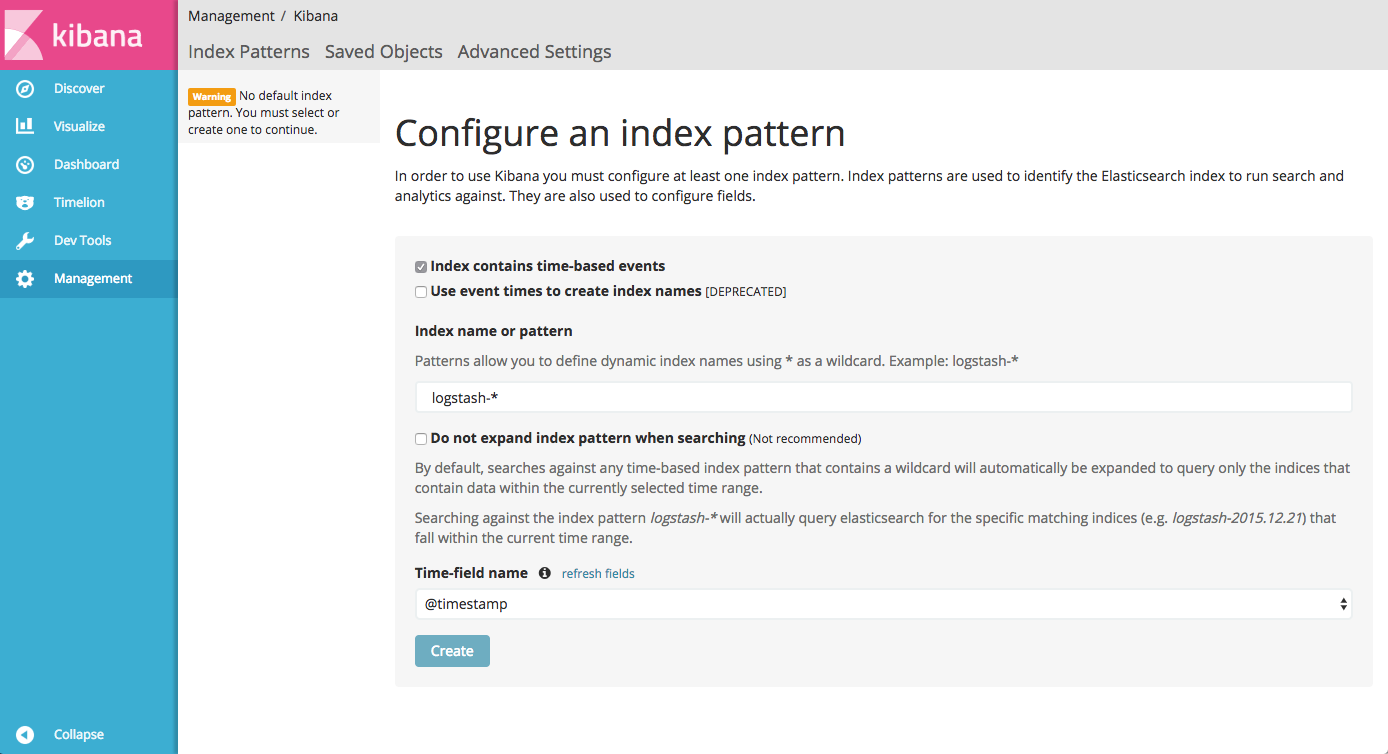
}Open Kibana at http://[serverIP]:5601:
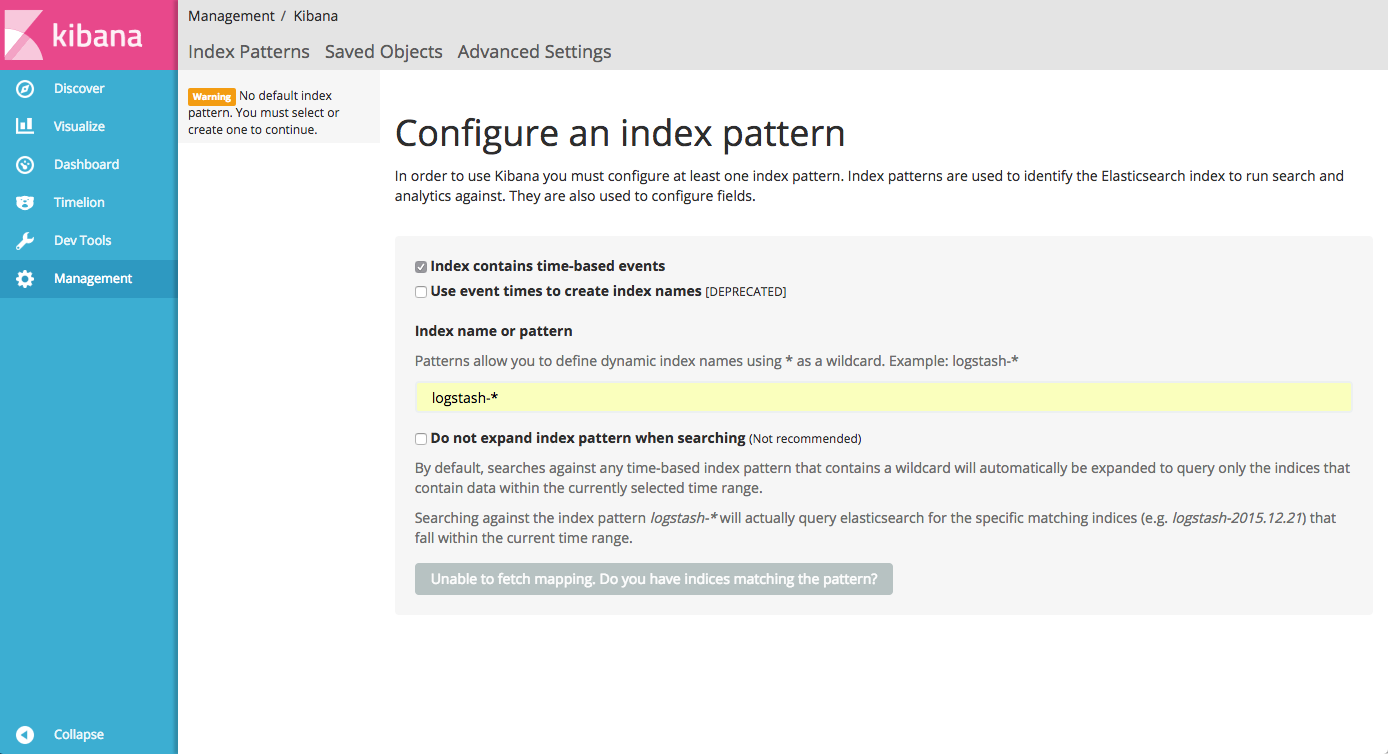
As you will notice, you are now required to enter an index pattern, which is only possible once you have indexed some logs. We will get to this later.
Shipping Docker Logs Into ELK
Installing the stack is the easy part. To ship your Docker logs into ELK is a bit more complicated, and the method you use greatly depends on how you are outputting your logs.
If not specified otherwise, the stdout and stderr outputs for a specific container, otherwise called “docker logs,” are outputted to a JSON file. So, if you have a smallish Docker environment set up, using Filebeat to collect the logs is the way to go. If you are using a different logging driver, however, you may want to consider a different method.
Below are three different methods to get your logs into ELK, but keep in mind that this list is by no means comprehensive. In fact, if you’re using a different method, feel free to share in the comments below.
Using Filebeat
Filebeat belongs to the Beats family of log shippers by Elastic. Written in Go, Filebeat is a lightweight shipper that traces specific files, supports encryption, and can be configured to export to either your Logstash container or directly to Elasticsearch.
As mentioned above, if you’re using the default JSON-file logging driver, Filebeat is a relatively easy way to ship into ELK. Filebeat can be deployed either on your host, or you can, of course, run it as a container alongside your ELK containers (in which case you will need to add linkage to the ELK containers). There are also various Filebeat Docker images available, and some include configurations for running Filebeat and connecting it to Logstash.
At the very least, your Filebeat configuration will need to specify the path to the JSON log file (located in /var/lib/docker/containers/…) and the details of the destination (usually the Logstash container).
An example configuration:
prospectors:
 - paths:
   - /var/log/containers/<xxx>
   document_type: syslog
output:
 logstash:
  enabled: true
  hosts:
      - elk:5044
Using a Logging Driver
Logging drivers were introduced by Docker in version 1.12 and allow you to run a container while specifying a third-party logging layer to which to route the Docker logs. You can forward logs to AWS CloudWatch, Fluentd, GELF, or a NAT server.
Using logging drivers relatively simple. But remember: They need to be specified per container, and they will require additional configuration on the receiving ends of the logs.
In the context of shipping logs into ELK, using the syslog logging driver is probably the easiest way to go.
Example:
docker run \
 --log-driver=syslog \
 --log-opt syslog-address=tcp://<SyslogServerIP>:5000
 \ --log-opt syslog-facility=daemon
 \ alpine ash
You will need to run this per container, and the result is a pipeline of Docker container logs being outputted into your syslog instance. These, in turn, will be forwarded to the Logstash container for parsing and data enhancement, and from there into Elasticsearch.
Using Logspout
Logspout is a popular and lightweight (15.2MB) log router for Docker that will attach itself to all the containers within a host and output the streams of Docker logs to a syslog server (unless you define a different output destination).
sudo docker run -d --name="logspout" --volume=/var/run/docker.sock:/var/run/docker.sock gliderlabs/logspout syslog+tls://<syslogServerIP>:5000You can use a Logstash module to route directly to your Logstash container, but this requires additional configurations and compilation work on your part.
The Logz.io Logging Collector
In this blog post, I described the log collector developed by Logz.io. Like Logspout, it attaches itself to all containers in a Docker host but its uniqueness lies in the fact that it ships not only Docker logs but also Docker stats and Docker daemon events.
docker run -d --restart=always -v /var/run/docker.sock:/var/run/docker.sock logzio/logzio-docker -t <YourLogz.ioToken>It is currently designed for users of the Logz.io ELK Stack, but we are working to open source the project. Feel free to give it a try yourself and hack it to ship to your Logstash instance.
Parsing the Data
The next stage in configuring Logstash to parse the data is crucial because this part of the process will add the context you need to your containers’ logs and enable you to analyze the data more easily.
Three main sections need to be configured in the Logstash configuration file: input, filter, and output. (If you’re running Logstash 5.x, this file is located here: /usr/share/logstash/pipeline).
The input depends on which log shipping method you are using. If you are using Filebeat, then you need to specify the Beats input plugin. If you are using logspout or the syslog logging driver, then you need to define syslog as the input.
The filter section contains all the filter plugins you wish to use to break up the log messages. These will greatly depend on the type of container you are logging and the generated log messages for that particular container.
There is no easy way to configure this section because every container is outputting a different type of logs. There is plenty of trial and error involved, but there are some online tools to help you along the way such as the Grok Debugger.
The export section will specify the Logstash output — in our case, the Elasticsearch container.
Here is a basic Logstash configuration example for Docker logs being shipped via syslog. Note the usage of a series of filters (grok, date, mutate, and the if conditional):
input {
 syslog {
      port => 5000
      type => "docker"
      }
}

filter {
      grok {
            match => { "message" => "%{SYSLOG5424PRI}%{NONNEGINT:ver} +(?:%{TIMESTAMP_ISO8601:ts}|-) +(?:%{HOSTNAME:service}|-) +(?:%{NOTSPACE:containerName}|-) +(?:%{NOTSPACE:proc}|-) +(?:%{WORD:msgid}|-) +(?:%{SYSLOG5424SD:sd}|-|) +%{GREEDYDATA:msg}" }
      }
      syslog_pri { }
      date {
            match => [ "syslog_timestamp", "MMM  d HH:mm:ss", "MMM dd HH:mm:ss" ]
      }
      mutate {
            remove_field => [ "message", "priority", "ts", "severity", "facility", "facility_label", "severity_label", "syslog5424_pri", "proc", "syslog_severity_code", "syslog_facility_code", "syslog_facility", "syslog_severity", "syslog_hostname", "syslog_message", "syslog_timestamp", "ver" ]
      }
      mutate {
            remove_tag => [ "_grokparsefailure_sysloginput" ]
      }
      mutate {
            gsub => [
                  "service", "[0123456789-]", ""
            ]
      }
      if [msg] =~ "^ *{" {
            json {
                  source => "msg"
            }
            if "_jsonparsefailure" in [tags] {
                  drop {}
            }
            mutate {
                  remove_field => [ "msg" ]
            }
      }
}

output {
 elasticsearch {
      hosts => "elasticsearch:9200"
      }
}
Do not forget to restart the Logstash container to apply the new configurations. To make sure your pipeline is working, first list Elasticsearch indices with curl 'localhost:9200/_cat/indices?v'.
You should see an index with a Logstash pattern:
health status index               uuid                   pri rep docs.count docs.deleted store.size pri.store.size

yellow open   logstash-2017.03.05 kgJ0P6jmQjOLNTSmnxsZWQ   5   1          3            0     10.1kb         10.1kb

yellow open   .kibana             09NHQ-TnQQmRBnVE2Y93Kw   1   1          1            0      3.2kb          3.2kb
Open Kibana again.
You will notice that the logstash-* index is identified by Kibana. Hit the Create button and you will see your logs displayed in Kibana.
Summary
There is no silver bullet when it comes to Docker logging. Whatever solution you choose — whether the use a logging driver, Filebeat, or even a SaaS monitoring platform — you will find that each has advantages and disadvantages.
Remember: Docker logs are super useful, but they represent only one dimension of data being generated by your Docker host. Retrieving container stats and daemon events requires additional logging layers.
As mentioned above, the Logz.io log collector provides a comprehensive logging solution, pulling the three streams of data together into ELK. If it’s stats you’re after — I also recommend giving Dockerbeat a try.
The next part of this series will focus on how to analyze and visualize your Docker logs in Kibana.
Published at DZone with permission of Daniel Berman. See the original article here.
Opinions expressed by DZone contributors are their own.
Comments